Towards an understanding of the Of?p star HD 191612:
Phase-resolved multiwavelength observations††thanks: Based on observations collected at the Haute-Provence Observatory (France) and with XMM-Newton, an ESA Science Mission with instruments and contributions directly funded by ESA Member States and the USA (NASA).
Abstract
We present the analysis of phase-resolved X-ray and optical observations of the peculiar hot star HD 191612 (Of?p). This star is known to display line-profile variations that are recurrent with a period of 538 d and its spectrum was found to present the signature of a magnetic field. In the X-rays, it is slightly overluminous compared to the canonical relation and appears brighter when the optical lines are strongest. Our XMM-Newton observations further reveal that the X-ray spectrum of HD 191612 exhibits rather broad lines and is dominated by a ‘cool’ (0.2-0.6 keV) thermal component, two characteristics at odds with the proposed magnetic rotator model. We also report for the first time the low-level variability of the metallic (abs/em) lines and He ii absorptions that appear to be associated with radial-velocity shifts. Finally, we compare our results with observations of the early-type stars and discuss several possible scenarios.
keywords:
stars: individual: HD 191612 – stars: early-type – X-rays: stars – X-rays: individual: HD 1916121 Introduction
In 1972, a new subtype of massive stars, the Of?p category, was defined (Walborn, 1972). It gathers stars that present C iii emission lines around 4650 Å of an intensity comparable to that of the neighbouring N iii lines. At that time, only two stars belonged to this category, HD 108 and HD 148937, but a third one was soon added, HD 191612 (Walborn, 1973).
Of the Of?p stars, HD 108 has been the most studied in the past, but conflicting results were reported by different authors. To attempt to resolve the confusing situation, a long-term observing campaign was undertaken at the Haute-Provence Observatory (Nazé et al., 2001). A detailed analysis of the data allowed most of the older models to be discarded and showed that the star displays line-profile variations in the Balmer and the He i lines. Nazé et al. (2001) also discovered that these line-profile variations seem to be recurrent with a timescale of approximately 50–60 years (see also Nazé et al. 2006).
Soon after, Walborn et al. (2003) reinvestigated another Of?p star, HD 191612, and discovered a similar phenomenon. Broad-band photometry of HD 191612 had been shown to exhibit a clear modulation with a period of 538 d (Koen & Eyer, 2002; Nazé, 2004) and comparison with the spectroscopic results indicated that the spectral variations and photometric changes are correlated: when the star is faint, its emission lines are weakest and the star presents an apparent O8 spectral type, whereas when it is brighter, the emission lines are at maximum and the spectral type is O6.5 (Walborn et al., 2004).
Recently, Donati et al. (2006a) reported the detection of a magnetic field through the analysis of the Zeeman signature in several lines of HD 191612, notably the variable He i lines. They proposed the star to be an evolved version of Ori C, the only O-type star for which a magnetic field had been convincingly measured until then. Donati et al. (2006a) suggested that the 538 d period of HD 191612 was related to the rotation period of the star, which would have been braked as a result of the intense magnetic field. Unfortunately, neither Donati et al. (2006a) nor other authors have yet observed a magnetic signature in HD 108 or modelled such a braking for this potential “twin” of HD 191612.
To understand better the nature of Of?p stars, a detailed study of their high-energy properties is needed. For HD 108, observations were taken with XMM-Newton in August 2002, revealing a thermal X-ray spectrum (Nazé et al., 2004). The star also appears slightly overluminous in X-rays. Moreover, its X-ray luminosity was not significantly different from the previous detections by and (noting, however, that the old data have very large error bars and that a decrease in flux by less than a factor of 2 could not be excluded). These X-ray observations ruled out a compact-companion scenario where the wind ionization structure would be affected by the varying X-ray emission from an accretion disk (Nazé et al., 2004).
The shorter and better-known period of HD 191612 allows us to study its X-ray properties at crucial phases of the 538 d cycle. Two years ago, a large observing campaign was therefore initiated to get multiwavelength, phase-resolved observations of HD 191612. We obtained four XMM-Newton pointings (PI: Nazé) and many visible echelle spectra with the 1.93 m telescope of the Haute-Provence Observatory (PI: Rauw). We present in this paper an analysis of these two datasets. Additional optical data will be reported by Howarth et al. (in prep.), and throughout this paper, we will use their ephemeris: (HJD)=2 453 415.20.6, =537.70.5d, where =0 corresponds to the maximum of the H emission (i.e. a phase shift of 0.5 compared to the ephemeris defined in Walborn et al. 2004).
This paper is organized as follows. Section 2 describes the observations while Sections 3 and 4 present the results of the X-ray and optical OHP campaign, respectively. These observations are further discussed in Sect. 5 and we finally conclude in Sect. 6.
2 Observations
2.1 Haute-Provence Observatory
Spectroscopic observations of HD 191612 in the visible domain were gathered during two years at the Haute-Provence Observatory (OHP). Most of the data were obtained with the 1.93 m telescope equipped with the Elodie echelle spectrograph, which covers the 3850–6800 Å wavelength range at a resolving power of 42 000. Exposure times between 30 and 60 minutes were used, and the signal-to-noise ratio was generally about 100 or more. The Aurélie spectrograph at the 1.52 m telescope enabled us to get a few additional spectra. Three different settings were used: one covering the range 6360–6750 Å at a resolving power of 11000, the second 5480–5910 Å at =9000, and the last 4450–4900 Å at =7000. Typical exposure times were 15 minutes. All the reductions were performed using the midas software developed at ESO.
2.2 XMM-Newton
HD 191612 was observed four times with XMM-Newton for approximately 10–20 ks in 2005: Revolution (Rev.) 975 on Apr. 5, Rev. 981 on Apr. 17, Rev. 1004 on June 2 and Rev. 1068 on Oct. 8. For these observations, the three European Photon Imaging Cameras (EPICs) were operated in the standard, full-frame mode and a medium filter was used to reject optical light. The second observation (Rev. 981) was granted because the first data were affected by a rather long background flare; unfortunately, a long episode of high radiation took place at the time of this replacement observation, rendering the data very noisy.
We used the Science Analysis System (SAS) software, version 6.5, to reduce the X-ray data. They were first processed through the pipeline chains (tasks emproc, epproc and rgsproc), and then filtered in order to keep only the best data: as recommended by the SAS team, we kept for the EPIC MOS (Metal Oxide Semi-conductor) detectors single, double, triple and quadruple events (i.e. pattern between 0 and 12) that pass through the #XMMEA_EM filter; for the EPIC pn detector, only single and double events (i.e. pattern between 0 and 4) with flag0 were considered.
To check for contamination by low-energy protons, we have further examined the light curve at high energies (Pulse Invariant channel number10000, E10 keV, and with pattern0). Where background flares were detected, we discarded the time intervals presenting high count rates (larger than 0.6 cts s-1 for EPIC MOS, 4.0 cts s-1 for EPIC pn, and 4–7.5 cts s-1 over the full energy range of the Reflection Grating Spectrometer, RGS). The best observations (i.e. Revs. 975, 1004, and 1068) were also combined with the tasks merge for EPIC or rgscombine for RGS. Further analysis was performed using the SAS, the FTOOLS tasks and the XSPEC software v 11.2.0. A table, available electronically at the CDS 111http://cdsweb.u-strasbg.fr/, provides the X-ray properties of all the sources detected in the field.
3 X-ray Results
3.1 Light-curve
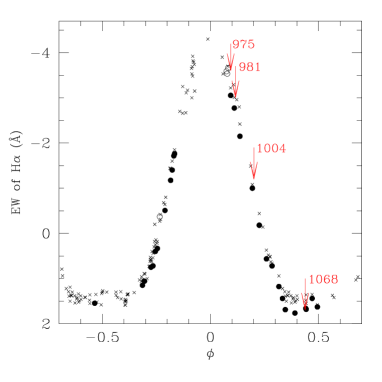
The X-ray observations were planned to sample crucial phases in the 538 d period (Fig. 1): the first observation was taken near the time of maximum emission in the visible domain while the last one was made during the ‘quiescent’, low emission phase. All the X-ray data were taken during the same 538 d cycle.
The count rate of HD 191612, evaluated using the task edetect_chain, decreased by 40% between the first (Apr. 5, Rev. 975, =0.1) and the last (Oct. 8, Rev. 1068, =0.4) observations, as shown In Fig. 2. At the same time, simultaneous visible observations taken at the OHP display a weakening of the emissions in the H and He i lines, as expected. From a detailed study of the behaviour in the visible of HD 191612 (Walborn et al., 2004), we know that these spectroscopic changes correspond to a decrease of the broad-band luminosity. Within the limitations of our dataset, our observations therefore suggest that the X-rays follow the behaviour observed in the visible range. Further data are however needed to fully assert this conclusion.
Note that such a modest decrease in the X-rays could not be detected in the low signal-to-noise ROSAT data of Of?p stars; the result is thus consistent with the non-detection of such variations in HD 108 (Nazé et al., 2004). Finally, on short timescales (i.e. during one pointing), we detected no significant variations of the X-ray emission. In fact, O stars generally lack variations on timescales this short (see, e.g., Sana et al. 2006).
Looking at the hardness ratios of HD 191612 (Fig. 2), two different behaviours appear, depending on the energy range considered: at lower energies (0.4–2.0 keV), the decreasing X-ray emission clearly softens with time whereas the proportion of the harder emissions in the 1–2 keV and 2–10 keV ranges does not change significantly with phase.

3.2 Low-Dispersion Spectroscopy
EPIC spectra of HD 191612 were extracted over a circular region with radius 30″centred on the star. A faint source is present near HD 191612, so we did not choose an annular background region, but rather a nearby circle devoid of sources. For a colour excess of 0.59 (Savage et al., 1985), the interstellar absorbing column can be estimated as cm-2 (using the relations of Bohlin et al., 1978). In the spectral modelling, we do not allow the absorption to go below this threshold.
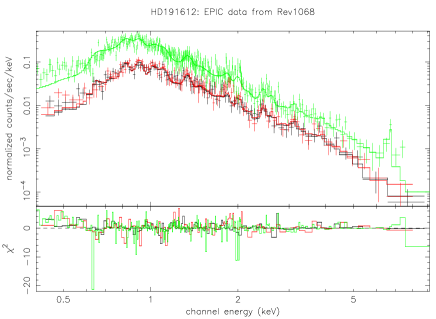
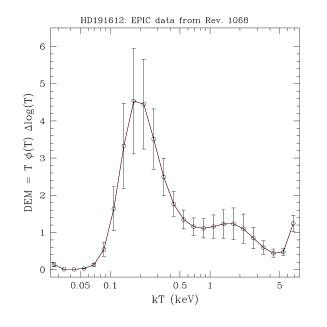
The spectra from each instrument were fitted separately, but as they gave consistent results, within the errors, we finally fit all EPIC data simultaneously (Fig. 3). Fits using only one thermal component were unacceptable (). We rather used the sum of two absorbed, optically thin equilibrium plasma models (, Kaastra 1992). Since these two thermal components could arise in different regions of the wind, we allow them to be absorbed by independent column densities (). The best fit was obtained when the cooler component dominates, as is typically observed for ‘normal’ O-type stars (see, e.g., Sana et al. 2006). In fact, two sets of parameters gave similar values of the chi-squared (see Table 1), one with temperatures k around 0.6 and 1.0–2.5 keV and negligible absorbing columns ; the other with lower temperatures (0.24 and 1.0–1.6 keV) and larger columns ( and cm-2). The latter solution presents slightly lower , even when including RGS data. Moreover, a fit of the EPIC data with a differential emission-measure model (DEM, , Lemen et al. 1989; Singh et al. 1996) confirms the existence of a dominant temperature near 0.2 keV whilst a secondary hump in the DEM distribution appears at 1–2 keV (Fig. 3).
Using bolometric corrections from Humphreys & McElroy (1984) and the optical properties of HD 108 (=7.4, =0.18, =2.51 kpc) and of HD 191612 (=7.8, =0.27, =2.29 kpc, Gies 1987), we calculated the bolometric luminosities of both objects: =1.6 erg s-1 for HD 108 and 1.2 erg s-1 for HD 191612. The X-ray luminosities , evaluated from the EPIC data in the 0.5–10.0 keV range and corrected for interstellar absorption, are 1.2 erg s-1 for HD 108 (Nazé et al., 2004) and erg s-1 for HD 191612 (this work). This results in ratios of 6.1 for HD 108 and 6.1 to 6.2 for HD 191612. The values of the ratio are thus five times larger than that of the ‘canonical’ relation (6.91 in the most recent determination of Sana et al. 2006), as shown in Fig. 4. This overluminosity is slight but significant, since the new study by Sana et al. (2006) shows that the scatter around the ‘canonical’ relation is only about 20%.
The parameters found for HD 191612 (two temperatures, soft/hard character, overluminosity) are very similar to those found for HD 108 by Nazé et al. (2004), confirming the similarities between these two Of?p stars, even in the X-ray domain.

| Date | Rev. | k | k | (dof) | |||||||
| cm-2 | keV | cm-5 | cm-2 | keV | cm-5 | ( erg cm-2 s-1) | |||||
| ‘cool’ model | |||||||||||
| 05/04/05 | 975 | 0.09 | 1.16 (411) | 7.0 | 14.1 | ||||||
| 17/04/05 | 981 | 0.12 | 1.10 (681) | 6.8 | 14.3 | ||||||
| 02/06/05 | 1004 | 0.20 | 1.15 (460) | 6.0 | 12.5 | ||||||
| 08/10/05 | 1068 | 0.44 | 1.31 (555) | 5.3 | 11.0 | ||||||
| ‘hot’ model | |||||||||||
| 05/04/05 | 975 | 0.09 | 0.64 | 0.28 | 1.19 (411) | 7.6 | 14.4 | ||||
| 17/04/05 | 981 | 0.12 | 1.08 (681) | 7.0 | 13.9 | ||||||
| 02/06/05 | 1004 | 0.20 | 1.16 (460) | 5.8 | 12.0 | ||||||
| 08/10/05 | 1068 | 0.44 | 1.39 (555) | 5.4 | 11.0 | ||||||
3.3 High-Resolution Spectroscopy
Due to the weakness of HD 191612 in X-rays, individual RGS spectra do not have enough counts for a sound analysis (see, however, below). We have therefore first combined the data from the three observations with the lowest background levels (i.e., Revs. 975, 1004, and 1068) using the task rgscombine and then assembled the first and second-order spectra of both instruments into a single RGS spectrum by means of the rgsfluxer command.


Figure 5 shows the resulting RGS spectrum in the wavelength range 8–20 Å. Due to the rather heavy interstellar and circumstellar absorption, and the weakness of the source, the signal-to-noise ratio of RGS data above Å is too low to be useful. The spectrum of HD 191612 is clearly dominated by emission lines and, apart from some higher excitation lines (e.g. Fe xviii) that appear relatively strong here, it looks quite similar to the RGS spectrum of typical O stars such as Pup (Kahn et al., 2001). In particular, we note that the RGS spectra do not show a strong bremsstrahlung continuum emission unlike what is seen in the HETG spectra of the colliding-wind binary WR140 (Pollock et al., 2005) or the peculiar magnetic O star Ori C (Schulz et al., 2000).
We identified the strongest lines by comparison with the line list of the SPEX plasma code (Kaastra et al., 2002). The most prominent lines are hydrogen- and helium-like transitions from Mg, Ne, and O together with lines from Fe xvii and Fe xviii (see Fig. 5). We also note the possible presence of weak spectral signatures of additional iron ions; for example, the strongest Fe xix line ( 13.52) might be present, but would be heavily blended with the strong Ne ix He-like triplet. The strongest Fe xx lines could actually be responsible for the low-level features near 12.8 Å, whilst the strongest Fe xxi line ( 12.29) could account for some of the breadth of the Ne x Ly line. The spectral signature of these additional ionization stages of iron is indeed expected since the EPIC spectra reveal the likely presence of an Fe XXV line at 6.7 keV. The temperatures of maximum emissivity of the most prominent lines seen in the RGS spectra span a range from – K (O vii and O viii) to – K (Fe xviii and Mg xii). These values, in agreement with the results from the low-dispersion spectroscopy, are again very similar to those found for the Of?p star HD 108 (Nazé et al., 2004).
The rather limited signal-to-noise ratio of the spectrum prevents us from doing a detailed profile analysis for individual lines. We have nevertheless measured the fwhm of O viii Ly and the strong Fe xvii 15.014 line on the combined (unsmoothed) RGS spectrum, finding fwhm values between 2000 and 2600 km s-1. We also tentatively performed a global fit of the X-ray lines by a single triangular222The triangular profile gives an unbiased estimate of any shift and asymmetry and is similar to several proposed theoretical profiles. profile whose amplitude was allowed to vary from line to line but whose width and shift were taken to be the same for all lines. Within the limit of our RGS data, we detect no blue/red shift 250 km s-1nor any significant line asymmetry. The FWHM is found to be about 1800400 km s-1, or 70-85% of the terminal velocity (Walborn et al., 2003), suggesting again rather broad lines. As the above values correspond to about twice the instrumental resolution, it seems that the spectral lines of HD 191612 are indeed broad and can be resolved with the RGS.
The strength of some of the spectral lines changes between the various XMM-Newton pointings. For instance, the Fe xviii lines appear strongest in the spectrum from June 2 (Rev. 1004, =0.2), when the star is in an intermediate state: at that time, Fe xviii 14.212, 14.260 have an intensity comparable to that of Fe xvii 15.014. However, these lines are weaker in the first and last observations (Revs. 975 and 1068, =0.1 and 0.4; Fig. 6). A similar difference is seen for the Ne x and Ne ix lines. These variations most probably reflect the changing hardness ratio measured from the EPIC data of HD 191612.


4 Properties in the optical range
To identify the lines displaying variability, we computed a Temporal Variance Spectrum (TVS, Fullerton et al. 1996) for the Elodie data set (shown partly on Fig. 7). As already mentioned in Nazé et al. (2001) for HD 108 and in Walborn et al. (2003) for HD 191612, the most significant profile variations are found in the Balmer and He i lines. The TVS of these lines displays a roughly gaussian shape centered on the rest wavelength. It is important to note that the blue wings of the profiles, unaffected by the emission, exhibit very little variability (Fig. 8). The Balmer and He i lines thus consist of an apparently constant333Because of the presence of the varying emission, small RV variations as those exhibited by the metallic lines (see below) would not be detectable for the observed H and He i lines. absorption component with a superimposed varying emission profile extending from approximately 200 to 200 km s-1. For O-type stars, a strong C iii 4649,4650 emission is quite rare. Its presence in HD 191612 cannot be due to an abundance effect (Walborn, 2001) because the strength of these lines varies while C iii 5696 remains constant. Since the emission mechanism of C iii 4649,4650 is rather complex (Andrillat & Vreux, 1975), the explanation of their variability requires detailed atmospheric modelling.
On the other hand, now that we have data with high signal-to-noise covering the whole 538 d period, we see that almost all lines present significant changes (Fig. 7). The variability characteristics, though, are different from those of the Balmer and He i lines since their TVS generally displays a double-peaked shape (Fig. 8).
We have analyzed further the spectral variations by using techniques similar to those of Rauw et al. (2001). At every wavelength step, we have fitted a sine wave of frequency 1/537.7 d-1 to our time series. Fig. 8 shows the amplitude and the phase of this sine wave as a function of radial velocity for two different spectral regions. Note that the phase has no physical meaning outside the wavelength domain where a significant variation is detected. This explains the noisy phases appearing at the extremes of our velocity interval.
Once again, the two subsets of lines display different behaviours, in phase as well as in amplitude. Absorption lines from He ii and abs./em. lines from metals present a double-peaked amplitude profile and a varying phase, whereas for the Balmer and He i lines, the amplitude profile is gaussian and the phase is rather constant (Fig. 8). We note however that a small double-peaked feature is apparently superimposed on the gaussian amplitude profile for the weakest He i lines and He ii 4686.
To further study the spectral behaviour of HD 191612, we decided to focus on the C iv 5801,5812 lines since (1) in our data, these lines belong to the domain presenting the highest signal-to-noise ratio and (2) they display a very clean gaussian shape that does not seem affected by any residual emission or distortion of the line profile. These lines are thus most likely to arise in the stellar photosphere, unlike the Balmer and He i lines which are often contaminated by variable wind emission. The results obtained from these C iv lines should therefore remain unaffected by strong noise or changing wind properties.
First, the equivalent widths (EWs) were measured by integrating the line profiles and we found that they remain rather stable, with an apparently stochastic variability of maximum 10%. A similar result was found for other probable photospheric lines (i.e. metallic lines and He ii absorptions). In marked contrast, the variable hydrogen, He i and He ii 4686 lines follow a very different behaviour, as was described in Walborn et al. (2004) for H: their EWs first rise smoothly, reach a maximum emission level and then decline smoothly (Fig. 1).


The radial velocities (RVs) were determined by fitting a gaussian to the C iv line profile. They appear systematically larger in the last OHP observations (Fig. 9). Again, similar results were found for the other strong metallic lines and the He ii 4542,5412 absorption lines (where the RVs were derived from a gaussian fit to the bottom - resp. top - of the absorption - resp. emission - profile).
Since the C iv lines are most probably of photospheric nature, their apparent motion can a priori be attributed to the star itself with some confidence. Although the periodic behaviour of these RVs cannot be assessed here with confidence, such a trend in RVs together with the double-peaked profile of their TVS suggest a binary nature for HD 191612 (although probably with a period differing from 538 d).
The case of the He ii 4686 emission line is peculiar: the RV of its emission peak follows the same trend as the RVs of metals when the emission is minimum (Fig. 9). This suggests that there are two components to the emission of He ii 4686, one varies in harmony with the Balmer lines (and thus represents an additional emission) while the other simply shifts in wavelength as for the metallic lines (thus probably belonging to the star). Note that an additional component, in absorption, is also clearly detected. This might indicate the presence of a companion.
5 Discussion
After presenting the detailed analysis of the phase-resolved observations taken in the X-ray and optical ranges, we now discuss the implications of these results on the possible nature of HD 191612.
5.1 HD 191612, a magnetic oblique rotator?
Because of the detection of a magnetic field, one may think of HD 191612 as an analogue to the other two magnetic hot stars Ori C and Sco (see e.g. Donati et al. 2006a). Indeed, these systems share several similarities (see Table 2 for a comparison). For example, they display large magnetic confinement parameters () and their Alfvén radii are also similar (about 2 R∗; Donati et al. 2006a, b). In addition, their ratios, 6.0 for Ori C and up to 6.1 for HD 191612, indicate an important overluminosity in X-rays compared to ‘typical’ O stars (Fig. 4). Finally, these three magnetic objects display variations in the X-rays that seem correlated to those observed in the visible domain (Gagné et al., 2005, this work).
However, our new data also reveal many differences. First of all, the X-ray spectra of Ori C and Sco are much harder than that of HD 191612. The temperatures of the hot plasma of Ori C amount to 0.7 and 2.6 keV (i.e. 8 and 30MK; Gagné et al., 2005) where the higher-temperature component clearly dominates. The opposite situation is found for HD 191612, even in the case of the ‘hot’ fit. This distinct behaviour cannot be attributed to extrinsic causes since both systems share similar interstellar absorption: the hard X-ray emission of HD 191612 is thus unlikely to be hidden by a high extrinsic column density.
Differences are also evident when considering Sco, which has a somewhat softer spectrum than Ori C. In this case, the differences can be best appreciated by comparing the differential emission-measure fit given by Mewe et al. (2003) with ours: again, the hard component is much reduced for HD 191612. The ‘hard’ character of the X-ray emission of Ori C and Sco is also revealed by the presence of several strong, high-ionization lines (e.g. Fe xxiv) which are weak or absent in the spectrum of HD 191612.
We also note that Ori C presents a prominent bremsstrahlung continuum in its X-ray spectrum which is a clear indication that the emission-measure distribution is dominated by high temperatures. No such feature is seen in the case of HD 191612.
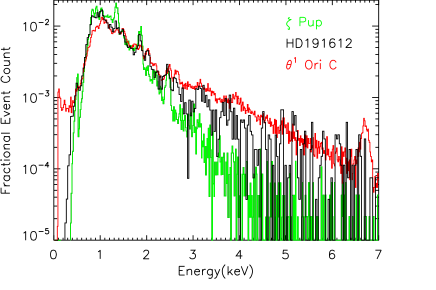
In addition, the X-ray emission of Ori C and Sco consists of very narrow lines (FWHM well below 1000 km s-1; see Gagné et al. 2005; Cohen et al. 2003), as predicted theoretically for a magnetically confined wind, but this is not the case for HD 191612, as was shown in Sect. 3.3. Even the broadest lines of Ori C and Sco (notably O viii Ly and the strong Fe xvii 15.014 line) are still narrower than the lines of HD 191612. The line width measured for HD 191612 is actually much more similar to that determined for ‘normal’ O stars. In many respects, HD 191612 thus appears as an intermediate case between the magnetic objects and the typical O stars (Fig. 10).
Finally, we note that the behaviour of HD 191612 in the visible range also differs somewhat from that of Ori C, although it is difficult to compare them in detail. In fact, while the spectral variability of HD 191612 is now well known, this is not always the case for Ori C: for example, variations of the He i 4471/He ii 4542 ratio of Ori C were reported by Walborn (1981) but the same ratio was subsequently found constant (Stahl et al., 1993).
| Object | sp. type | Ṁ | Period | |||||||
|---|---|---|---|---|---|---|---|---|---|---|
| () | (kK) | ( yr -1) | (km s-1) | (G) | (erg s-1) | (d) | ||||
| HD 191612 | O6 | 16.7 | 37 | 6.1 | 2600 | 5.9 | 1500 | 7.6 | 7–9 | 538 |
| O8 | 18.7 | 35 | 2.5 | 2100 | 2.4 | 29. | ||||
| Ori C | O5.5V hot | 8.3 | 45 | 1.4 | 2980 | 4.7 | 1060 | 3.6 | 0.8–1.1 | 15 |
| O5.5V cool | 9.1 | 42 | 5.5 | 2760 | 1.7 | 12 | ||||
| Sco | B0V | 5.2 | 32 | 2 | 2000 | 0.3 | not dip. | 40 | 2–3 | 41 |
The differences between HD 191612 and Ori C or Sco, especially in the X-ray domain, are quite puzzling, in view of other similarities. One could imagine that the larger mass-loss rate of HD 191612 compared to Ori C would prevent us from seeing the X-ray emission from material in the magnetosphere (i.e. below the Alfvén radius). However, recent analyses of the X-ray line profiles of Pup (Kranmer et al., 2003) and Ori (Cohen et al., 2006) indicate that in these stars (which are more similar to HD 191612 as far as is concerned), X-ray emission from down to 1.5 can be observed. Therefore, if there is a magnetically confined wind region in HD 191612, we would expect to be able to see its X-ray emission, unless the actual magnetic field of HD 191612 is much lower than the dipolar one (1.5kG) inferred by Donati et al. (2006a). This is indeed possible since the exact magnetic configuration of HD 191612 is not yet known (only one phase was observed by Donati et al.). The discrepancies found between the actual properties of HD 191612 and the magnetic oblique rotator model (as represented by Ori C) indicate that the emission mechanisms of these peculiar stars is not fully understood yet.
5.2 Alternative Scenarios
Since there are still problems with the magnetic oblique rotator scenario, we might envisage alternative models. If we assume that the RV variations are periodic and indeed provide the signature of a binary, the low amplitude of the RV curve (30 km s-1) would suggest a low mass function, which leaves us with two possibilities.
First, that the system of HD 191612 is seen at a low inclination and is then composed of two ‘normal’ early-type stars. In this case, one may immediately think of colliding-wind (CW) phenomena. Indeed, Sana et al. (2006) found that large ratios were displayed by the only two CW systems in their sample (see Fig. 4). In addition, the presence of a high-temperature component in the X-ray spectrum, and the modulations of the optical and X-ray emissions, are generally considered as typical signatures of this phenomenon. However, a detailed hydrodynamical simulation would be required to predict the putative colliding-wind emissions and their variations; while further X-ray observations are necessary to define better the correlations between X-ray and optical variations. In addition, no obvious signature of a massive companion has yet been detected in optical observations, except maybe for the peculiar shape of the He ii 4686 profile (but see Howarth et al., in prep.).
On the other hand, HD 191612 could be a high-inclination system with a lower-mass companion. Owing to the youth of HD 191612, this companion, if stellar, should still be pre-main-sequence (PMS) but the low luminosity of such objects ( for a 7M⊙ star, Siess et al., 2000) compared to mid-O-type stars could prevent its emission being seen in the composite spectrum of the system. The alternative case of an accreting, compact object seems more promising. Of course, high accretion rates can be readily ruled out since they would lead to a much larger X-ray luminosity (see Nazé et al. 2004 and references therein). However, the observed slight overluminosity in X-rays might be compatible with low to moderate accretion rates. Variations of the optical and X-ray emissions would be explained by the eccentricity of the orbit. However, this model also encounters difficulties when analyzed in detail: for example, such an eccentric orbit would result in asymmetric EW curves for H and similar lines, which is not the case.
6 Conclusions
We have obtained phase-resolved observations of HD 191612 with XMM-Newton and the Elodie/Aurélie spectrographs of the OHP.
In the high-energy domain, the star presents the spectrum of thermal plasmas with temperatures of 0.2–0.6 and 1–2 keV. The cooler component dominates, and no strong lines with ionization higher than Fe xviii are observed. The width of the X-ray lines, measured in the high-resolution RGS spectra, is 1800400 km s-1. These results, which are similar to those found for ‘normal’ O stars, are at odds with the predictions of a simple magnetic rotator model. Although no variability is detected during each pointing, the X-ray flux decreased by 40% between the first and last XMM-Newton observations which were taken during high and low emission states (as defined in the visible), respectively. The high-energy variations might thus follow the optical changes. The average X-ray flux exceeds by a factor of 5 that derived from the ‘canonical’ relation.
A clear dichotomy is seen in the behaviour of the optical lines. On the one hand, the hydrogen and He i lines display a relatively constant absorption superimposed on an emission of varying intensity (centred on the rest wavelength). On the other hand, our high quality dataset enabled us to detect for the first time the variations of the He ii absorptions and metallic (abs. or em.) lines. This variability is apparently associated with shifts in radial velocity (up to 30 km s-1) which are reminiscent of a binary motion.
The He ii 4686 line displays a mixed behaviour which could tentatively be explained by the presence of three components: an emission following the behaviour of the H and He i lines, an emission shifting in RV as the metallic lines, and one additional absorption, probably of stellar origin.
With these new data, the mystery deepens on the nature of Of?p stars: HD 108 and HD 191612 display some properties of typical O-type stars but also share some similarities with peculiar objects such as Ori C (Fig. 10). The puzzling results from our multiwavelength campaign thus challenge the models proposed to explain the behaviour of HD 191612.
Acknowledgments
We are grateful to the OHP observers who have taken data for us in the framework of our Elodie service monitoring campaign as well as to Michaël De Becker for taking some of the Aurélie data. The Liège team acknowledges support from the Fonds National de la Recherche Scientifique (Belgium) and the PRODEX XMM and Integral contracts. Part of the OHP observations have been funded by the OPTICON access programme supported by the European Commission’s 6th Framework Programme. This research is also partly supported by contracts P5/36 “Pôle d’Attraction Interuniversitaire” (Belgian Federal Science Policy Office).
References
- Andrillat & Vreux (1975) Andrillat Y., & Vreux J.-M. 1975, A&A, 41, 133
- Barannikov (1999) Barannikov A.A.,1999, Astron. Let. 25, 169
- Bohlin et al. (1978) Bohlin R.C., Savage B.D., & Drake J.F. 1978, ApJ, 224, 132
- Cohen et al. (2003) Cohen D.H., de Messières G.E., MacFarlane J.J., Miller N.A., Cassinelli J.P., Owocki S.P., & Liedahl, D.A. 2003, ApJ, 586, 495
- Cohen et al. (2006) Cohen D.H., Leutenegger M.A., Grizzard K.T., et al. 2006, MNRAS, 368, 1905
- Donati et al. (2006a) Donati J.-F., Howarth I.D., Bouret J.-C., Petit P., Catala C., & Landstreet J. 2006a, MNRAS, 365, L6
- Donati et al. (2006b) Donati J.-F., Howarth I.D., Jardine M.M., et al. 2006b, MNRAS, in press (astro-ph/0606156)
- Fullerton et al. (1996) Fullerton A.W., Gies D.R., & Bolton C.T. 1996, ApJS, 103, 475
- Gagné et al. (2005) Gagné M., Oksala M.E., Cohen D.H., et al. 2005, ApJ, 628, 986
- Gies (1987) Gies D.R. 1987, ApJS, 64, 545
- Humphreys & McElroy (1984) Humphreys R.M., & Mc Elroy D.B. 1984, ApJ, 284, 565
- Hutchings (1975) Hutchings J.B. 1975, ApJ 200, 122
- Kaastra (1992) Kaastra J.S. 1992, An X-Ray Spectral Code for Optically Thin Plasmas (Internal SRON-Leiden Rep., Version 2.0)
- Kaastra et al. (2002) Kaastra J.S., Mewe R., & Raassen A.J.J. 2002, private communication
- Kahn et al. (2001) Kahn S.M., Leutenegger M.A., Cottam J., et al. 2001, A&A, 365, L312
- Koen & Eyer (2002) Koen C., & Eyer L. 2002, MNRAS, 331, 45
- Kranmer et al. (2003) Kramer R.H., Cohen D.H., & Owocki S.P. 2003, ApJ, 592, 532
- Lemen et al. (1989) Lemen, J. R., Mewe, R., Schrijver, C. J., & Fludra, A. 1989, ApJ, 341, 474
- Mewe et al. (2003) Mewe R., Raassen A.J J., Cassinelli J.P., van der Hucht K.A., Miller N.A., & Güdel M. 2003, A&A, 398, 203
- Nazé (2004) Nazé Y. 2004, PhD thesis, Université de Liège
- Nazé et al. (2001) Nazé Y., Vreux J.-M., Rauw G. 2001, A&A 372, 195
- Nazé et al. (2004) Nazé, Y., Rauw, G., Vreux, J.-M., & De Becker, M. 2004, A&A, 417, 667
- Nazé et al. (2006) Nazé Y., Barbieri C., Segafredo A., Rauw G., & De Becker M. 2006, IBVS, 5693
- Pollock et al. (2005) Pollock A.M.T., Corcoran M.F., Stevens I.R., & Williams P.M. 2005, ApJ, 629, 482
- Rauw et al. (2001) Rauw G., Morrison N.D., Vreux J.-M., Gosset E., & Mulliss, C.L. 2001, A&A, 366, 585
- Sana et al. (2006) Sana H., Rauw G., Nazé Y., Gosset E., & Vreux J.-M. 2006, MNRAS, submitted
- Savage et al. (1985) Savage B.D., Massa D., Meade M., & Wesselius P.R. 1985, ApJS, 59, 397
- Schulz et al. (2000) Schulz N.S., Canizares C.R., Huenemoerder D., & Lee J.C. 2000, ApJ, 545, L135
- Siess et al. (2000) Siess L., Dufour E., & Forestini M. 2000, A&A, 358, 593
- Singh et al. (1996) Singh K.P., White N.E., & Drake S.A. 1996, ApJ, 456, 766
- Stahl et al. (1993) Stahl O., Wolf B., Gäng T., Gummersbach C.A., Kaufer A., & Kovacs J. 1993, A&A, 274, L29
- Underhill (1994) Underhill A.B. 1994, ApJ 420, 869
- Vreux & Conti (1979) Vreux J.-M., Conti P.S. 1979, ApJ 228, 220
- Walborn (1972) Walborn N.R. 1972, AJ, 77, 312
- Walborn (1973) Walborn N.R. 1973, AJ, 78, 1067
- Walborn (1981) Walborn N.R. 1981, ApJ, 243, L37
- Walborn (2001) Walborn N.R. 2001, “Eta Carinae and Other Mysterious Stars: The Hidden Opportunities of Emission Spectroscopy”, ASP Conference Proceedings, Vol. 242., eds T.R. Gull, S. Johannson, and K. Davidson, San Francisco, p.217
- Walborn et al. (2003) Walborn N.R., Howarth I.D., Herrero A., & Lennon D.J. 2003, ApJ 588, 1025
- Walborn et al. (2004) Walborn N.R., Howarth I.D., Rauw G., et al. 2004, ApJ 617, L61
- Waldron et al. (2001) Waldron W.L., & Cassinelli J.P. 2001, ApJ, 548, L45