Cosmic stellar relics in the Galactic halo
Abstract
We study the stellar population history and chemical evolution of the Milky Way in a hierarchical CDM model for structure formation. Using a Monte Carlo method based on the semi-analytical extended Press & Schechter formalism, we develop a new code GAMETE (GAlaxy MErger Tree & Evolution) to reconstruct the merger tree of the Galaxy and follow the evolution of gas and stars along the hierarchical tree. Our approach allows us to compare the observational properties of the Milky Way with model results, exploring different properties of primordial stars, such as their Initial Mass Function (IMF) and the critical metallicity for low-mass star formation, . In particular, by matching our predictions to the metallicity distribution function of metal-poor stars in the Galactic halo we find that: (i) a strong supernova feedback is required to reproduce the observed properties of the Milky Way; (ii) stars with [Fe/H] form in halos accreting Galactic Medium (GM) enriched by earlier supernova explosions; (iii) the fiducial model (, ) provides an overall good fit to the MDF, but cannot account for the two HMP stars with [Fe/H]; the latter can be accommodated if but such model overpopulates the “metallicity desert”, i.e. the range [Fe/H] in which no stars have been detected; (iv) the current non-detection of metal-free stars robustly constrains either or the masses of the first stars ; (v) the statistical impact of truly second generation stars, i.e. stars forming out of gas polluted only by metal-free stars, is negligible in current samples; (vi) independently of , of metals in the Galactic Medium are ejected through winds by halos with masses , thus showing that low-mass halos are the dominant population contributing to cosmic metal enrichment. We discuss the limitations of our study and comparison with previous work.
keywords:
stars: formation, population III, supernovae: general - cosmology: theory - galaxies: evolution, stellar content -1 Introduction
The first stars represent the first source of light, metals and dust after the Big Bang. Since they form out of gas of primordial composition, they are expected to be metal free. For this reason, they have been historically called population III stars (Pop III) to make a distinction from the observed population II/I stars, which have typical metallicities and , respectively (Bromm & Larson 2004). The impact of first stars on the subsequent structure formation history is very strong through different feedback mechanisms: UV photons from the first stars are likely responsible for the reionization and heating of the intergalactic medium (IGM); heavy elements are synthesized inside such stars and during the early supernova (SN) explosions dust grains are formed. Dust and metals are released in the interstellar medium (ISM) and eventually enrich the IGM through SN winds. The efficiency of all these processes depends on the properties of the first stars, which therefore control the evolution of the ISM, IGM and of the cosmic environment in which galaxies form.
There are still many puzzling questions about the first stars, related to the lack of observational evidences of such pristine objects. At present, the primordial Initial Mass Function (IMF) represents one of the most discussed topics in this field. Theoretical studies support the idea of a top-heavy IMF, biased towards massive and very massive stars (Omukai & Nishi 1998; Abel, Bryan & Norman 2002; Bromm, Coppi & Larson 2002; Ripamonti et al. 2002; Nakamura & Umemura 2002; Schneider et al. 2002; Omukai & Palla 2003; Bromm & Loeb 2004; O’Shea & Norman 2006; Yoshida et al. 2006). Indeed, in the absence of metals, the collapsing star forming gas is predicted to fragment in clumps, progenitors of the stars which will later form in their interiors accreting gas on the central proto-stellar core. Because of the poor understanding of the complex physics which controls the late phases of accretion and protostellar feedback, the final stellar masses are still largely uncertain but likely to be in the range (Tan & McKee 2004).
In contrast with the above speculations, present-day star formation (Pop II/I stars) is known to be characterized by a Salpeter IMF in the mass range , flattening below masses of (Larson 1998). Since the characteristic mass of local Pop II/I stars is , if our current understanding of primordial star formation is correct, there must have been a transition in the properties of star-forming regions through cosmic times. Recent theoretical studies suggest that the initial metallicity of the star-forming gas represents the key element controlling this transition (Bromm et al. 2001; Omukai et al. 2001, 2005; Schneider et al. 2002, 2003, 2006; Bromm & Loeb 2004). Following the evolution of protostellar gas clouds with different values of the initial metallicity and including dust and molecules as cooling agents, Schneider et al. (2002-2006) and Omukai et al. (2005) find that when the metallicity is in the critical range there occurs a transition in fragmentation scales from to solar or subsolar fragments and argue that this is an indication for a transition in characteristic stellar masses. The critical metallicity value depends on the fraction of metals locked in dust grains, which provide an additional cooling channel at high densities enabling fragmentation to solar and subsolar clumps (Schneider et al. 2003, 2006; Omukai et al. 2005; Tsuribe & Omukai 2006). Thus, according to this scenario the onset of low-mass star formation in the Universe is triggered by the presence of metals and dust in the parent clouds to levels exceeding .
In this scenario, stellar archeology of the most metal-poor stars represents a promising way to explore primordial star formation. Due to their low metallicities, metal-poor stars are expected to form out of gas enriched by members of the first stellar generation. Therefore, despite of the fact that metal-poor stars are observed in the Galactic halo or in nearby dwarf galaxies, satellites of the Milky Way (MW), these objects might well be living fossils of the first star formation episodes in the Universe. One of the most important observational constraints is provided by the distribution of stellar metallicities in the halo of the Galaxy, the so-called Metallicity Distribution Function (MDF). In their early studies, Ryan & Norris (1991) and Carney et al. (1996) show that this function peaks at [Fe/H]111Hereafter we use the notation [Fe/H] normalized to the solar values of Anders & Grevesse (1989). with a tail extending down to [Fe/H] . Although the compilation of Ryan & Norris (1991) is relatively old and consists only of 300 stars, their MDF is consistent with that obtained by more recent and larger samples collected by the HK survey of Beers et al. (1992) and by the Hamburg/ESO objective prism survey (HES, Wisotzki et al. 2000; Christlieb 2003) whose analysis is still underway to quantify completeness and selection effects (see Beers & Christlieb 2005 for a thorough review). The joint HK and HES sample includes stars with [Fe/H]. It will be further extended by the large number of metal-poor stars contained in the most recent public data release of the Sloan Digital Sky Survey (York et al. 2000), and its planned extension which includes the program SEGUE, specifically targeted to collect metal-poor stars with [Fe/H] and to constrain the transition from the disk population to the halo.
The HES has recently revealed the existence of two stars with [Fe/H]222A recent analysis based on the detection of Fe II lines leads to a downward revision of the iron abundance of HE0107-5240 to [Fe/H] = (Christlieb, Bessell & Eriksson 2006). (HE0107-5240, Christlieb et al. 2002) and [Fe/H] (HE1327-2326, Frebel et al. 2005). Both of these stars show a large overabundance of carbon and nitrogen with respect to iron and other heavy elements, suggesting a similar origin for their abundance pattern. Essentially two classes of models have been proposed to interpret the observed abundances: (i) the stars were born in a primordial environment and had their surfaces polluted at a later time (Shigeyama, Tsujimoto & Yoshii 2003; Suda et al. 2004); (ii) they had been pre-enriched by the yields of one or more SNe (Christlieb et al. 2002, 2004; Umeda & Nomoto 2003; Bonifacio, Limongi & Chieffi 2003; Schneider et al. 2003; Iwamoto et al. 2005). In the first case, these two stars would be low-mass Pop III stars, in conflict with the proposed critical metallicity scenario. In the second case, instead, these stars would be second generation stars enriched by the ashes of the first SNe. At present, the available evidence does not allow to exclude any of the above proposed scenarios but shows that the observational data on metal poor stars are starting to challenge theoretical models.
This challenge is even more serious as it resonates with additional constraints on the primordial IMF placed by completely independent observations. In particular, the recent downward revision of Thomson scattering optical depth found in the analysis of the Wilkinson Microwave Anisotropy Probe (WMAP) three years data (Page et al. 2006) predicts a later reionization epoch, in agreement with a universal Salpeter IMF (Choudhury & Ferrara 2006; Gnedin & Fan 2006). The same conclusion is drawn when theoretical models (Salvaterra et al. 2006) are confronted with the observed anisotropies in the near-infrared background (Kashlinsky et al. 2005). These results tend to favor a relatively unevolving Salpeter IMF up to the highest redshifts.
The motivation of the present study was to explore to what extent the
shape of the low-metallicity tail of the halo MDF can provide insights
on the nature of the first stars. In particular, we aim at addressing
the following questions:
What are the implications of the observed low-metallicity tail of
the halo MDF?
Does a sharp MDF cutoff put constraints on the primordial IMF?
What is the relation between the MDF cutoff and the critical metallicity ?
What is the origin of the “metallicity desert”, i.e. the absence of stars in
the range [Fe/H] ?
What is the statistical impact in the observed samples of truly
second generation stars, i.e. stars enriched only by the ashes of the
first stellar explosion, which then can be used to constrain the nucleosynthetic
products and the masses of primordial stars?
Several authors have attempted to interpret the implications of the observed halo MDF by applying different methods. Using a semi-analytical model, Hernandez & Ferrara (2001) deduced that a characteristic Pop III mass increasing towards high redshift is required in order to fit the low- tail of the MDF. Prantzos (2003) also pointed out that the stellar metallicity distribution depends sensitively on whether instantaneous recycling is adopted or relaxed. The possible existence of a low- cutoff in the MDF has been interpreted by Oey (2003) in the framework of stochastic chemical enrichment models, as a result of the various metal diffusion/transport/mixing processes at work in the Galactic environment. Along similar lines, Karlsson (2006) has noticed that the metallicity desert, if confirmed, could be used to extract information about the past Galactic star formation history. Finally, Tumlinson (2006) presented a chemical evolution model for the MW which follows the star formation history in a hierarchical galaxy formation scenario. Such model accurately reproduces the halo MDF by Ryan & Norris (1991).
The method proposed in this paper is similar in spirit to that of Tumlinson; however, it introduces a number of novel features, particularly for what concerns the treatment of mechanical feedback and model calibration. Moreover, we compare our model results with a new MDF determination obtained from joint HK and HES data (including stars with [Fe/H]) by Beers & Christlieb (2006). A detailed comparison between the two studies is given in Sec. 6. Using the newly developed code GAMETE (GAlaxy MErger Tree & Evolution) we follow the gradual build-up of the stellar population and metal enrichment of the MW along its past hierarchical evolution. The code is based on a Monte Carlo algorithm, along the lines of Cole et al. (2000) and Volonteri, Haardt & Madau (2003), standing on the Extended Press Schecther (EPS) theory (Bond et al. 1991; Lacey & Cole, 1993). We reconstruct the hierarchical evolution of the MW from redshift and follow, jointly, the chemical enrichment and history of its stellar population. The chemical evolution of both proto-Galactic halos and of the gas reservoir into which they are embedded, which we call thereafter the Galactic Medium (GM), is computed by including a physically based description of the mechanical feedback produced by the energy deposition of massive stars. In addition, this allows us to evaluate the typical masses of halos which mostly contribute to the GM enrichment and to understand how the ejection and accretion of enriched gas along the hierarchical tree is reflected in the resulting stellar MDF. To calibrate the two free parameters of the model (star formation and wind efficiency) we compare the inferred Galaxy average properties with their observed values. The model can then be used to predict the shape of the halo MDF for different assumed properties of the first stars, i.e. the primordial IMF and critical metallicity.
The paper is organized as follows: in Sec. 2, we describe the algorithm developed to construct the cosmological333We adopt a CDM cosmological model with , , , , and , consistent with the 3-yr WMAP data (Spergel et al. 2006). We adopt the fit to the power spectrum proposed by Bardeen et al. (1986) and modified by Sugiyama (1995). merger tree of the Galaxy and we show that it successfully reproduces the predictions of the EPS theory. In Sec. 3, we discuss the implementation of star formation and mechanical feedback; Sec. 4 discusses the model calibration. In Sec. 5 we present the results of the model, which are then compared with the most recent data in Sec. 6. A brief summary and discussion, given in Sec. 7, conclude the paper.
2 Building the merger tree
The most popular model for galaxy formation (CDM) predicts that galaxies form through a series of merging processes of lower mass fragments, in a hierarchical tree picture. We have used a semi-analytical approach based on the Extended Press & Schechter (EPS) theory (Bond et al. 1991; Lacey & Cole 1993) to reconstruct the hierarchical merger history of our Galaxy. Halo mass distributions drawn from Press & Schechter formalism (1974) show an excellent agreement with those derived from N-body simulations; its main drawback consists in the lack of spatial information. There are several alternative methods to construct merger tree algorithms from EPS (see Somerville & Kolatt 1999 for a critical review); following Cole et al. (2000) and Volonteri et al. (2003) (herafter VHM), we have developed a binary Monte Carlo code with mass accretion.
The main building block of the algorithm follows from equation (2.15) of Lacey & Cole (1993) re-written in terms of the progenitor mass :
| (1) |
This equation gives the fraction of mass in a halo of mass at redshift which, at an earlier time , belongs to less massive progenitors having mass in the range to (see also Cole et al. 2000). The quantity () is the critical linear overdensity threshold for collapse at redshift (); () is the linear r.m.s. density fluctuation smoothed with a top-hat filter of mass (). By construction, the integral of eq. (1) from to must give unity, i.e. all halos were in less massive fragments at earlier epochs. Multiplying by , the mass fraction can be translated into the number of halos per unit mass,
| (2) |
Hereafter we drop the argument to simplify the notation. Taking the limit of eq. (2), one can obtain an expression for the average number of progenitors in the mass range , into which a halo of mass fragments considering a step back in time (Cole et al. 2000):
| (3) |
where and . This equation represents the core of our algorithm. We use it to build a binary merger tree that starts from the present day Galactic dark matter halo and decomposes it into its progenitors, running backward in time up to redshift . Given the shape of the matter power spectrum in CDM models, the number of halos diverges as the mass goes to zero. For this reason, a cutoff (resolution) mass , which marks the transition between progenitors and mass accretion, is required. At any given time-step, halos can either (i) lose part of their mass, corresponding to the cumulative fragmentation into halos with , or (ii) fragment into two progenitor halos and lose mass. At each redshift, the mass below the resolution limit accounts for the GM in which the halos are embedded. Note that we refer to mass accretion as the process of mass loss in the (backward stepping) merger algorithm.
Once is fixed, one can compute the mean number of progenitors in the mass range that a halo of mass at is fragmented into during a time-step
| (4) |
and the accreted mass fraction
| (5) |
Both these quantities depend on (see eq. 3), suitably chosen to prevent multiple fragmentations (). Since the number of progenitors decreases with , binary algorithms generally require a high temporal (redshift) resolution.
At each time step and for each progenitor mass , we generate a random number and we compare it with the value derived by eq. (4). If , the halo does not fragment at this step. However a new halo with mass is produced, to account for the accreted matter. If instead , fragmentation occurs: a new random value in the range is drawn from the distribution eq. (3) to produce a progenitor of mass ; mass conservation sets the mass of the second progenitor to . This procedure, iterated on each progenitor halo and at each redshift, provides the whole hierarchical tree of any initially selected galaxy, from the present-day up to an initial redshift.
To give a complete picture of the merger tree algorithm we need to describe the quantities involved in the equations and specify the adopted free parameters. In particular, in eq. (3) the expressions and represent the values of the critical density extrapolated to . Specifically, where is the linear growth factor (Carrol, Press & Turner 1992),
| (6) |
where . For the adopted cosmological parameters the above equation represents a good approximation of the linear theory growth factor. On the other hand the linear rms density fluctuation in eq. (3), smoothed with a top-hat filter, is given by
| (7) |
where the integral is performed in the Fourier-space, is the cold dark matter power spectrum and
is the top-hat window function.
We now need to specify the free parameters of the model, and . A high value of would be required to preserve the binarity of the code (eq. 4) and to control the computational cost implied by a very high time resolution. However, we need to be small enough to resolve the low mass halos presumably hosting the first stars. In addition, must be redshift dependent, decreasing with increasing redshift, to reproduce the EPS predictions (VHM). Indeed, hierarchical models predict less massive halos at higher redshifts. The halo mass which, at a given redshift corresponds to a virial equilibrium temperature can be approximated as,
| (8) |
(for an exact expression see Barkana & Loeb 2001). Given the above redshift dependence, taking appears physically motivated. For reasons that will be extensively motivated in the next Section, our analysis focuses on halos with mass K. Thus, we have chosen a resolution mass which enables to follow the history of all MW progenitors having up to .
The time-step is empirically selected in order to obtain a good agreement between the EPS predictions and numerical results. We started by considering time-steps logarithmically spaced in expansion factor between and . However, since the number of halos in the high mass range was found to exceed the EPS predictions, we have reduced the time-step by a factor within the redshift interval .
Finally, we need to specify the assumed MW dark matter halo mass. Following Binney & Merrifield (1998), we have assumed . This values likely represents a lower limit to total halo mass, being estimated through observations of the most distant galactic satellites currently detected.
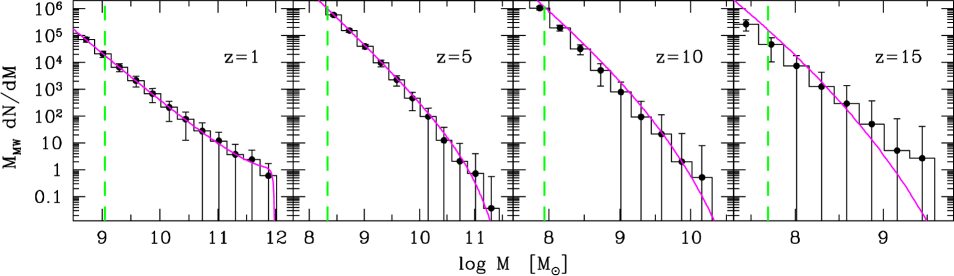
Comparison between the code results and EPS predictions is shown in Fig. 1, where the mean number of Milky Way halo progenitors is plotted at different redshifts as a function of mass resulting from the average of different Monte Carlo realizations of the merger tree. At each redshift, the agreement with EPS is satisfactory down to the lowest halo masses , i.e. for all the objects of interest to our study. Note that, as expected for CDM models, the typical population mass decreases with increasing redshift and few collapsed halos exist at , most of the mass being below the resolution mass and therefore diffused in the GM.
3 Star formation and feedback
In hierarchical models for galaxy formation the first star-forming halos are predicted to collapse at redshift , having masses and virial temperatures K. The neutral gas in these minihalos cannot cool via atomic hydrogen and relies on the presence of molecular hydrogen, H2, to cool and collapse, ultimately forming stars. The role of minihalos in cosmic evolution has been the subject of a number of studies, suggesting that their star formation activity is easily suppressed by radiative and mechanical feedback (see Ciardi & Ferrara 2005 for a thorough review). Empirical evidence for this suppression has been recently provided by the 3-yr WMAP data. The downward revision of the measured optical depth to electron scattering of (Page et al. 2006) is consistent with models in which ionizing sources populate halos down to a virial temperature of K, requiring strong suppression of star formation in earlier minihalos (Haiman & Bryan 2006).
Consistent with these findings, we have tracked the star formation history and chemical enrichment of the Galaxy down to progenitor halos with masses and we have assumed that at the initial redshift of the gas in these halos is still of primordial composition. This is the result of the effect that any given source photodissociates molecular hydrogen on scales much larger than those affected by its metal enrichment (Scannapieco et al. 2006). In any star-forming halo and at each time-step, stars are assumed to form in a single burst; the total mass of stars formed is proportional to the available gas mass with a redshift-dependent global efficiency , . The initial gas content of dark matter halos is equal to the universal ratio, which decreases after each star formation event (see eq. 17).
3.1 Star formation efficiency
Star formation in gas clouds occurs in a free-fall time where is the gravitational constant and the total (dark+baryonic) mass density inside the halo (assumed to be 200 times denser than the background). Since, at each redshift, the Monte Carlo time step (corresponding to ) is , it is possible to accurately sample time variations of the global star formation efficiency using the following approximation:
| (9) |
where , physically corresponding to the “local” star formation efficiency, represents a free parameter of the model.
3.2 Pop III and Pop II/I IMFs
We have assumed that the stellar IMF depends on the initial metallicity of star forming clouds, in agreement with the critical metallicity scenario. A star forming halo with an initial metallicity will be referred to as a Pop III halo444We define Pop III as all the stars with . In addition, Pop III stars are assumed to be massive if , and distributed according to a Larson IMF if (see Sec. 6.1), and it will host Pop III stars with masses within the range of pair instability SNe (SNγγ, ). Indeed, these violent explosions are predicted to provide the dominant contribution to metal enrichment at the lowest metallicities, releasing roughly half of their progenitor mass in heavy elements and leaving no remnants. This means that all the initial progenitor mass is returned to the surrounding medium and that gas pollution by these objects is very strong with respect to the contribution of all stars with enriching the ambient medium through mass loss or Type II SN (SNII) explosions. We have assumed a reference value of for the mass of Pop III stars, but we have also explored the implications of adopting the two extreme values of and in the Appendix.
Conversely, if the initial metallicity exceeds the critical value, , the host halo is referred to as a Pop II/I halo and the stars are assumed to form according to a Larson IMF:
| (10) |
with , and in the range (Larson 1998). This expression represents a modification of the Salpeter law which reproduces the observed present-day stellar population for ; in the low-mass limit, in fact, the IMF behavior is still very uncertain because of the unknown mass-luminosity relation for the faintest stars. The Larson IMF matches the Salpeter law for while the cutoff at can explain the absence of brown dwarfs in the observed stellar population.
3.3 Instantaneous Recycling Approximation
Very massive Pop III stars are characterized by a fast evolution, reaching the end of their main sequence phase in Myr. Conversely, the broad mass range which characterizes Pop II/I stars implies a wide range of stellar lifetimes, , which vary from a few Myr to several Gyr. In our model, we have assumed the Instantaneous Recycling Approximation (IRA, Tinsley 1980), according to which stars are divided in two classes: those which live forever, if their lifetime is longer than the time since their formation ; and those which die instantaneously, eventually leaving a remnant, if . The transition mass between the two possible evolutions, or turn-off mass , has been computed at any considered redshift. All stars having mass represent stellar fossils which can be observed today. The turn-off mass is an increasing function of time since when ; in this limit of course i.e. all the stars are still alive. Using the IRA approximation at each time-step, we can compute the number of stellar relics per unit stellar mass formed:
| (11) |
and the equivalent mass fraction in these stars
| (12) |
By definition, there are no stellar fossils of Pop III stars in the SNγγ progenitor mass range.
3.4 Nucleosynthetic products
Massive stars can lose mass and heavy elements through stellar winds and supernova explosions. Using the IRA approximation, we can compute the yield, i.e. the mass fraction of metals produced per unit stellar mass formed,
| (13) |
as well as the returned fraction, or the stellar mass fraction returned to the gas through winds and SN explosions:
| (14) |
The quantity represents the mass of metals produced by a star with initial mass and metallicity , and is the mass of the stellar remnant. Non-rotating Pop III stars in the SNγγ domain return all their gas and metals to the surrounding medium, i.e. . We have used for these stars the results of Heger & Woosley (2002). It is interesting to note that although the total metal yield is independent of the progenitor mass and equal to , the iron yield strongly depends on mass, being for . As for Pop II/I stars we have used the grid of models by van den Hoek & Groenewegen (1997) for intermediate () mass stars and Woosley & Weaver (1995) for SNII (), linearly interpolating among grids of different initial metallicity when necessary. We have also followed the evolution of individual elements relevant to the present study, Fe and O.
3.5 Mechanical Feedback
SN explosions may power a wind which, if sufficiently energetic, may overcome the gravitational pull of the host halo leading to expulsion of gas and metals into the surrounding GM. This mechanical feedback has important implications for the chemical evolution along the merger tree, as the nucleosynthetic products of the first stars can be efficiently ejected out of the shallower potential wells of the first star forming halos and then be accreted by neighboring halos, thus being incorporated into the next stellar populations.
To model mechanical feedback, we compare the kinetic energy injected by SN-driven winds
| (15) |
and the binding energy of the host halo with mass ,
where (Barkana & Loeb 1991). In the first equation, is wind mechanical efficiency (i.e. the fraction of explosion energy converted into kinetic form); it represents the second free parameter (the first is , see eq. 9) of the model. is the number of SNe in the burst and is the average explosion energy, which we take to be equal to erg for SNγγ and to erg for SNII. We assume that ejection takes place when , and the gas is retained otherwise. We compute the ejected fraction of gas and metals as
| (16) |
Hence, the ejection fraction is directly proportional to the SN energy provided it is larger than the binding energy. Note that, according to this simple prescription, gas and metals are ejected with same efficiency. This might not necessarily be the case, as shown by several authors (Mac Low & Ferrara 1999; Fujita et al. 2004); we neglect this complication in this work.
Due to mechanical feedback, the mass of gas and metals in a halo can decrease substantially. Following a star formation burst and mechanical feedback, the mass of gas left in the halo, , which represents the reservoir for subsequent star formation events, is related to the initial gas mass, , and the stellar mass, , by
| (17) |
Similarly, the final mass of metals can be written as,
| (18) |
3.6 Metal mixing
We have reconstructed the star formation and chemical enrichment history of our Galaxy applying iteratively eqs. (17)- (18), together with eqs. (11)-(16), along the hierarchical merger tree. It is assumed that during a merger event the metal and gas content of two distinct progenitor halos are perfectly mixed in the ISM of the new recipient halo. Similarly, metals and gas ejected into the GM are assumed to be instantaneously and homogeneously mixed (we refer to this approximation as ”perfect mixing”) with the gas residing in that component. The filling factor of the metal bubbles inside the volume corresponding to the size of the MW halo today, gives an estimate of the validity of the latter assumption. The perfect mixing approximation is verified when
| (19) |
where is the bubble radius and
| (20) |
is the average mean halo separation within the proper MW volume , having assumed Mpc; is the total number of halos at redshift , averaged over 200 realizations of the merger tree. The value of can be estimated from a Sedov-Taylor blastwave solution:
where is the energy released by SN explosions within each halo, is the mean GM density and is the Hubble time. If we assume that i) star forming halos have and ii) where is the Pop II explosion energy per unit stellar mass formed, we find that when . Such limit implies that regions with are no longer present beyond that epoch. Additional discussion on this issue is given in Sec. 5.2 and Sec. 7.
4 Model calibration
| model | ||||||
| no feedback: , | ||||||
| feedback: , | ||||||
| observed values | 1 | 1 | 0.25 | 0.1 | 1 | 0.066 |
Although we have kept our model as simple as possible, it includes a number of relatively poorly known (albeit important) physical processes that need to be empirically calibrated. To this aim we have used the observed properties of the Milky Way as a benchmark to fix the best values of the two model free parameters, and . In particular, we have compared the results of the simulations at redshift with the following observations:
-
•
Gas metallicity. The Galactic disk has a mean metallicity . As this component contains the majority of the MW gas, we use this value as representative of the whole system.
-
•
Stellar metallicity. The typical mean value quoted for this quantity is . This value has been derived by weighting the mean metallicity of each galactic stellar component with its corresponding mass.
-
•
Stellar mass. Contributions to the stellar mass come from the disk (), the bulge () and the halo () components (Dehennen & Binney, 1998; Brown et al. 2005), summing up in a total mass of .
-
•
Gas-to-stellar mass ratio, . The mass of gas has been derived using the observed mass of HI and HII regions of the Galaxy, (Stahler & Palla 2004).
Moreover, if mechanical feedback is considered, two additional quantities become meaningful:
-
•
Baryon to dark matter ratio, .
-
•
GM metallicity. Although the exact value for this quantity is somewhat uncertain, high-velocity clouds (supposedly constituted by leftover gas from the Galactic collapse, and currently accreting onto the disk) may be used as a reasonable template. For these objects, Ganguly et al. (2005) derive [O/H], a value that we take as an educated guess for .
Obviously, in study cases in which mechanical feedback is turned off for comparison sakes, it follows that and . In principle, an acceptable fit to the above MW properties can be achieved both for models including mechanical feedback and neglecting it (see next Sections). However, the best values of the free parameters are different in the two cases. We will show later how it is possible to assess the role of feedback by using the MDF properties. Note that the calibration procedure is completely independent of and Pop III IMF.
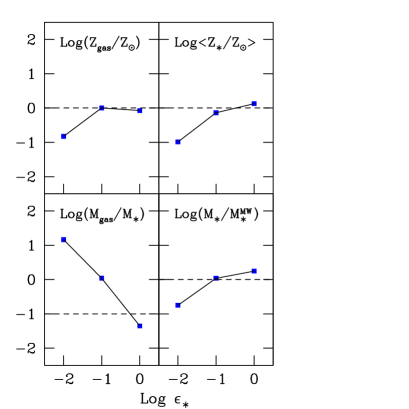
4.1 No Feedback Model
In Fig. 2 we compare the observed global properties of the Galaxy with the results of our model as a function of the star formation efficiency, . We start by analyzing the no-feedback case, i.e. when . A good overall agreement with the four observed quantities is obtained for relatively high values of . In fact, the derived values of , , rapidly increase when the star formation efficiency increases from to , and remain nearly constant thereafter (note that the value of actually decreases with in this range). These trends can be understood very simply. The gas mass decreases due to star formation (eq. 17), forcing the gas fraction to decrease with increasing . Thus, saturates beyond because of the limited gas mass available. Given the proportionality between and (eq. 18), shows the same behavior. Conversely, the mass of metals in the gas is determined by the balance between metals synthesized and ejected by stars, and metals locked into newly formed stars (eq. 18); when the second effect dominates, it produce a slight decrease of . The best-fit model requires a high star formation efficiency, 555 Because of the assumed star formation law (eq. 9), is only the instantaneous star formation efficiency and does not imply that half of the gas mass is converted into star in a single burst. Rather, for this model varies in the range in the considered redshift range.. The derived values for all the observed properties of the MW are listed in Table 1. The values shown represent an average over realizations of the merger tree.
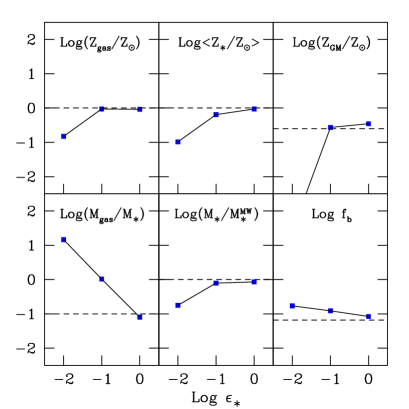
4.2 Feedback Model
In the right panel of Fig. 2, we show the global properties of the MW derived using a feedback model with . For low values of , the effect of mechanical feedback is negligible; similarly to the no feedback model , and . These results are coherent with our feedback prescriptions (eqs. 15 and 16) since the efficiency of mechanical feedback depends on the number of SN explosions and therefore on the level of star formation activity. As expected, decreases with while increases. Note that in the range the feedback model closely resembles the no-feedback one, the major difference being the lower saturation values for the stellar mass and metallicity. Instead, the metallicity of the gas is nearly unaffected because metals and gas are ejected into the GM with the same efficiency (see eqs. 17 and 18). The best-fit model requires (we stress again that this is not the global star formation efficiency, expressed by , see eq. 9), and reproduces the MW global properties better that the no-feedback model (see Table 1).
5 Model results
5.1 Metallicity Distribution Function
After having ensured that our models reproduce the global properties of the MW, regardless of the value of and of the PopIII IMF, we are now ready to explore the predictions of the calibrated models. The result shown below are the result of averages over 200 realizations of the MW merger tree; in some cases we use a single representative realization for illustration purposes.
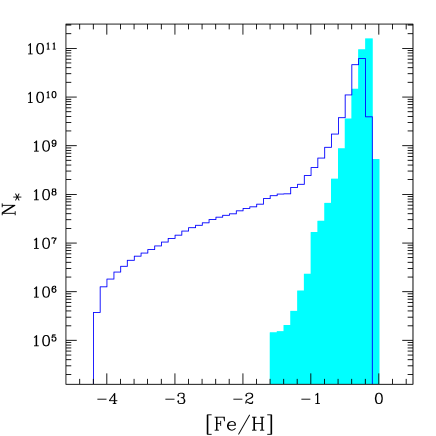
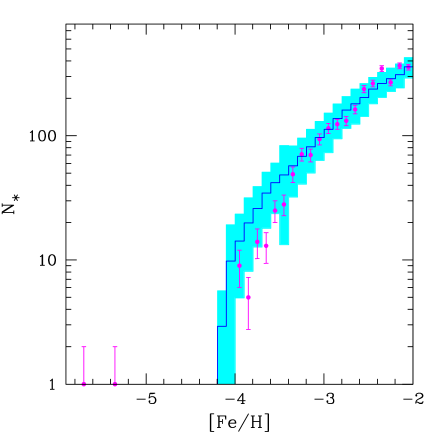
In Fig. 3 we compare the MDF (i.e. the number of MW relic stars as a function of their iron abundance, [Fe/H], a quantity commonly used as a metallicity tracer) derived using the two best-fit models, with and without mechanical feedback (see Table 1), for the specific value and .
The first striking difference is that no stars with [Fe/H] are produced in the no-feedback model. The reason is that the gas metallicity is not efficiently diluted in closed box models. A simple estimate elucidates this point. Following a burst of Pop III stars, the gas metallicity of the host halo is raised up to
| (21) |
where we have used and the smallest value corresponding to (appropriate for the no-feedback case). Note that the final metallicity depends only on the metal yield and on the star formation efficiency. From the previous equation it is easy to see that the resulting abundance is666This relation follows from the definition of [Fe/H] that leads to [Fe/H], where for Pop III stars with the iron yield is approximately .
This value is larger than the low [Fe/H] cutoff in the distribution
shown in Fig. 3. What is the reason for such discrepancy?
In the absence of mechanical feedback, metals can only be diluted through
mass accretion of metal-free gas and through mergers with unpolluted
progenitors (which at most can halve the gas metallicity if they have a
comparable mass). However, dilution purely provided by accretion of unpolluted gas is not
sufficient to account for the low- tail of the MDF, which extends to values
[Fe/H] , with two outliers at [Fe/H] .
The same conclusion is achieved using different mass values for
SNγγ or assuming a Larson IMF for metal free stars though,
in both cases, the different value of the yields cause a shift in the
MDF cutoff. For example for the Larson IMF (
model) and
and the cutoff moves to [Fe/H].
A similar result is obtained for shown in the
Appendix.
In conclusion mechanical feedback is required to effectively dilute metals
inside halos independently of the value and of the assumed
PopIII IMF.
Heavy elements ejected by SN winds mix with the external GM and can be accreted by other halos, raising their metallicity. Contrary to self-enrichment by previous starburst within the same host halo and to hierarchical enrichment by contaminated progenitors, this accretion-driven enrichment mode is present only when mechanical feedback operates. Accretion of metal-enriched GM onto a halo of primordial composition sets the initial conditions for the environment in which most metal-poor stars will later form. Indeed, the unshaded histogram in Fig. 3 shows that when mechanical feedback is active the MDF extends down to [Fe/H] as low-mass stellar relics can be produced only in gas clouds with .
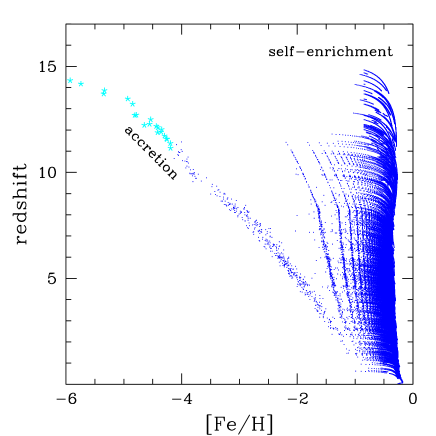
The right panel of Fig. 3 shows how different enrichment modes operate along the merger tree in a single representative realization. Each point denotes the metallicity of a halo at a given redshift; in this plane halos move from left to right i.e. they increase their metallicity. The evolution of each halos is followed along its track until it suffers a merger event. Two families of curves can be identified, corresponding to self-enrichment and accretion mode, respectively, as marked by the labels in the Figure. In general, at the onset of the first burst of star formation a halo could be either metal-free ([Fe/H] ) or it could have a non-zero metallicity if it has accreted gas from the GM previously polluted by metals ejected from other halos777The same conclusion applies to halos that are just about to gravitationally collapse and virialize.. In the first case, the halo will host Pop III stars; if metals produced are retained after their explosion the halo becomes self-enriched and moves directly on the corresponding self-enriched track. In the second case, instead, depending on the relative ratio of the GM metallicity and the stars form could be either Pop III or Pop II. In this particular realization at the GM metallicity crosses the value and sets the termination of the Pop III formation epoch in accretion-enriched halos. Such halos lie on the curve marked as “accretion”. However the second star-formation episode will push again these halos onto the corresponding self-enriched tracks. The accretion-mode is crucial in order to form long-lived stars with [Fe/H]. The accretion-enriched branch ends at , when merger events dominate the evolution of MW progenitors. The last point of the branch corresponds to [Fe/H] , reflecting the metallicity of the GM at the same redshift (see Fig. 4).
The analysis of this Figure helps interpreting the MDF. Our model predicts that stars with [Fe/H] form only in halos enriched through the accretion-mode. Conversely, iron-rich stars, with [Fe/H], form in self-enriched halos. In the intermediate range, [Fe/H], stellar relics originate from both self-enriched and accretion-enriched halos, and their contribution to the MDF cannot be separated. However, at a given [Fe/H], stellar relics along the accretion-enriched branch are systematically younger.
Note that another possibility to increase metal dilution along the merger tree is to relax the hypothesis that all Pop III stars end up as SNγγ (). Indeed if a fraction of Pop III stars forms with or () and ends up as black holes (Heger & Woosley 2002), metal enrichment can be substantially reduced. However, Schneider et al. (2006) have recently studied the dependence of chemical feedback from the parameter (thus from the assumed Pop III IMF), showing that is currently favored by observations of the cosmic star formation history, high redshift number counts and cosmic reionization.
In conclusion mechanical feedback is necessary to reproduce both the global properties of the MW and the observed range of [Fe/H] in halo stars. Hereafter we will refer to the best-fit feedback model of Table 1 as our fiducial model.
5.2 Metallicity evolution of the Galactic Medium
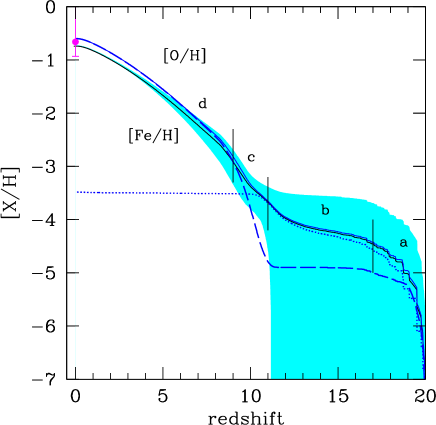
In Fig. 4 we show the evolution of GM iron and oxygen abundances together with the specific contribution to [O/H] by Pop III and Pop II stars. For reference we also plot the observed [O/H] value measured in high-velocity clouds (Ganguly et al. 2005) which are taken as an indicator of leftover GM in the MW halo. These results refer to our fiducial model with and . The predicted [O/H] at is in perfect agreement with the data. The scatter of the [Fe/H] distribution increases with and becomes very large at as a result of the large fluctuations in the merging history (see Fig. 1) and enrichment of halos among different realizations at . This result is consistent with the fact that at (see Sec. 3.6) and therefore no unpolluted regions are expected below that redshift. The scattering induced by the stochastic nature of the merger tree process is similar, although different in nature, with respect to the abundance fluctuations produced by inhomogeneous mixing, a process not describe by our perfect mixing approximation. This similarity can be appreciated by comparing our results with those found by Mori & Umemura (2006) using a hybrid N-body/hydrodynamic code. These authors conclude that the metallicity is highly inhomogeneous during the early phases of galaxy formation ( Gyr for a galaxy) and becomes more uniform at lower redshifts.
We can see that Pop III stars dominate the GM enrichment for while Pop II stars are the dominant enrichment channel for . The GM enrichment history is the result of 4 phases in which different physical mechanism dominate; these phases are marked in Figure 4. The first one (phase a), in the redshift range , is characterized by a very rapid increase of the elemental abundances. Given the small binding energy of the high-redshift, low-mass halos, both SNγγ and the less energetic SNII explosions can overcome the gravitational pull of parent halos, contributing to the GM enrichment. As the typical halo mass scale grows, as a result of hierarchical formation process, metals produced by SNII are retained inside galaxies and only SNγγ regulate the GM enrichment (phase b). However the abundance grow is limited by the fact that an increasing fraction of the GM is polluted above the , hence quenching the formation of Pop III stars which eventually comes to an end at the beginning of phase (c) when the whole GM is enriched to . Thanks to the higher star formation efficiency of larger halos, Pop II stars, during this phase, can eject their heavy elements. Their ability to do so, though, decreases with time because of the counteracting effect of the gravitational potential of larger galaxies that are forming below (phase d). Note that the GM bears the nucleosynthetic signatures of (predominantly) Pop III stars at ; their abundance pattern becomes more and more elusive at later times when Pop II stars start to dominate the enrichment. This physical picture remains qualitatively unaffected by changing the value of although the relative duration and amplitude of the different enrichment phases may vary. This enrichment history is particular important to interpret the observed MDF features as we will discuss in Sec. 6 as the various phases can be traced by the number of stars that are formed during each of them.
5.3 Mass ejection from progenitor halos
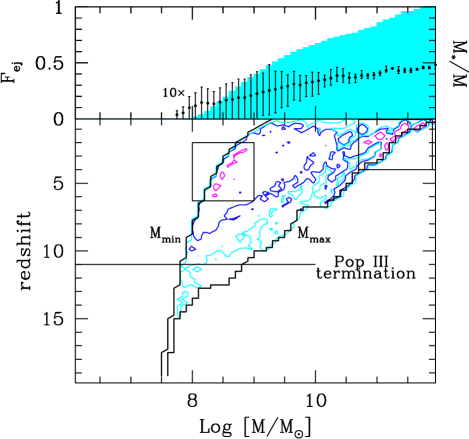
In Fig. 5 we show, for a single representative realization, the ratio of metals (or, equivalently, gas888These quantities are equivalent because of the assumption that the wind has the same metallicity as the ISM of the parent galaxy (see Sec. 3.5).) ejected by halos, , as a function of their mass and redshift with respect to the total amount of metals predicted in the GM at , . In the Figure, the curve () denotes the minimum (maximum) halo mass in which star formation can develop, i.e. . Coherently with CDM models, at high redshifts () halos have typical masses close to . As the redshift decreases, more massive halos are produced (predominantly) via merging events which represent the dominant formation channel for , making . As a general rule, the GM metal enrichment is dominated for by low-mass galaxies; it is only at later epochs that the contribution of larger galaxies becomes important. In fact the distribution seen in Fig. 5 is bimodal: the first, more extended peak is found for corresponding to halos in the mass range ; the second peak corresponds to larger galaxies at . The bi-modality can be understood as the result of the larger of low-mass halos (due to their lower gravitational potential) and the larger gas content of more massive ones. The first effect dominates at high redshift; below the ejected mass from larger halos becomes substantial despite their relatively low values of . Halos in the intermediate mass range are born from a relatively small number of merging events of gas-poor progenitors and therefore little gas is left for further ejection. The largest halos instead are characterized by higher baryonic fractions as they incorporate a larger number of progenitors with different histories. For example, halos with mass at have contributed alone to of the metals present in the GM today. An equivalent contribution is provided by the most massive MW progenitors in the second peak. In the first peak a large plateau is presents around the maximum indicating that low-mass galaxies play a fundamental role for the enrichment of the GM.
This is even more evident from an inspection of the top panel of the same Figure where we show the cumulative contribution to integrated over redshift (). The curve grows rapidly for and , with a flatter behavior in between, reflecting the afore-mentioned bimodal distribution. About of the ejected mass at comes from halos with , compared to contribution from the most massive galaxies. We conclude that GM enrichment is dominated by low-mass halos . This result is insensitive to the value of , although the relative contribution of Pop III and Pop II stars may vary.
As in our code we also store the information about the stellar mass corresponding to each DM halo we can rephrase the previous results in term of such quantity (points in the top panel of Fig. 5). Proto-galaxies that mostly contribute to GM pollution have a typical stellar-to-total mass ratio , or .
Note however that the scatter of the ratio can be relatively large as shown by the error bars in the plot: the dispersion is caused by the different star formation histories. The scatter is maximum around ; this population is the most numerous one through most of the MW history and they may be produced by widely different combinations of formation processes and virialization epochs.
From Fig. 4 we have concluded that Pop III dominate the enrichment down to ; from Fig. 5 we can also set an upper limit to the fraction of today’s GM metals provided by Pop III stars. At the largest halo from which metals can escape is , corresponding to i.e. Pop III stars contribute negligibly to the heavy elements currently detectable in the Galactic environment.
6 Data comparison
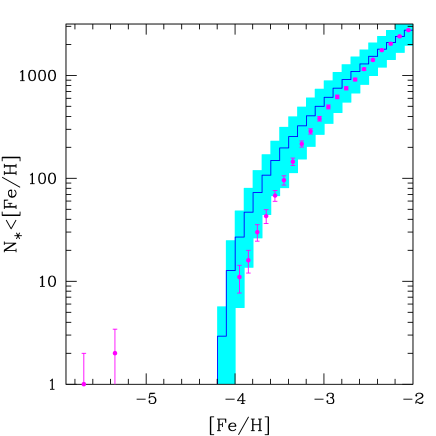
We are now ready to compare the results of our model with the best currently available data on halo metal-poor stars in terms of their MDF. Such distribution gives the number of MW relic stars as a function of their iron abundance, [Fe/H], a quantity commonly used as a metallicity tracer. In Fig. 6 we compare the joint HK/HES MDF by Beers & Christlieb (2006) with the simulated MDF (plotted both in differential and cumulative form) obtained using our fiducial model with and . For completeness, we have added to the above sample the two known hyper-metal poor stars (Christlieb et al. 2002; Frebel et al. 2005) using the new determination by Christlieb, Bessell & Eriksson (2006) for the iron-abundance of the star HE0107-5240. Due to contamination by disk stars, we have cut the data sample for [Fe/H]. To compare with data, we have normalized the simulated MDF to the total number of observed stars with [Fe/H]. Note that comparing these quantities we are implicitly making the assumption that all simulated metal-poor stars reside in the halo: this hypothesis is supported by the most recent N-body simulations (Scannapieco et al. 2006).
The model reproduces the observed MDF quite well, particularly for [Fe/H]. A marginally significant deviation from the data (always within 1-) is seen at lower [Fe/H] i.e. a range populated by stars the formed in accretion-enriched halos. The two hyper-metal poor stars are not reproduced by our model. By definition in fact, the formation of Pop II stars is allowed only if the gas in the star-forming region has a metallicity adopted in this case.
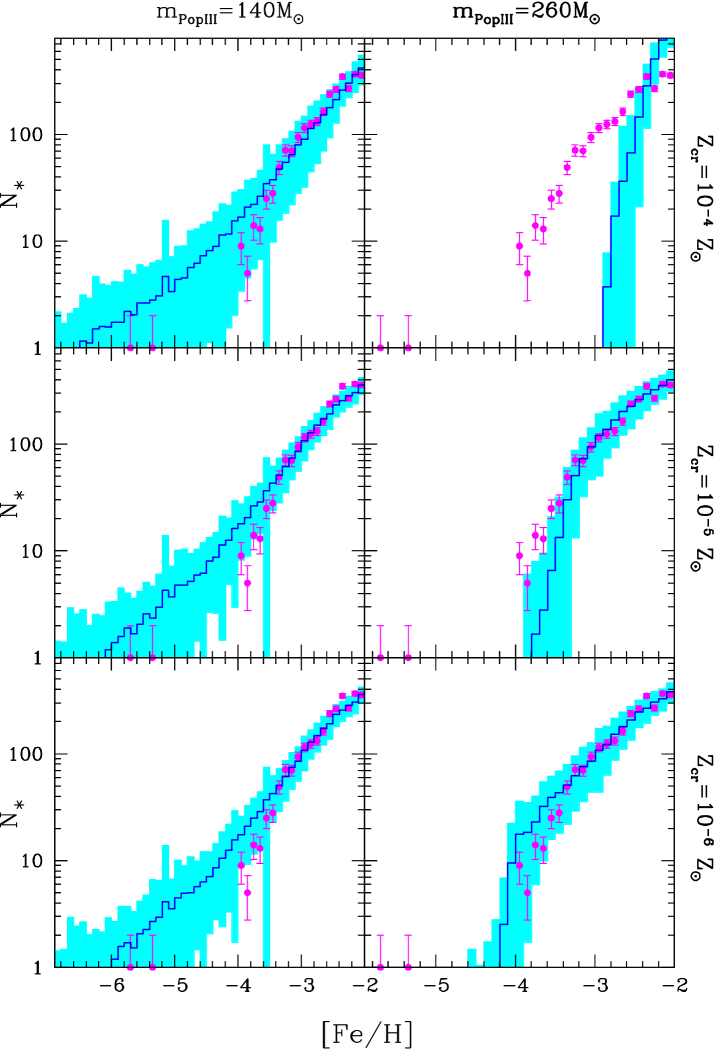
6.1 Changing the critical metallicity
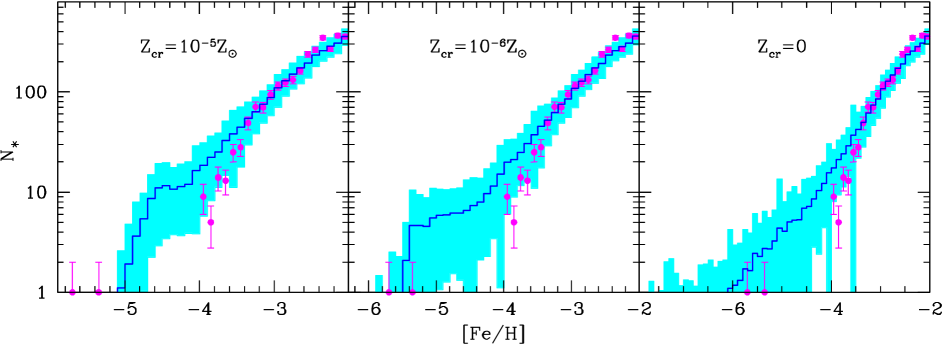
In order to bracket the current uncertainty on the determination of , we have explored the sensitivity of our results to values of different from the reference (Fig. 7). Independently of the adopted value, the observed global properties of the MW are reproduced with the same accuracy as in the case . We stress again that the choice is equivalent to state that stars (including metal-free ones) form at all times according to a Larson IMF (see Section 3).
The first striking result is that the MDF cutoff is shifted at gradually lower values of [Fe/H] when decreases (for reasons discussed in Sec. 5.1); the high-[Fe/H] limit of the distribution appears unchanged, showing, in all cases, a very good agreement with the data for [Fe/H]. However, the tendency of the data to drop faster than than the model at lower [Fe/H], already noticed for , persists. In particular, when the MDF shows a steep increase in [Fe/H] followed by a flat plateau extending up to [Fe/H], a markedly different shape with respect to the previously analyzed case . This evolution bears the imprint of the GM chemical evolution and to understand it in detail it is useful to recall the four enrichment phases identified in Fig. 4. During phases in which the GM metallicity grows slowly (as in phase b), stars with approximately equal [Fe/H] are formed; instead, when the GM metallicity changes rapidly (phases a and c), stars born at slightly different cosmological times from accreted gas may have quite different [Fe/H], giving rise to the MDF plateau. In general, though, the number of stars formed during phase (a) is too small to be appreciated from the normalized MDF. As is decreased from to zero, phase (b) contracts in time, being almost suppressed for . The correspondingly lower GM metallicity, explains the shift of the low-[Fe/H] MDF cutoff to lower values. The metallicity increase during phase (c) brings [Fe/H] to values around -3, where Pop II always dominate the enrichment, independently of the value of . This physical picture holds qualitatively also for the lower case discussed below. This result can hardly be overlooked, as it shows that the MDF embeds the features imprinted by mechanical feedback and reflects the heavy element enrichment history of the MW environment.
As already mentioned, no stars have been detected so far by the various surveys in the range , a feature that we have dubbed as the “metallicity desert”. Not only the model with does not show such feature, but it also cannot account for the presence of the two HMP stars. The latter objects can instead be reproduced if . For the reasons explained above, the MDF plateau can extend now through the broad range [Fe/H]. Even in this favorable case, though, the metallicity desert cannot be reproduced. If the desert is real or is a mirage produced by selection effects, it is impossible to tell at this stage. What is clear though is that hierarchical models like the present one have serious difficulties to prevent the formation of stars in the desert [Fe/H] range. We will return to this in the discussion.
Finally, the case is somewhat peculiar. Although it predicts stars for [Fe/H], as expected from the previous arguments, its MDF shape is different with respect to cases with , showing a monotonic increase in the range [Fe/H]. When , in fact, no Pop III/II IMF transition occurs and, as a consequence, the GM enrichment proceeds more gradually. Even in this case, though, a considerable number of stars, is predicted in the metallicity desert.
6.2 The parameter
The useful parameter, , has been originally introduced by Oey (2003) and later improved by Tumlinson (2006). is defined as the number of metal-free stars divided by the total number of stars with [Fe/H]. This parameter allows to quantify the implications of the persisting non-detection of metal-free stars in the Galactic halo. The observational limit on the value of is given by the inverse of the total number of stars with [Fe/H] observed into the galactic halo (where the numerator of the ratio is fixed equal to 1 to give a non-vanishing limit). Using the preliminary data by Beers and Christlieb (2006) we find that . In Table 2 we present the values of obtained using the models , , .
Models give a value of compatible with the observational limit whereas for we find . In this case, in fact, the first burst of Pop III stars produces a huge amount of metal-free, long-lived stars which dramatically pushes beyond the allowed range. Thus, this parameter allows to robustly rule out models in which the critical metallicity is zero, and/or put an important constraint on primordial IMF. In the second option, in order not to conflict with the experimental limit, we must set a lower limit on the mass of the first stars equal to , i.e. the stars have a mass larger than the turn-off mass at , the epoch at which the first star formation events occur in our model.
6.3 Second generation stars
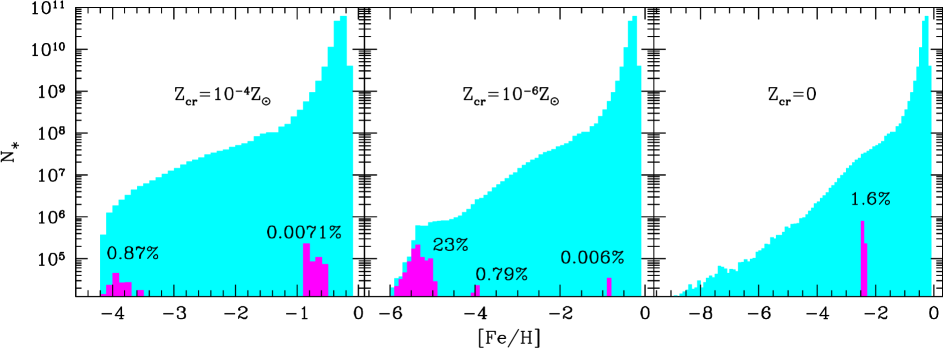
An additional information that can be extracted from our study is the fraction of “second generation” (2G) stars, defined as the stars which have been enriched only through the nucleosynthetic products of Pop III stars. From an observational point of view it is crucial to identify 2G stars, because, by studying their elemental composition we could trace back the properties of the first stars that polluted them.
In Fig. 8 we identify the MDF regions populated by 2G stars and their fractional number for three values of . For 2G stars populate both the lowest and the highest [Fe/H] tails of the MDF, i.e. they formed both in the accretion and self-enrichment modes. If , on the contrary, they can be produced only through self-enrichment. This is because in this case the first (Type II) SN are not energetic enough to expel their metals which remain confined within the parent halos.
More specifically, the dominant formation channel of 2G stars is accretion when and self-enrichment when , reflecting the different Pop III/II transition redshift. In the case the transition occurs rapidly as a result of the lower amount of metals necessary to reach the critical threshold. Hence, 2G stars can be formed through self-enrichment only in the few halos hosting Pop III stars; however, in unpolluted halos accreting gas from the GM, 2G stars can continue to form until the time at which feedback from Pop II stars raises the GM metallicity substantially. For the same reasons, the trend is reversed when .
Along with their location on the [Fe/H] axis, the percentages shown in Fig. 8 quantify the relative number of 2G stars with respect to the total number of stars in the iron-abundance ranges in which 2G stars are found. Two points are worth noting. First, the number of 2G stars formed by self-enrichment is negligible; even in the case , their relative abundance is only of the total population of stars with [Fe/H]; this means that only 10 of the 612 halo stars observed by Beers & Christlieb (2006) in the above [Fe/H] range could be truly 2G stars. Second, it is only in the metallicity bins close to the critical metallicity value that the fraction of 2G stars increases substantially, thanks to the accretion mode of formation operating at those metallicities. However, given the very low number of extremely metal-poor stars available, their absolute number is likely to be close to zero. In practice, given the Beers & Christlieb (2006) sample, out of the 1150 stars observed in the range [Fe/H], from the results of our model, quantified in Table 3, we conclude that, independently on the value, the probability to detect 2G stars is virtually zero.
| Number of 2G stars | |
|---|---|
7 Summary and Discussion
Using the newly developed Monte Carlo code, GAMETE, we have followed the gradual build-up of the stellar populations and metal enrichment of the Milky Way along its past hierarchical evolution within the concordance CDM model. Adopting simple but physically motivated prescriptions for star formation and chemical/mechanical feedback we have first calibrated our model to the observed global properties of the MW. Once the model free parameters (the star formation, , and the wind, , efficiencies) have been fixed through such calibration, the results have been compared against the most recent experimental data (Beers & Christlieb 2006) on the halo stars Metallicity Distribution Function. We have also explored different values of the critical metallicity, , which governs the transition from the Pop III to Pop II star formation mode (e.g. Schneider et al. 2002). The main results are the following:
-
1.
The global properties of the MW are well reproduced both using a closed-box model (, , i.e. no winds) and a model including mechanical feedback (, ); however, winds are required to dilute metals in the Galactic Medium and hence reproduce the wide range of [Fe/H] values characterizing halo stars (see Fig. 3).
-
2.
Stars with [Fe/H] form in halos accreting GM gas enriched by earlier supernova explosions.
-
3.
The fiducial (feedback included) model for which , provides a very good fit to the MDF, including the cutoff observed at [Fe/H]. However: the existence of the two HMP stars with [Fe/H] cannot be explained within this model.
-
4.
Models with can account for the two HMP stars at the price of overpopulating the “metallicity desert”, i.e. the range [Fe/H] in which no stars have been detected so far.
-
5.
The current non-detection of metal-free stars, giving a value of the parameter , robustly constrains either to be larger than zero or the masses of the first stars to be .
-
6.
The statistical impact of truly second generation stars, i.e. stars forming out of gas polluted only by metal-free stars, is negligible. For example, in the Beers & Christlieb (2006) sample only (at best) 1-2 stars could retain such metal-free nucleosynthetic imprint.
-
7.
Independently of , of metals in the Galactic Medium are ejected through winds by halos with masses , thus showing that low-mass halos are the dominant population contributing to cosmic metal enrichment.
The previous results provide a self-consistent and coherent physical scenario for the formation and evolution of the Galaxy in a cosmological context. The model also explains in detail how the transition to Pop II stars occurred and clarifies by what mechanisms (mostly self-enrichment and gas accretion) the various regions of the MDF have been populated.
In spite of these successes not all is clear and additional work will be necessary to understand some puzzling issues. No doubt that the most outstanding one is the unexplained existence of the “metallicity desert”. The problem in its simplest form can be stated as follows: in order to produce low-mass stars with [Fe/H] , the value of must be decreased to similar levels (or below); as a consequence, an uncomfortably large number of stars is predicted by such a model in the desert. Assuming that the extremely low [Fe/H] of the two stars (which are very CNO-rich and have a total ) is not a result of some peculiar nucleosynthetic history, ways to quench the formation of stars in the desert region must be devised. If the Pop III star formation episodes indeed spread their metals into the GM to reach a metallicity levels of , they could also heat the gas to about K. In such preheating scenario (Madau, Ferrara & Rees 2001) gas accretion on virializing halos with would be prevented, whereas star formation and self-enrichment could continue in already collapsed structures, which would increase the GM metallicity through their winds. It is only when dark matter halos of sufficiently large mass become numerous that accretion onto them could start again, now producing stars with [Fe/H]. Translated in redshift, and guided by Fig. 4, the metallicity desert could translate in a gap of at in which accretion is halted by the preheating, another aspect of the mechanical feedback, which once again is found to play a crucial role in the problem.
The Holy Graal of the various halo star surveys has undoubtedly been the detection of a truly metal-free star. As these objects have so far escaped detection, growing attention has been posed in the recent years on probing the nucleosynthetic patterns of extremely metal-poor stars, with the hope that these objects are born from gas polluted purely by (a single ?) metal-free SN. Unfortunately, our study shows that these second generation stars are no less elusive than their predecessors, having number frequencies that are so low to be zero even in the largest available sample used in the present analysis. These findings open a different perspective on the recent data by Cayrel et al. 2004 (later interpreted by Chiappini et al. 2005). Using a sample of 30 stars in the range [Fe/H] they measured the abundances of 17 elements from C to Zn, finding that these stars have an extremely low abundance ratio scattering. This is obviously contrary to what expected if these stars are direct descendants of the first generation(s) of stars formed after the Big Bang. Our results indicate that the stars used for the analysis are almost certainly not second generation stars; instead, they represent a more mature population in which the abundance scatter has been smoothed out by several re-processing cycles of the gas.
A number of assumptions and approximations have also been done, mainly dictated by our persisting ignorance of some physical processes. These also need to be improved in future studies. The most critical one is probably the perfect mixing approximation which may acclerate the extinction of metal free stars with respect to the epoch predicted by our results. This problem is partially alleviated by the spread induced by the stochastic nature of merger histories which appears to be similar to that found by sophisticated numerical simulations of mixing in individual galaxies (Mori & Umemura, 2006). An additional key hypothesis concerns the IMF of Pop III stars which has been taken to be either a -function in the SNγγ mass range or a standard Larson IMF when . Given the strong [Fe/H] dependence of we have assumed as reference value but we have also explored the implications of adopting the two extreme values of and in the Appendix. A Gaussian Pop III IMF centered in , as suggested by some theoretical works (see Nakamura & Umemura 2001; Scannapieco, Schneider & Ferrara 2003) might help explaining the concomitant existence of the two HMP stars and the metallicity desert.
Additional hypothesis have been made. Star formation has been take to occur in burst only, rather than in a continuous manner. This assumption is good for low-mass halos, but might become increasingly less accurate in larger galaxies. However, the fact that the global properties of the MW are well reproduced, seems to indicate that this is not a major concern. Also, instantaneous recycling has been used. This is definitely a fair approximation for very short-lived Pop III stars, but might be a relatively poor description of the chemical evolution driven by more evolved generations. This might induce an overestimate of the metallicity, and consequently, an earlier Pop III/II transition than the actual one; when averaged over the present Hubble time, though, this problem should not affect the derived MDF properties.
We finally like to comment on the differences between our results and those obtained by Tumlinson (2006). The treatment of chemical and mechanical feedback is probably more physical in our scheme, allowing metals/matter transfer between halos and the GM. Within our model, we find that the Pop III/II transition is a relatively sudden event, rather than a smooth one extending down to as Tumlinson found. This might be the result of the perfect mixing approximation that we have used, whose broad validity is supported by the afore-mentioned analysis of the metal filling factor evolution. Another difference between the two models resides in the calibration method: we select the best models in terms of the two free parameters and as those reproducing simultaneously all the observed global properties of the MW, rather than fixing them separately. As an indicator of the gas metallicity, we have used observations of gas in the Local Group (as for example the High Velocity Clouds), rather than the general IGM which is very likely not representative of the Galactic environment we are investigating.
In spite of these differences, there are no major tensions between the results of the two studies. It is worth noting that Tumlinson also identifies as the most probable transition threshold, although his analysis could not discriminate between largely different values, given the poorer sample statistics; also, the two HMP stars are not taken into account in his analysis.
Acknowledgements
We are grateful to T. Beers and N. Christlieb for providing us with their MDF data in advance of publication, and the anonymous referee for his/her insightful comments. We thank P. Bonifacio, N. Christlieb, A. Frebel, A. Helmi, N. Karlsson, E. Scannapieco, J. Tumlinson and the DAVID999www.arcetri.astro.it/science/cosmology/index.html members for enlightening discussions. The work has been completed during the program (INT-06-2a) of the Institute for Nuclear Theory, Seattle, whose support is gratefully acknowledged.
References
- [\citeauthoryearAbel, Brian & Norman2000] Abel T., Bryan G. L., Norman M. L. 2002, Sci, 295, 93
- [\citeauthoryearAnders & Grevesse1989] Anders E., Grevesse N. 1989, Geochimica et Cosmochimica Acta, 53, 197.
- [\citeauthoryearBardeen et al.1986] Bardeen J. M., Bond J. R., Kaiser N., Szalay A. S., 1986, ApJ, 304, 15
- [\citeauthoryearBarkana & Loeb2001] Barkana R., Loeb A., 2001, Phys. Rep., 349, 125
- [\citeauthoryearBeers et al.2002] Beers T. C., Preston G. W., Schectman S. A., 1992, ApJ, 103, 1987
- [\citeauthoryearBeers & Christlieb2005] Beers T. C., Christlieb N., 2005, ARA&A, 43, 531
- [\citeauthoryearBeers & Christlieb2006] Beers T. C., Christlieb N., 2006, private communication
- [\citeauthoryearBinney & Merrifield1998] Binney J., Merrifield M., 1998, Galactic Astronomy. Princeton Univ. Press , Princeton
- [\citeauthoryearBond et al.1991] Bond J. R., Cole S., Efstathiou G., Kaiser N., 1991, ApJ, 379, 440
- [\citeauthoryearBonifacio, Limongi & Chieffi2003] Bonifacio P., Limongi M., Chieffi A., 2003, Nat, 422, 834
- [\citeauthoryearBromm et al.2001] Bromm V., Ferrara A., Coppi P. S., Larson R. B., 2001, MNRAS, 328, 969
- [\citeauthoryearBromm, Coppi & Larson2002] Bromm V., Coppi P. S., Larson R. B., 2002, ApJ, 564, 23
- [\citeauthoryearBromm & Loeb2004] Bromm V., Loeb A., 2004, New Astron., 9, 353
- [\citeauthoryearBromm & Larson2004] Bromm V., Larson R. B., 2004, ARA&A, 42, 118
- [\citeauthoryearBrown, Velásquez, Aguilar2005] Brown A. G. A., Velásquez H. M., Aguilar L. A., 2005, MNRAS, 359, 287
- [\citeauthoryearCarney et al.1996] Carney B. W., Laird J. B., Latham D. W., Aguilar L. A., 1996, AJ, 112, 2
- [\citeauthoryearCarrol, Press & Turner1992] Carroll S. M., Press W. H., Turner E. L., 1992, Rev. A&A, 30, 499
- [\citeauthoryearCayrel et al.2004] Cayrel R. et al., 2004, A&A, 416, 1117
- [\citeauthoryearChiappini et al.2005] Chiappini C. et al., 2005, Nucl. Phys. A, 758, 217
- [\citeauthoryearChoudhury & Ferrara2006] Choudury T. R., Ferrara A., 2006, MNRAS, 371, L55
- [\citeauthoryearChristlieb et al.2002] Christlieb N., et al., 2002, Nat, 419, 904
- [\citeauthoryearChristlieb2003] Christlieb N., 2003, Rev. Mod. Astron., 16, 191
- [\citeauthoryearChristlieb et al.2004] Christlieb N., Gustafsson B., Korn A. J., Barklem P. S., Beers T. C., Bessell M. S., Karlsson T., Mizuno-Wiedner M., 2004, ApJ, 603, 708
- [\citeauthoryearChristlieb, Bessel & Eriksson2006] Christlieb N., Bessel M. S., Eriksson K., 2006, in preparation
- [\citeauthoryearCiardi & Ferrara2005] Ciardi B., Ferrara A., 2005, Space Sci. Rev., 116, 625
- [\citeauthoryearCole et al.2000] Cole S., Lacey C. G., Baugh C. M., Frenk C. S., 2000, MNRAS, 319, 168
- [\citeauthoryearDehenen & Binney1998] Dehnen W., Binney J., 1998, MNRAS, 294, 429
- [\citeauthoryearFrebel et al.,2005] Frebel A., Christlieb N., Norris J. E., Aoki W., Asplund M., 2005, Nat, 434, 871
- [\citeauthoryearFujita et al.2004] Fujita A., Mac Low M. M., Ferrara A., Meiksin A., 2004, ApJ, 613, 159
- [\citeauthoryearGanguly et al.2005] Ganguly R., Sembach K. R., Todd T. M., Savage B. D., 2005, ApJ, 157, 251
- [\citeauthoryearGnedin & Fan2006] Gnedin N. Y., Fan X., 2006, ApJ, 648, 1
- [\citeauthoryearHaiman & Bryan2006] Haiman Z., Bryan G. L., 2006, ApJ, 650, 7
- [\citeauthoryearHeger & Woosley2002] Heger A., Woosley S. E., 2002, ApJ, 567, 532
- [\citeauthoryearHernandez & Ferrara2001] Hernandez H., Ferrara A., 2001, MNRAS, 324, 484
- [\citeauthoryearHoek & Groenewegen1997] Van den Hoek L. B., Groenewegen M. A. T., 1997, A&A, 123, 305
- [\citeauthoryearIwamoto et al.2005] Iwamoto N., Umeda H., Tominaga N., Nomoto K., Maeda K., 2005, Sci, 309, 451
- [\citeauthoryearKarlsson2006] Karlsson N., 2006, ApJ, 641, 41
- [\citeauthoryearKashlinsky et al.2005] Kashlinsky A., Arendt R. G., Mather J., Moseley S. H., 2005, Nat, 438, 45
- [\citeauthoryearLacey & Cole1993] Lacey C., Cole S., 1993, MNRAS, 262, 627
- [\citeauthoryearLarson1998] Larson R. B., 1998, MNRAS, 301, 569
- [\citeauthoryearMac Low & Ferrara1999] Mac Low M.-M., Ferrara A., 1999, ApJ, 513, 1421
- [\citeauthoryearMadau, Ferrara & Rees2001] Madau P., Ferrara A., Rees M. J., 2001, ApJ, 555, 92
- [\citeauthoryearMori & Umemura2006] Mori M., Umemura M., 2006, Nat, 440, 644
- [\citeauthoryearNakamura & Umemura2001] Nakamura F., Umemura M., 2001, ApJ, 548, 19
- [\citeauthoryearNakamura & Umemura2002] Nakamura F., Umemura M., 2002, ApJ, 569, 549
- [\citeauthoryearOey2003] Oey M. S., 2003, MNRAS, 339, 849
- [\citeauthoryearOmukai & Nishi1998] Omukai K., Nishi R., 1998, ApJ, 508, 141
- [\citeauthoryearOmukai2001] Omukai K., 2001, ApJ, 534, 809
- [\citeauthoryearOmukai & Palla2003] Omukai K., Palla F., 2003, ApJ, 589, 677
- [\citeauthoryearOmukai et al.2005] Omukai K., Tsuribe T., Schneider R., Ferrara A., 2005, ApJ, 626, 627
- [\citeauthoryearO’Shea & Norman2006] O’Shea B. W., Norman M. L. 2006, ApJ, in press astro-ph/0607013
- [\citeauthoryearPage et al.2006] Page L. et al., 2006, ApJ, submitted, astro-ph/0603450
- [\citeauthoryearPrantzos2003] Prantzos N., 2003, A&A, 404, 211
- [\citeauthoryearPress & Schechter1974] Press, W. H., Schechter, P., 1974, ApJ, 187, 425
- [\citeauthoryearRipamonti et al.2002] Ripamonti E., Haardt F., Ferrara A., Colpi M., 2002, MNRAS, 334, 401
- [\citeauthoryearRyan & Norris1991] Ryan S. G., Norris J. E., 1991, AJ, 101, 5
- [\citeauthoryearSalvaterra et al.2006] Salvaterra R., Magliocchetti M., Ferrara A., Schneider R., 2006, MNRAS, 368, 6
- [\citeauthoryearScannapieco , Schneider & Ferrara2003] Scannapieco E., Schneider R., Ferrara A., 2003, ApJ, 589, 35
- [\citeauthoryearScannapieco et al.2006] Scannapieco E., Kawata D., Brook C. B., Schneider R., Ferrara A., Gibson B. K., 2006, ApJ, in press
- [\citeauthoryearSchneider et al.2002] Schneider R., Ferrara A., Natarajan P., Omukai K., 2002, ApJ, 571, 30
- [\citeauthoryearSchneider et al.2003] Schneider R., Ferrara A., Salvaterra R., Omukai K., Bromm V., 2003, Nat, 422, 869
- [\citeauthoryearSchneider et al.2006] Schneider R., Omukai K., Inoue A. K., Ferrara A., 2006, MNRAS, 369, 1437
- [\citeauthoryearShigeyama , Tsujimoto & Yoshii2003] Shigeyama T., Tsujimoto T., Yoshii Y., 2003, ApJ, 586, 57
- [\citeauthoryearSomerville & Kolatt1999] Somerville R. S., Kolatt T. S., 1999, MNRAS, 305, 1
- [\citeauthoryearSpergel et al.2006] Spergel D. N., et al. 2006, ApJ, submitted, astro-ph/0603449
- [\citeauthoryearStahler & Palla2004] Stahler W. S., Palla F., 2004, The Formation of Stars, WILEY-VCH Verlag Gmb & Co.KGaA, Weinheim.
- [\citeauthoryearSuda et al.2004] Suda T., Aikawa M., Machida M. N., Fujimoto M. Y., Iben I. Jr., 2004, ApJ, 611, 476
- [\citeauthoryearSugiyama1995] Sugiyama N., 1995, ApJ, 100, 281
- [\citeauthoryearTan & McKee2004] Tan J. C., McKee C. F., 2004, ApJ, 603, 383
- [\citeauthoryearTinsley1980] Tinsley B. M., 1980, Evolution of Stars and Gas in Galaxies, Gordon & Breach Science Publishers Ltd
- [\citeauthoryearTsuribe & Omukai2006] Tsuribe T., Omukai K., 2006, ApJ, 642, L61
- [\citeauthoryearTumlinson2006] Tumlinson J., 2006, ApJ, 641, 1
- [\citeauthoryearUmeda & Nomoto2003] Umeda H., Nomoto K., 2003, Nat, 422, 871
- [\citeauthoryearVolonteri, Haardt & Madau2003] Volonteri M., Haardt F., Madau P., 2003, ApJ, 582, 559
- [\citeauthoryearWisotzki et al.2000] Wisotzki L. et al., 2000, A&A, 358, 77
- [\citeauthoryearWoosley & Weaver1995] Woosley S. E., Weaver T. A., 1995, ApJ, 101, 181
- [\citeauthoryearYork et al.2000] York D. G. et al., 2000, AJ, 120, 1579
- [\citeauthoryearYoshida et al.2006] Yoshida N., Omukai K., Hernquist L., Abel T. 2006, astro-ph/0606106
Appendix A Varying the Pop III mass
The models in Sec. 6 assume and ; we now explore the effects of setting equal to , respectively. These two values are the extremes of the SNγγ mass range and correspond to the minimum and maximum iron yield of and . We recall instead that , independently of .
Following the same arguments using in Sec. 5.1 we have checked that models without feedback largely fail to reproduce the overall MDF shape also for ; then need for feedback is independent of the adopted Pop III stellar mass. We have derived the MDF for galactic halo stars for these two cases; this is shown in Fig. 9 for the usual values of the two free parameters , .
For , the shape of the MDFs is completely independent of and closely resembles the behavior found for the case . This result from the extremely low of stars which makes their contribution negligible to that of Pop II stars which are then controlling the MDF shape.
If instead, the MDF cutoff are quite sensitive to the value of , shifting to towards lower [Fe/H] values with decreasing . Such trend is very similar to the one already found for models with . However in this case, given the higher , the cutoff is located at higher [Fe/H]. For this reason the observed data are better reproduced by model with . Note however that even these models cannot account for the presence of the two HMP stars.
In conclusion the MDF is sensitive to the value of . However, as long as is within the SNγγ mass range, it is always possible to find satisfactory fits to the data by suitable changing within its uncertainty interval .
Most importantly both the value of (Sec. 6.2) and the number of 2G stars (Sec. 6.3) are practically independent of the value of . In particular, using the two best models , and , we obtain and , respectively. The expected number of 2G stars in the Beers & Christlieb (2006) sample, to be compared with Tab. 3, is equal to and , respectively.