Gamma-Ray Burst afterglows as probes of environment and blastwave physics I: absorption by host galaxy gas and dust
Abstract
We use a new approach to obtain limits on the absorbing columns towards an initial
sample of 10 long Gamma-Ray Bursts observed with BeppoSAX and selected on
the basis of their good optical and nIR coverage, from simultaneous
fits to nIR, optical and X-ray afterglow data, in count space and including
the effects of metallicity. In no cases is a MW-like extinction preferred,
when testing MW, LMC and SMC extinction laws. The 2175Å bump would in
principle be detectable in all these afterglows, but is not present in the
data. An SMC-like gas-to-dust ratio or lower value can be ruled out for 4 of
the hosts analysed here (assuming SMC metallicity and extinction law) whilst
the remainder of the sample have too large an error to discriminate. We
provide a more accurate estimate of the line-of-sight extinction and
improve upon the uncertainties for the majority of the extinction measurements made in previous studies of this sample. We discuss this method to determine extinction values in comparison
with the most commonly employed existing methods.
1 Introduction
The accurate localisation of Gamma-Ray Bursts (GRBs) through their optical and X-ray afterglows has enabled detailed studies of their environments. Selection by the unobscured gamma-ray flash alone has allowed the discovery of a unique sample of galaxies which span an enormously wide range of redshifts from 0.009 (GRB 980425, e.g. Tinney et al. 1998; Galama et al. 1998a) to 6.3 (GRB 050904, Kawai et al. 2005, 2006). The subset of long-duration ( 2 s) GRBs are almost certainly caused by the collapse of certain massive stars to black holes, confirmed by observations of supernova components in the late-time afterglows of a number of long-GRBs (Woosley & Bloom 2006; Kaneko et al. 2006) and by the observed location of GRBs in UV-bright regions within their host galaxies (Bloom et al. 2002; Fruchter et al. 2006). GRBs are located in host galaxies which are generally small, faint, blue and highly star-forming (e.g. Chary et al. 2002; Fruchter et al. 1999; Le Floc’h et al. 2003). Hence, detailed and extensive host galaxy observations provide a wealth of information on the gas and dust properties of star-forming galaxies throughout cosmological history.
Accurately measuring the dust content of these galaxies is of great importance in, to name one example, the determination of their unobscured star formation rates where uncertainty in the correction for dust can easily dominate the errors on the measured star formation rates for high redshift galaxies (e.g. Pettini et al. 1998; Meurer et al. 1999). Absorption within our own Galaxy along a particular line of sight can be estimated and removed, but absorption which is intrinsic to the GRB host galaxy as a function of wavelength is unknown, and is especially difficult to determine given its dependence on metallicity and the possible existence of dusty intervening systems whose extinction curves cannot be disentagled from those of the host galaxy. Afterglow spectroscopy and/or photometry can be used to provide an estimate of the total extinction along the line-of-sight to the GRB. If the host galaxy itself is bright and extended enough to be observed once the afterglow has faded, different lines-of-sight may be probed besides the off-centre UV-bright regions within which GRBs are generally situated.
Extinction in the optical/UV regime due to dust grains is typically modelled using either Milky Way (MW or Galactic), Large Magellanic Cloud (LMC) or Small Magellanic Cloud (SMC) extinction curves (e.g. Pei 1992) because these curves can be measured and so are well known, or with the Calzetti extinction law derived empirically from UV observations of starburst and blue compact galaxies (Calzetti et al. 1994). It appears that dust content in most GRB hosts produces an SMC-like extinction law (e.g. Galama & Wijers 2001; Vreeswijk et al. 2004; Stratta et al. 2004; Kann et al. 2006; Schady et al. in preparation), owing to an observed lack of the 2175Å feature thought to be caused by carbonaceous dust grains (Draine & Lee 1984). This feature has, however, been clearly observed in GRB afterglow spectra where the line of sight between us and the GRB is intercepted by intervening systems: the best example to date, in which the extinction curve of an intervening system could for the first time be disentangled from that of the host galaxy, is GRB 060418 (Ellison et al. 2006).
In general, low amounts of optical extinction are found towards GRBs, unexpected if GRBs are located in dusty star-forming regions, whilst the X-ray spectra reveal a different picture (first noted by Galama & Wijers 2001). At X-ray wavelengths absorption is caused by metals in both gas and solid phase, predominantly oxygen and carbon (see e.g. Wilms et al. 2000), and we often measure high values for the absorbtion columns. However, these absorption edges are shifted out of the X-ray observing window for high redshifts () beyond which only large columns can be measured and there is a degeneracy between redshift and X-ray column density (e.g. Watson et al. 2002). The GRB host metallicity is observed to be low (compared with the Milky Way) in measurements via optical spectroscopy of a dozen or so afterglows. Host metallicities can reach values as low as 1/100 Solar (GRB 050730, Starling et al. 2005; Chen et al. 2005, but see also Prochaska 2006 for potential caveats) - even lower than found for the SMC (see Figure 3 of Fynbo et al. 2006 for an overview). This only increases any measured X-ray column, which is expressed as an equivalent hydrogen column density, . But here we note that metallicities are not generally obtainable for lower redshift GRBs () due to the hydrogen Lyman- line lying in the far UV outside typical observing windows.
The apparent discrepancy between optical and X-ray extinction resulting in high gas-to-dust ratios in GRB host galaxies (often far higher than for the MW, LMC or SMC, e.g. GRB 020124, Hjorth et al. 2003, but see Schady et al. in preparation) is not satisfactorily explained, though the suggestion that dust destruction can occur via the high energy radiation of the GRB (e.g. Waxman & Draine 2000) could possibly account for the discrepancy. It is thought that circumburst dust may be destroyed by sublimation of dust grains due to UV emission (Waxman & Draine 2000), sputtering (Draine & Salpeter 1979) or dust grain heating and charging (Fruchter et al. 2001). Alternative models for the extinction by dust grains, including skewing the dust grain size distribution towards larger grains, have been investigated, and in fact such a grain size distribution may result from exposure of the dust to the GRB radiation field since destruction of small grains is more efficient than for larger grains (Perna et al. 2003). Attempts to model the process of dust destruction have been made by e.g. Perna & Lazzatti (2002). However, such models have not replaced SMC-like (low metallicity) extinction as the best description of most GRB environments (e.g. Stratta et al. 2004; Kann et al. 2006).
Traditionally the optical and X-ray spectra have been treated seperately in extinction studies. Since the underlying spectrum is likely a synchrotron spectrum (power law (pl) or broken power law (bknpl), e.g. Galama & Wijers 1998) extending through both wavelength regions, it would be most accurate to perform simultaneous fits. More recently such fits have been made, either by fitting the X-ray spectrum individually and thereby transforming the model counts to flux to create a spectral energy distribution (SED) with the optical data in flux space (e.g. Stratta et al. 2005; Watson et al. 2006), or by using the Swift XRT X-ray and UVOT Ultraviolet (UV) and ,, band data together in a fit to the count spectrum (e.g. Blustin et al. 2005; Schady et al. in preparation). The Swift UVOT data can be loaded directly into the xspec spectral fitting package and treated in count space owing to its calibration, which is generally not true for ground-based data. We present here an alternative method, which makes use of simultaneous fits in count space extending from near-infrared (nIR, in this case band) to X-ray (10 keV) to obtain the most accurate possible measurements of both the underlying continuum spectrum and the extinction.
In Section 4 we fit the broad-band SEDs (from nIR through X-ray) of a subsample of the BeppoSAX sample of GRB afterglows to better measure the extinction properties of their host galaxies - a sample chosen for its availability of suitable data well studied in the seperate optical and X-ray band passes. Section 2 outlines the data sample and reduction techniques. Section 3 describes the method we use to model the broad-band SEDs and Section 4 presents the results of our fitting through discussion of individual bursts and comparison with previous studies. In Section 5 we discuss the implications of our findings for galaxy extinction curves, and summarise and compare the various methods now available to measure extinction in the hosts. We conclude by summarising our method and findings in Section 6. An analysis of the blastwave parameters and density profiles for the circumburst media obtained from these fits will be presented in a forthcoming paper (Starling et al., Paper II).
2 Observations
This sample of 10 long GRBs observed with the BeppoSAX Narrow Field Instruments (approx. 0.1–10 keV) is chosen for the good availability (3 bands or more) of optical/nIR photometry (Tables 1 and 2). The optical/nIR bands available for each source and their references are listed in Table 3. As these GRBs are all previously studied, overlapping with the samples studied by Galama & Wijers (2001) and Stratta et al. (2004), this constitutes a good sample on which to first adopt this method of simultaneous SED fitting.
All X-ray observations are taken from the BeppoSAX data archives, using the LECS and MECS instruments raw data within the energy ranges 0.1–4 and 1.0–10 keV respectively. Data have been reduced using the SAXDAS routines. We combined data from the MECS2 and MECS3 instruments (except in the case of GRB 970228, where we use the MECS3 instrument only, see Stratta et al. 2004), including a gain equalisation. We then combined multiple observations for each source and instrument type among the narrow field instruments, omitting the last observation if it was 3 days later than the previous one, before extracting spectra. Background X-ray spectra were taken from blank fields and count rates checked against the local background finding no adjustments necessary: the net count rates of the two types of field agree on average to within 0.0001 counts s-1. The latest canned arf and rmf files were used with MECS data, but were created for LECS observations at their off-axis source positions (listed in Table 3 of Stratta et al. 2004). We group all spectra such that a minimum of 20 counts are in each bin in order to use the statistic. However, in the case of GRB 000926 there were very few counts in the X-ray spectrum so we have required only 10 counts per bin. There is a known offset between the normalisations of the LECS and MECS instruments. We fit for this offset in the X-ray spectra only, adding a constant-value free parameter to the model and adopting MECS as the reference for the LECS instrument. We fix the offset values in the SED of each GRB to these values (Table 1).
All temporal decay slopes, both for X-ray and optical lightcurves, have been taken from the literature and are listed together with Galactic extinction corrections in Table 2. Optical and nIR photometry was taken from the literature and from our own nIR observations of GRB 990510 (described in Curran et al. in preparation).
| GRB | obs start | obs end | obs midpt(log) | (s) | MECS–LECS offset | |
|---|---|---|---|---|---|---|
| (days since trigger) | MECS | LECS | ||||
| 970228 | 0.344 | 0.693 | 0.520 | 1.43104 | 5.611103 | 1.45 |
| 970508 | 0.434 | 3.091 | 1.679 | 5.90104 | 2.36104 | 1.09 |
| 971214 | 0.274 | 2.528 | 1.362 | 1.01105 | 4.62104 | 1.57 |
| 980329 | 0.294 | 2.026 | 1.148 | 6.38104 | 2.49104 | 0.68 |
| 980519 | 0.406 | 1.468 | 0.930 | 7.82104 | 2.31104 | 1.00 |
| 980703 | 0.827 | 1.902 | 1.333 | 3.92104 | 1.66104 | 0.99 |
| 990123 | 0.242 | 2.573 | 1.245 | 8.20104 | 2.80104 | 0.770.9 |
| 990510 | 0.334 | 1.850 | 1.067 | 6.79104 | 3.17104 | 0.86 |
| 000926 | 2.003 | 2.466 | 2.234 | 1.96104 | 5.027103 | 0.70 |
| 010222 | 0.376 | 2.703 | 1.511 | 8.84104 | 5.11104 | 1.43 |
| GRB | Gal. (1) | Gal. (2) | redshift | ∗ | ∗ | ∗ | + | |
|---|---|---|---|---|---|---|---|---|
| 970228 | 0.165 | 0.134 | 0.203 | 0.69500.0003a | 1.460.15 | - | - | 1.30.2 |
| 970508 | 0.0526 | 0.0485 | 0.050 | 0.8350.001b | 1.240.01 | - | - | 1.10.1 |
| 971214 | 0.0167 | 0.0128 | 0.016 | 3.4180.010c | 1.490.08 | - | - | 1.60.1 |
| 980329 | 0.0918 | 0.0916 | 0.073 | 3.6d | 0.850.12 | - | - | 1.50.2 |
| 980519 | 0.183 | 0.189 | 0.267 | - | 1.500.12 | 2.270.03 | 0.480.03 | 1.830.3 |
| 980703 | 0.0579 | 0.0498 | 0.057 | 0.96610.0001e | 0.850.84 | 1.650.46 | 1.350.94 | 0.90.2 |
| 990123 | 0.0213 | 0.0165 | 0.016 | 1.6000.001f | 1.240.06 | 1.620.15 | 2.060.83 | 1.440.11 |
| 990510 | 0.0924 | 0.0815 | 0.203 | 1.6190.002g | 0.920.02 | 2.100.06 | 1.310.07 | 1.40.1 |
| 000926 | 0.0265 | 0.0220 | 0.023 | 2.03790.0008h | 1.740.03 | 2.450.05 | 2.100.15 | 1.70.5 |
| 010222 | 0.0163 | 0.0175 | 0.023 | 1.47680.0002i | 0.600.09 | 1.440.02 | 0.640.09 | 1.330.04 |
-
(1)
taken from Dickey & Lockman 1990 (resolution of 1∘)
-
(2)
taken from the Leiden/Argentine/Bonn Galactic H I Survey, Kalberla et al. 2005 (resolution of 0.6∘)
-
∗
taken from Zeh et al. 2006, where uncertainties are 1
-
+
taken from Gendre & Boer 2005 and in ’t Zand et al. 1998 (GRB 980329, MECS 2–10 keV data), Nicastro et al. 1999 (GRB 980519)
-
a
Bloom et al. 2001 b Bloom et al. 1998a c Kulkarni et al. 1998 d photometric redshift only, Jaunsen et al. 2003 e Djorgovski et al. 1998 f Kulkarni et al. 1999a g Vreeswijk et al. 2001 h Castro et al. 2003 i Mirabal et al. 2002
3 Method
Per source all data are fitted simultaneously, assuming wherever possible no prior model. This is achieved by fitting in count space (as is traditional in the X-ray regime where one fits for the emission model, extinction and instrumental response simultaneously): the optical and nIR magnitudes are converted to flux and then to counts. For the magnitude to flux conversion we use the zero points and effective bandwidths of each optical band (Johnson for , , , , , , , 2MASS for and and Bessel for , , ). In the small number of cases for which the specific band is not stated, we assume the appropriate Johnson filter. These fluxes are then converted to photons cm-2 s-1 per bin (bin width effective bandwidth of the filter) within the ISIS spectral fitting program (Houck & Denicola 2000) which is equivalent to the X-ray units of counts cm-2 s-1 per bin since total number of counts is conserved.
Since we fit in count space, we need not first assume a model for the X-ray spectrum to convert the counts to flux. Herein lies one advantage of using this method. The second advantage comes through the multiwavelength approach. The nIR, optical and X-ray spectra are related since we assume the broadband spectrum is caused by synchrotron emission, hence a simultaneous fit provides greater accuracy and consistency between the parameters. Inclusion of nIR data and band optical data together with the 2–10 keV X-ray data, regions over which extinction has the least effect, allows the underlying power law slope to be most accurately determined.
The X-ray data typically have much longer exposure times than the individual optical/IR measurements, particularly given that where sensible we have combined X-ray datasets from different epochs to increase the signal to noise. We have chosen to omit the last X-ray observation of any GRB which occurs more than 3 days after the previous observation where this contributes more to the background noise than the signal and skews the observation time midpoint. We note that structure in the X-ray lightcurves and spectral changes at early times have often been reported for the better and earlier sampled Swift GRB afterglows (e.g. Nousek et al. 2006), which may affect the BeppoSAX afterglows with fairly early coverage, i.e. those beginning at 0.2–0.3 days since burst (see Table 1). All optical data are scaled to a common time, which corresponds to the midpoint of the X-ray observations, calculated in log-space. This is done by extrapolation according to the decay rates and lightcurve break times determined in a thorough analysis of pre-Swift burst optical lightcurves by Zeh et al. (2006, Table 2).
We fit for the X-ray and optical extinction at the redshift of the GRB. For GRBs 980329 and 980519 the redshift is not known, and therefore absorption at the source cannot be measured. However, a photometric redshift has been made for GRB 980329 of 3.6 (Jaunsen et al. 2003) which we adopt here. For GRB 980519 we adopt the mean redshift for this sample, 1.58, to make an estimate of the intrinsic absorption required.
Flux is depleted in the bluemost optical bands for high redshift bursts due to the Lyman absorption edges and the resulting transmission is calculated for each band per burst (see Curran et al. in preparation for further details of this calculation, which we note involves assuming a spectral slope for the optical flux over a given band and uses parameters from Madau 1995 and Madau et al. 1996). However, this has an effect only on the through band magnitudes of GRBs 971214 and 980329 and a minor effect on the band magnitudes of GRBs 980519, 990123, 990510 and 000926.
The errors on the optical magnitudes are taken from the photometric errors in the literature, and are set to 0.1 for cases where the literature reports a smaller error to account for systematic uncertainties. The conversion from magnitudes to flux has an associated error of up to 5 % (Fukugita et al. 1995). We note that by extrapolating magnitudes to different times we introduce a possible random error, since there is an uncertainty in the measured decay indices and break times, which we can allow for in an offset between the optical and X-ray data. This error is not included in the individual data points because this would introduce an artificially large error in the optical slope which is not in fact present since the relative errors between the bands do not change.
| GRB | bands used | refs |
|---|---|---|
| 970228 | VRcIc | [1] |
| 970508 | UBVRcIcKs | [2,3] |
| 971214 | VRIJKs | [4,5,6,7] |
| 980329 | RIJK | [8] |
| 980519 | UBVRcIc | [9] |
| 980703 | RIJHK | [10] |
| 990123 | UBVRIHK | [11] |
| 990510 | BVRIJHKs | [12,13] |
| 000926 | UBVRIJHK | [14] |
| 010222 | UBVRIJ | [15] |
-
1
Galama et al. 2000 2 Galama et al. 1998b 3 Chary et al. 1998 4 Halpern et al. 1998 5 Diercks et al. 1997 6 Tanvir et al. 1997 7 Ramaprakash et al. 1998 8 Reichart et al. 1999 and references therein (their Table 1) 9 Jaunsen et al. 2001 10 Vreeswijk et al. 1999 11 Galama et al. 1999 12 Stanek et al. 1999 13 Curran et al. in prep. 14 Fynbo et al. 2001 15 Masetti et al. 2001
3.1 Models
Data are fitted within the spectral fitting package ISIS (Houck & Denicola 2000) using both models written for use within xspec (Arnaud et al. 1996) and models written for ISIS.
Models consist of either a single or a broken power law, to allow for a
possible cooling break in between the optical and X-rays. Should the break in
the power law be due to cooling, the difference in slope is
(e.g. Wijers & Galama 1999), which we fix in the broken power law model.
On its way to us, the intrinsic power law is absorbed by optical extinction
at the host/burst redshift (this could be local to the GRB itself or another
location within the host galaxy). The extinction curves used for intrinsic
optical extinction in this study are Galactic-, SMC- and LMC-like (Figure 1)
following the prescriptions of Cardelli et al. (1989) and Pei (1992)
respectively. We do not use the Calzetti extinction curve (Calzetti et
al. 1994) because it has a
larger error associated with it, being constructed from fewer measurements
than those for the nearby Magellanic Clouds. There is also absorption in the
X-ray regime predominantly by metals, e.g. the oxygen edge, for which we use a
photoelectric absorption model. We refer the reader to Wilms et al.
(2000) for a detailed description of the X-ray absorption models. The X-ray
absorption model can be computed for various metallicities by simple scaling
of the Solar abundances by a constant factor. We adopt firstly Solar
metallicity and secondly the metallicity assumed in the optical extinction
model: using SMC-like absorption one would adopt =1/8 Z⊙ and for
LMC-like absorption =1/3 Z⊙ (Pei 1992), for self-consistency.
The flux is then corrected for Galactic absorption (Table 1). In the X-ray
regime these values are fixed at the values given in Dickey &
Lockman (1990), which are averages over 1 degree at the positions as given in
the Simbad catalogues or from the BeppoSAX Narrow-field instruments. For
completeness and comparison, we also list in Table 1 extinction measurements
from the newer and slightly higher resolution Leiden/Argentine/Bonn Galactic
H I Survey (resolution of 0.6∘, Kalberla et al. 2005). These
new values are not significantly different than those of Dickey & Lockman
though appear to be generally lower, and
to date all previous studies use the values from Dickey & Lockman which we will also use here. For
the optical extinction we use values given by Schlegel et al. (1998) from their full-sky 100 µm map together with
the Galactic extinction curve of Cardelli et al. (1989) with
. The Schlegel et al. (1998) maps have a best resolution of 6.1’: for each source we use the best resolution available, but in some cases we must use an average over 1 square degree centred on the source coordinates.
The fit statistic calculated is , using a Levenberg-Marquardt fit
minimisation method. Errors in the LECS-MECS offsets (except for
GRB 970508), optical decay slopes and redshifts are not propagated through
the fitting routines. These values are simply fixed from Tables 1 and 2
respectively. We also do not include uncertainties on the zero points on our
photometric data points (see previous Section).

| GRB/model | (1022 atoms cm-2) | (keV) | /dof | F-test prob. | ||
| GRB 970228 | ||||||
| pl+mw | 0 | 0 | 1.72 | 11.6/14 | ||
| pl+lmc | 0 (0.001) | 0 | 1.72 | 11.6/14 | ||
| pl+smc | 0 (0.01) | 0 | 1.72 | 11.6/14 | ||
| bknpl+mw | 0.54 | 0 | 2.06 | 0.32 | 7.6/13 | 2.110-2 |
| bknpl+lmc | 0.54 (1.22) | 0 | 2.06 | 0.32 | 7.6/13 | 2.110-2 |
| bknpl+smc | 0.54 (2.01) | 0 | 2.06 | 0.32 | 7.6/13 | 2.110-2 |
| GRB 970508 | ||||||
| pl+mw | 1.57 | 0 | 1.94 | 38.7/31 | ||
| pl+lmc | 1.57 (3.83) | 0 | 1.94 | 38.7/31 | ||
| pl+smc | 1.57 (6.84) | 0 | 1.94 | 38.7/31 | ||
| bknpl+mw | 1.93 | 0.043 | 2.09 | U (0.27) | 31.2/30 | 1.210-2 |
| bknpl+lmc | 1.93 | 0.040 | 2.09 | U (0.25) | 31.7/30 | 1.510-2 |
| bknpl+smc | 2.08 | 0.0350.035 | 2.12 | U (0.26) | 32.2/30 | 2.110-2 |
| optical:X-ray | offset | free | (see text) | |||
| pl+mw | 0.718 | 0.004 | 1.76 | 32.1/30 | 1.910-2 | |
| pl+lmc | 0.756 (1.80) | 0 | 1.78 | 32.1/30 | 1.910-2 | |
| pl+smc | 0.756 (3.50) | 0 (0.005) | 1.78 | 32.1/30 | 1.910-2 | |
| bknpl+mw | 0.63 | 0.032 | 2.14 | U (3.42) | 29.7/29 | 0.236,0.137 |
| bknpl+lmc | 0.72 | 0.021 | 2.17 | U (3.48) | 30.1/29 | 0.224,0.176 |
| bknpl+smc | 0.88 | 0.007 | 2.23 | U (3.56) | 30.3/29 | 0.188,0.200 |
| GRB 971214 | ||||||
| pl+mw | 10.88 | 0.045 | 1.600.04 | 37.6/44 | ||
| pl+lmc | 11.47 (31.70) | 0.036 | 1.600.04 | 34.4/44 | ||
| pl+smc | 11.48 (68.77) | 0.0310.018 | 1.600.03 | 33.2/44 | ||
| bknpl+mw | 28.37 | 0.0560.051 | 2.04 | U (1.56) | 35.8/43 | 0.149 |
| bknpl+lmc | 29.78 | 0.044 | 2.04 | U (1.40) | 31.7/43 | 6.210-2 |
| bknpl+smc | 22.12 | 0.058 | 1.85 | U (0.048) | 30.1/43 | 4.110-2 |
| GRB 980329 | ||||||
| pl+mw | 0.0012 | 0.358 | 1.88 | 38.4/27 | ||
| pl+mw+ free | 0.001 | 0.247 | 1.81 | 32.7/26 | 4.310-2 | |
| pl+lmc | 0.001 (0.001) | 0.210 | 1.84 | 35.4/27 | ||
| pl+smc | 0 (0.001) | 0.178 | 1.82 | 34.3/27 | ||
| bknpl+mw | 3.42 | 0.346 | 2.34 | U (2.39: 6.89) | 35.4/26 | 0.150 |
| bknpl+lmc | 8.00 (21.7) | 0.211 | 2.260.31 | U (1.09: 5.79) | 31.7/26 | 9.310-2 |
| bknpl+smc | 7.50 (42.5) | 0.179 | 2.25 | U (1.08: 5.54) | 30.2/26 | 7.210-2 |
| GRB 980519 | ||||||
| pl+mw | 0 | 0.008 | 1.97 | 18.9/23 | ||
| pl+lmc | 0 (0.06) | 0.014 | 1.980.04 | 18.0/23 | ||
| pl+smc | 0.005 (0.36) | 0.013 | 1.98 | 17.7/23 | ||
| bknpl+mw | 0.84 | 0.012 | 2.44 | U (1.76: 0.26) | 17.4/22 | 0.182 |
| bknpl+lmc | 1.27 (3.22) | 0.019 | 2.44 | U (1.56) | 16.0/22 | 0.111 |
| bknpl+smc | 1.39 (6.52) | 0.017 | 2.43 | U (1.46) | 15.6/22 | 9.910-2 |
| GRB 980703 | ||||||
| pl+mw | 0.55 | 0.3020.059 | 1.920.03 | 30.2/27 | ||
| pl+lmc | 0.54 (1.33) | 0.2750.054 | 1.920.03 | 30.0/27 | ||
| pl+smc | 0.53 (2.35) | 0.287 | 1.920.03 | 29.8/27 | ||
| bknpl+mw | 1.35 | 0.31 | 2.38 | 1.40 | 22.9/26 | 810-3 |
| bknpl+lmc | 1.34 (3.28) | 0.28 | 2.37 | 1.40 | 22.6/26 | 710-3 |
| bknpl+smc | 1.33 (5.80) | 0.30 | 2.37 | 1.40 | 22.3/26 | 710-3 |
| GRB 990123 | ||||||
| pl+mw | 0 | 0.006 | 1.610.01 | 191/121 | ||
| pl+lmc | 0 | 0.004 | 1.610.01 | 191/121 | ||
| pl+smc | 0 | 0.004 | 1.610.01 | 191.3/121 | ||
| bknpl+mw | 0.61 | 0.01 | 2.01 | 0.67 | 115.5/120 | 710-15 |
| bknpl+lmc | 0.59(1.43) | 0.01 | 2.00 | 0.55 | 115/120 | 710-15 |
| bknpl+smc | 0.59(2.54) | 0.014 | 1.99 | 0.55 | 115/120 | 610-15 |
| GRB 990510 | ||||||
| pl+mw | 0 | 0 | 1.855 | 129/78 | ||
| pl+lmc | 0 | 0 | 1.854 | 129/78 | ||
| pl+smc | 0 | 0 | 1.855 | 129/78 | ||
| bknpl+mw | 0.12 | 0 | 2.03 | 0.0180.002 | 83.3/77 | 710-9 |
| bknpl+lmc | 0.13 (0.34) | 0 | 2.03 | 0.0180.002 | 83.3/77 | 710-9 |
| bknpl+smc | 0.13 (0.74) | 0 | 2.03 | 0.0180.002 | 83.3/77 | 710-9 |
| GRB 000926 | ||||||
| pl+mw | 0 fixed | 0.166 | 1.80 | 27.5/16 | ||
| pl+lmc | 0 fixed | 0.1190.015 | 1.77 | 11.7/16 | ||
| pl+smc | 0 fixed | 0.100 | 1.76 | 15.0/16 | ||
| bknpl+mw | 0 fixed | 0.167 | 2.300.09 | U (4.36: 0.59) | 27.4/15 | 0.818 |
| bknpl+lmc | 0 fixed | 0.122 | 2.25 | U (2.23: 0.02) | 11.1/15 | 0.382 |
| bknpl+smc | 0 fixed | 0.102 | 2.25 | U (2.90: 0.38) | 14.7/15 | 0.588 |
| GRB 010222 | ||||||
| pl+mw | 0.63 | 0.0630.033 | 1.870.03 | 97.2/137 | ||
| pl+lmc | 0.60 (1.44) | 0.043 | 1.86 | 95.5/137 | ||
| pl+smc | 0.58 (2.39) | 0.035 | 1.85 | 96.3/137 | ||
| bknpl+mw | 1.35 | 0.0870.051 | 2.07 | U (0.03) | 96.9/136 | 0.518 |
| bknpl+lmc | 1.15 (2.68) | 0.076 | 2.02 | 0.01 | 86.5/136 | 210-4 |
| bknpl+smc | 1.15 (4.57) | 0.0600.023 | 2.02 | 0.017 | 86.3/136 | 110-4 |
4 Results
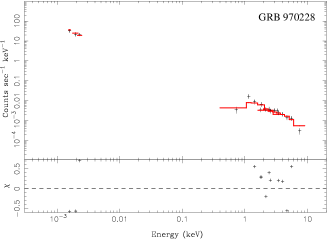
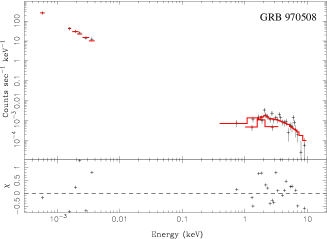
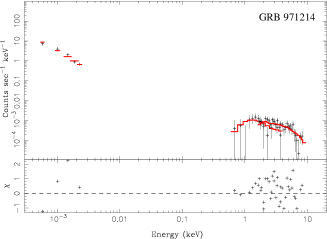
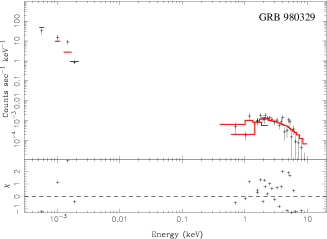
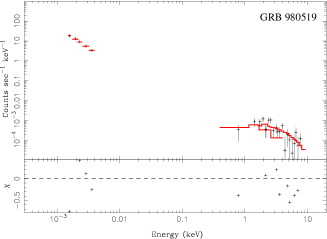
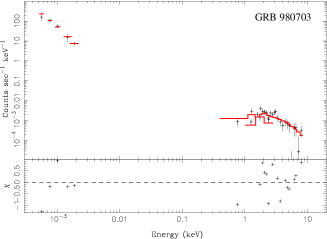
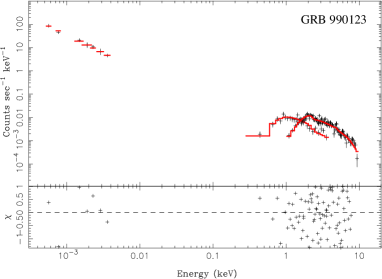
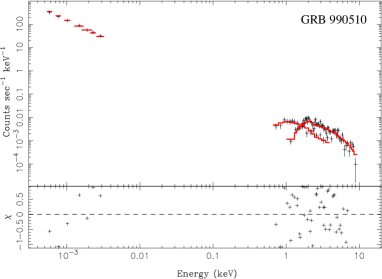
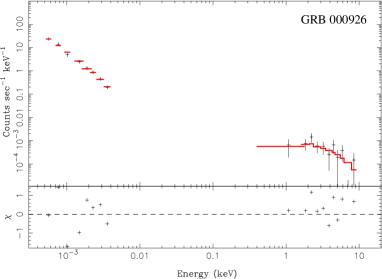
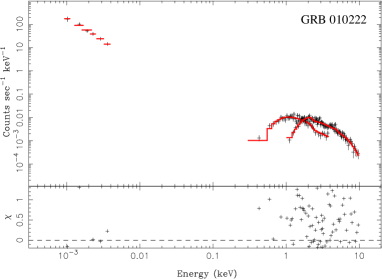
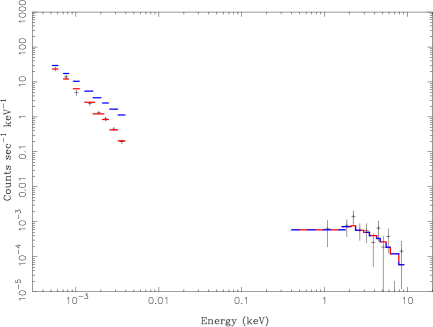
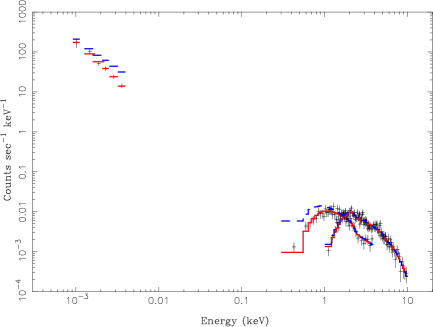
The SEDs and the results of fits to the SEDs for all GRBs in the sample are listed in Table 4, and best fitting models are shown overlaid on the data in Figure 2. Figure 3 shows a comparison of the absorption measurements with Galactic, LMC and SMC gas-to-dust ratios, which we discuss in the following section. This plot has been constructed in a number of previous works (e.g. Galama & Wijers 2001; Stratta et al. 2004; Kann et al. 2006; Schady et al. in preparation) but here we show the observed distribution of and for the first time derived simultaneously from a fit to X-ray, optical and nIR data. We find an excess in absorption above the Galactic values particularly significant in two sources: GRBs 000926 ( only) and 010222 (Figure 4), whilst no significant intrinsic absorption is necessary in GRBs 970228 and 990510. The cooling break can be located in three of the afterglows: GRBs 990123, 990510 and 010222 and to all other SEDs a single power law is an adequate fit. Details are given below for each individual afterglow.

4.1 Notes on individual sources
4.1.1 GRB 970228
No significant absorption is measured for GRB 970228. We find only a single power law is required and it is possible to pin down the power law slope relatively well (/dof 11.6/14).
4.1.2 GRB 970508
A well-defined temporal decay slope starting 1.9 days after trigger (Zeh et al. 2006). Preceding this time there is an increase in flux followed by an apparent flattening. The time of the X-ray observation log midpoint occurs a little before the 1.9-day break at 1.679 days, so we have extrapolated the optical data post 1.9 days back to 1.9 days and then assume that the evolution of the lightcurve is flat back to 1.679 days after trigger. To allow for a different behaviour before 1.9 days we include a constant value offset in the model between the optical and X-ray data, which we both fix at 1.0 and leave as a free parameter. The improvement in the fits when the offset is a free parameter is somewhat marginal. An F-test indicates that the free-parameter model is better at a 98% level, with the offset increasing to 3. Given the uncertain extrapolation, however, we use the fits with the offset as a free parameter in our further analysis. The best fitting model for GRB 970508 is a single power law with relatively low intrinsic X-ray absorption at the level of 1021 cm-2. Kann et al. (2006) found a best fit with MW-like dust, but as we measure no significant optical extinction we cannot distinguish between different extinction laws.
4.1.3 GRB 971214
GRB 971214 is the highest redshift source in the sample at = 3.418, and we note that the source was faint, particularly as seen by LECS, crucial for the low X-ray energies. We measure an optical-to-X-ray spectral index of 0.6 and find that a single power law is an acceptable fit to these data. The intrinsic X-ray absorption appears to be extremely large whilst the optical extinction is moderately large, but we note that the high redshift of the GRB makes measurement of the X-ray extinction more difficult. The curvature in the optical part of the spectrum has been previously interpreted as a cooling break (Wijers & Galama 1999) and as extinction by either SMC-like extinction (Stratta et al. 2004) or by a presently unknown, more complex extinction law (Halpern et al. 1998; Ramaprakash et al. 1998). Whilst SMC extinction is the best fitting law of the 3 used here, it is not sufficient to accurately reproduce the shape of the optical SED, reflected in the large errors on and .
4.1.4 GRB 980329
In the absence of an accurate redshift determination for GRB 980329 we adopt the photometric redshift of = 3.6 (Jaunsen et al. 2003), hence all results must be taken with caution. The most striking feature of this SED is the apparent flux deficit in the band, which is present even after correction for Galactic absorption and the probable high redshift. We tested for the possibility that the R-band flux deficit is due to the 2175Å feature in the Milky Way extinction curve by fitting the pl+MW model whilst leaving the redshift as a free parameter lying between = 1.2 and = 4.2 (Jaunsen et al. 2003) (we note that at = 3.6 the 2175Å bump would lie between the and bands if extinction is MW-like, which is not observed). We obtain a fit with /dof = 32.7/26 and = 1.95. The other best-fitting parameters, as listed in Table 5 for standard fits, do not differ greatly from those found in the = 3.6 fit and the optical curvature is no better fitted. We also tested for the possibility that the R-band deficit is caused by a break in the power law, by allowing the break energy to reside within the optical regime (and adopting = 3.6 with SMC extinction). In this fit the break energy could not be well constrained, and the power law slopes are not well described by the difference of 0.5 as expected for a cooling break (the second slope is steeper), hence we rule out this possibility. However, it is also possible that we are seeing an band excess rather than an band deficit. Two late time band points taken at 1–10 days since burst (Yost et al. 2002) appear not to agree with all of the band data used here (Reichart et al. 1999), which could be the result of overestimation of the early magnitudes, underestimation of the later magnitudes or the occurrence of color evolution. Among the models applied to the whole GRB sample here, a single power law unabsorbed in the X-rays is the best fit, with a moderate of 0.178 and a slight preference for SMC extinction.
4.1.5 GRB 980519
We caution that all the results are based on a redshift estimate equal to the mean of the sample spectroscopic redshifts of = 1.58. A few attempts to constrain the redshift have not been very precise, amounting to 0.53.6 or 1.53.6 (lower limits from Jaunsen et al. 2003 and upper limit from the fact that we detect a band counterpart). We find that a single power law with a small and X-ray absorption consistent with zero but with a large error is sufficient to model this afterglow. We note that the Galactic X-ray extinction towards GRB 980519 is the highest for this sample which, together with the lack of known redshift hampers a good measurement of for this source.
4.1.6 GRB 980703
A single power law provides an acceptable fit to the spectrum, when absorbed by a large amount at both X-ray and optical/UV wavelengths. In this afterglow we measure the largest value in the sample of 0.290.05 or 0.85 at 1.33 days after burst assuming SMC extinction (which is marginally preferred). This is consistent with the value found by Bloom et al. (1998b) of , 5.3 days after the burst.
A great deal of work has been done on the host galaxy properties of this burst because the host is bright, with optical extinction measurements by 5 groups. There is a hint that the optical extinction may be decreasing with time (see e.g. Holland et al. 2001) since measurements of at different times are inconsistent: 2.2 at 0.9 days, Castro-Tirado et al. 1999; 1.5 at 1.2 days, Vreeswijk et al. 1999; 0.3 at 4.4 days, Djorgovski et al. 1998; 0.9 at at 5.3 days, Bloom et al. 1998b, and there appears to be a discrepancy between the measured optical spectral and temporal slopes when assuming is constant. However, we note that the optical spectral slope was taken to be = -2.710.12 from Vreeswijk et al. (1999), and in this study we obtain a lower value of = -0.920.03 which would be completely consistent with = (1+2)/3 = 0.9 using = 0.85 from Zeh et al. (2006, noting their value has a very large associated error - Table 1). We use the Vreeswijk et al. (1999) optical data here and scale it from 1.2 days to 1.33 days after trigger. Combining the optical and X-ray data when fitting provides us with a different estimate for the extinction than was obtained by Vreeswijk et al. for the optical data alone. We note that we have made only a minimal extrapolation of the original optical data used in this analysis, from 1.2 days to 1.3 days after trigger.
4.1.7 GRB 990123
GRB 990123 does not have significant X-ray absorption above the Galactic value, and the optical extinction is consistent with zero. We set an upper limit to the latter which is ten times lower than the value found by Savaglio et al. (2003) from fits to Zn II and H I in the optical spectrum. A single power law fit to both optical and X-rays results in a spectral slope of =0.61 at 1.24 days since burst, comparable to the =0.670.02 at about the same time since the burst found by Galama et al. (1999). The latter authors note that the cooling break must lie at or above X-ray frequencies at that time. However, we find an improved fit with a broken power law, constraining the cooling break to 0.15 2.4 keV, within the X-ray spectrum, also found by Stratta et al. (2004), Corsi et al. (2005) and Maiorano et al. (2005). We note, however, that the X-ray spectrum comprises flux accumulated between 0.2 and 2.6 days since burst, including the proposed jet break time of 2 days (Table 2). We tested for the possibility that the offset between optical and X-ray data was incorrect, but this made very little difference to our overall goodness of fit. It is possible that the cooling break has entered the X-ray band during these observations, since this break is expected to decrease in frequency with time. If this is the cooling break, the spectral slopes above and below the break differ by the expected factor of 0.5 when left free. We therefore took only the data from the first X-ray observation, before the jet break (Zeh et al. 2006), together with scaled optical/nIR data, which has a log midpoint of 0.7 days since trigger. We repeated all our fits. We find acceptable fits again only with the broken power law model, with the break energy lying somewhere between the optical and 2 keV (preferring central values just below X-ray frequencies, in line with our X-ray only analysis in which a single power law is a good fit to all spectra). We note that an excess of flux at high energies (as seen by the BeppoSAX PDS instrument not used here) is reported by Corsi et al. (2005). They attribute this to an Inverse Compton component (though we note that this remains inconsistent with the radio data, Kulkarni et al. 1999b). Since the X-ray spectrum is adequately fit with a single power law we assume that the tail of any such component is not significant below 10 keV.
4.1.8 GRB 990510
Fits with Galactic, LMC- and SMC-like extinctions show that is very low in this source and we can only determine upper limits. The low amount of extinction makes it impossible to pin down the extinction curve shape, hence a fit using Galactic-like extinction is sufficient here and LMC- and SMC-like extinctions give similar results. There is considerable improvement in the when allowing for a break in the power law, noted by previous authors, which we find is located at 0.016–0.020 keV at 1.06 days since burst (of the order of the value of 0.029 keV at 1 day since burst given by Pian et al. 2001). The slope change is as expected for a cooling break in the slow cooling regime when leaving both power law slopes free. Our measured spectral slope in the optical regime agrees well with that measured in the Very Large Telescope (VLT) spectra of = 0.60.1 by Vreeswijk et al. (2001).
We note that Kuulkers et al. (2000) analysed these X-ray data in several time bins and found no spectral evolution, hence the cooling break remains outside the X-ray frequencies during the observations. We constrain the optical extinction to be 0.01, and the X-ray equivalent hydrogen column to be 0.151022 cm-2 for SMC extinction and 0.871022 cm-2 for MW extinction. From the X-ray spectrum alone a higher column of = 2.1 0.61021 cm-2 was measured by Kuulkers et al. (2000). Optical spectra have provided a lower limit on the amount of neutral hydrogen towards GRB 990510 of log (H I) 19.7 cm-2 (Vreeswijk et al. 2001). These authors obtain an approximate estimate for the metallicity from the optical spectra using Fe/H, and find 12+ log [Fe/H] = -1.5 0.5 or 0.01–0.1 times the Solar value. This range approximately covers the metallicity of both the LMC (0.33, Pei 1992) and the SMC (0.125, Pei 1992) so we also fitted the data with these two metallicities. As there is no substantial absorption observed, the fits do not change significantly.
4.1.9 GRB 000926
The optical and IR SED of this burst is very well sampled, but the X-ray afterglow was very faint at the time of observation. For this reason these X-ray data have been grouped to have a maximum of only 10 counts per bin, and strictly speaking this means Gaussian statistics should be treated with caution. However, we do use the statistic as a goodness of fit for comparison with the rest of the sample. Given the poor quality of the X-ray data, and the lack of sufficient counts in low X-ray energy bins, we have fixed the X-ray column density at zero and fit only for the optical extinction. We find a large amount of intrinsic extinction is necessary to describe the flux deficit with respect to a single power law, consistent with the value found by most other studies (Stratta et al. 2004; Fynbo et al. 2001; Harrison et al. 2001; Price et al. 2001). A large extinction was also derived from an optical spectrum by Savaglio et al. (2003), and the found in that study is approximately twice the value found here. However, Savaglio et al. use the spectral line measurements to first fit for the depletion pattern and then infer an extinction. Harrison et al. (2001) interpreted the optical flux deficit as indicating that a significant fraction of the X-ray flux was in fact Inverse Compton emission - later also suggested for GRB 990123 (see above). This is the only afterglow for which an LMC extinction law is (marginally) preferred. Fynbo et al. (2001) report a tentative H I column density measurement of (H I) 21021 cm-2 which leads to a relatively high metallicity with [Zn/H] = -0.13. This metallicity is between the LMC and the MW values, which may explain the preference here for LMC-like extinction if no 2175Å bump is present.
4.1.10 GRB 010222
A good dataset for GRB 010222 allows the spectral properties to be well constrained. We find that whilst a single power law is a reasonable fit to these data, a broken power law significantly improves the fit. The break energy lies around 0.01 keV, above the frequency of the last optical band in our SED. Optical extinction is clearly non-zero, with = 0.060.02, consistent with that found by Lee et al. (2001) for an SMC extinction law but about three times lower than that inferred from the spectral lines by Savaglio et al. (2003). X-ray absorption is also required with an effective hydrogen column of = 1.15 1022 cm-2.
Panaitescu & Kumar (2002) in their fits to the multiwavelength afterglow of this source find significant reddening of the optical spectrum of with an SMC extinction curve, which is consistent with our value. But they find a large fitting error and attribute this to 8 outlying points suggesting that either some reported observations have underestimated uncertainties or there are short timescale fluctuations in the afterglow emission (Cowsik et al. 2001). Their jet model requires the cooling break to pass through the X-ray band at about 1 day, which they find incompatible with their observations. Our analysis places the cooling break at optical/UV wavelengths at 1.51 days since burst.
4.2 Comparison with previous studies
We can compare our results directly with those of previous studies of samples overlapping with this BeppoSAX subsample. In general, we are finding similar central values for extinction as all previous studies, and are improving upon the uncertainties, fitting all afterglows in the same consistent manner allowing for direct comparison.
Galama & Wijers (2001) performed the first systematic study of line-of-sight and with a sample of 8 afterglows, consisting of all but the two most recent bursts in our sample. From fits to the X-ray spectra they found intrinsic amounting to 1022-1023 cm-2, ruling out the possibility that some hosts have no X-ray column at all. They noted that these values lie in the range of Galactic giant molecular clouds (estimating cloud sizes of 10–30 pc) - a conclusion also recently arrived at when including Swift bursts (Campana et al. 2006a) and when measuring H I from damped Lyman alpha absorption in GRB optical afterglow spectra (Jakobsson et al. 2006a). They used a simple extinction law with a smoothly broken power law. Comparing their dust to gas ratios with that of the Milky Way they obtain an optical extinction 10–100 times smaller than expected. Their finding of generally low was attributed to previously predicted dust destruction by the GRB. Of the bursts common to both their and our samples and having a known redshift we obtain consistent extinction values within the 2 uncertainties in all cases except for GRB 971214 for which the two optical extinctions are only consistent at the 3 level, our central value lying four times lower than the Galama & Wijers measurement. We obtain smaller uncertainties in our extinction measurements in all cases except for the X-ray column of GRB 980703.
Stratta et al. (2004) have also measured and A in the optical and X-ray data seperately, and later plotted the combined data in flux space (after assuming the X-ray model to be correct) in order to judge the position of the cooling break. To derive optical spectral slopes, Stratta et al. first adopt the -value derived from the X-ray fits (the input electron energy index, see Paper II for our fits for this parameter), use this to fix the optical spectral index and fit for . Our results for with SMC-like extinction are consistent in all cases to within the 90 % confidence limits, adopting the cooling break positions found from this work if known (the values for GRB 970508 are only consistent if ). Even for the two GRBs for which we have assumed different redshifts we find consistency in extinction estimates (Stratta et al. adopt = 1 for both 980329 and 980519). In 7 of the 10 cases we derive a better constrained value or upper limit to the extinction. The X-ray absorbing columns we measure are also generally consistent with those found by Stratta et al. in a fit to the X-ray data only (these are of course the same data used in our study, except for differences in number of observations combined for some sources, and we include GRB 000926 as well). Our method obtains improved estimates for for 7 of the 9 sources common to both studies. For GRB 990510 Stratta et al. find a value higher than our derived using Solar metallicity, and for GRB 980329 our result for is less accurate at the 90 % confidence level, though we note the different redshifts assumed hence direct comparison is not possible.
Kann et al. (2006) fitted only the optical SEDs for a sample of pre-Swift bursts including 8 analysed here (not including GRBs 970228 and 980329 and using = 1.5 for GRB 980519). We find similar central values of and improve upon their mean error by a reduction of 5–10 %. Values disagree at the 90 % confidence level only for GRB 970508, where we find an upper limit to the extinction which is 2.4 times lower than the lower limit of Kann et al. but would be consistent with their estimate at the 3 level.
5 Discussion
For half the afterglows the best-fitting model to the SED includes SMC-like extinction (as opposed to LMC or MW) and in one case LMC-like extinction. In no cases is there a preference for MW-like extinction. We are sensitive to the 2175Å bump (MW) in the redshift range = 0.46–9.9, covering all our selected GRBs, but clearly we do not detect any such feature. We find a wide spread in central values for the gas-to-dust ratios, and for 4 GRBs the gas-to-dust ratios are formally inconsistent with MW, LMC and SMC values at the 90 % confidence limit assuming the SMC metallicity (Figure 5). In these 4 cases the ratio is several orders of magnitude higher than the SMC value of 4.40.71022 cm-2 mag-1 (Koornneef 1982; Bouchet et al. 1985) and must mean that either gas-to-dust ratios in galaxies can span a far larger range than thought from the study of local galaxies, or the ratios are disproportionate in GRB hosts because the dust is destroyed by some mechanisms (likely the GRB jet), or that the lines of sight we probe through GRBs tend to be very gas-rich or dust-poor compared with random lines of sight through galaxies. Finally, a dust grain size distribution which is markedly different than considered here may also affect these ratios.
In fact, a recent study has shown that for the LMC the former is true. A recent observation of four core-collapse supernova remnants (SNRs) in the LMC with Spitzer has shown IR emission associated with the supernova blastwave (Williams et al. 2006). This is interpreted as dust with an LMC-like grain size distribution which has been collisionally heated by the X-ray emitting plasma. The observations require that some fraction of the small dust grains has been destroyed by sputtering by high energy ions in fast shocks. Dust destruction is known to occur in SNR shock fronts (Jones 2004), and we will return to this issue later in the section. The derived gas-to-dust ratios are several times higher than the LMC ratio, as we see in the line-of-sight measurements of GRBs and has been observed in other types of supernova (e.g. Borkowski et al. 2006), the cause of which is not known.
We measure a large amount of intrinsic absorption in some of the sample (Figure 4), and can state that absorption is insignificant in others, as seen for example in the contrast between GRBs 010222 and 990510. We have tested for the possibility that the Galactic column density in the GRB direction is affecting our intrinsic column derivations by plotting vs. , and found no correlation. We assumed therefore that all the measured absorption lies within the host galaxy. We note that a few of these afterglows have spectra: for GRB 990510 no intervening systems were clearly identified, an intervening system is measured at 168 km s-1 from the host redshift for 000926 (assumed to lie within the host galaxy, Castro et al. 2003), 2 intervening systems are found for GRB 010222 (Jha et al. 2001; Mirabal et al. 2002) and at the host redshift there are two components separated by 119 km s-1 (Mirabal et al. 2002). None of these intervening systems are close enough to us as the observer to significantly affect measurement of the intrinsic host extinction.
5.1 Approaches to measuring absorption in the host galaxies
In this study we provided a thorough, uniform study of both optical and X-ray extinction along the lines of sight towards a sample of 10 GRB afterglows. The well known spectral shape and relative brightness of the afterglow emission make GRB afterglows a powerful line-of-sight probe of high redshift extinction. This is one of several approaches to measuring absorption in GRB host galaxies. One can globally divide the studies of extinction in the field of GRBs in two categories: line-of-sight extinction studies and studies of extinction of the integrated host galaxy or parts thereof.
5.1.1 Line-of-sight studies
Line-of-sight studies generally involve fitting the afterglow spectral energy distributions in optical and/or X-rays with template extinction models (i.e. MW, LMC, SMC or more parametrized models) as we have done here. The standard conversions between X-ray extinction and optical extinction for the Milky Way and the two Magellanic Clouds are generally in disagreement with the column densities measured through this method, but these skewed gas-to-dust ratios are also being found in other astrophysical situations as discussed above for SNRs in the LMC, and the destruction of dust can go some way to alleviating the mismatch.
A further way to probe line-of-sight extinction properties is through optical spectroscopy of the afterglow. In this case the careful measurement of column densities of heavy elements can be used to study the dust depletion pattern along the line of sight (e.g. Savaglio & Fall 2004). The measured metal column densities in combination with the best-fitting depletion pattern and the empirically determined conversion between and the dust column, can provide a prediction of the dust extinction along the line of sight to a GRB (for a detailed explanation see e.g. Savaglio & Fall 2004). Savaglio & Fall (2004) show that the extinction derived from the dust depletion method is significantly higher than the value derived from direct fitting to the continuum of the afterglow spectrum, e.g. for GRB 020813 they find an overestimation by at least five times. We show that this conclusion holds when fitting the afterglow continuum emission over a much larger wavelength range and can quantify that overestimation factor for GRBs 990123, 000926 and 010222 as approximately , and times overestimated respectively. The reasons for this apparent discrepancy may be two-fold: firstly the fitted extinction profiles to the afterglow SED are likely poor approximations to the true extinction profile, and secondly the host dust depletion chemistry may well differ from the Milky Way chemistry. In addition, the GRB or afterglow may preferentially destroy small dust grains, skewing the extinction profile towards larger grains, resulting in a ”grey” extinction curve. This would alter the derived extinction from SED fitting, and possibly bring estimates from dust depletion methods and SED fitting closer together. Whist a grey extinction curve was the best fitting extinction curve to GRB 020405 (Stratta et al. 2005), we note that grey extinction curves have been fitted to samples of afterglow SEDs with no conclusive improvement in fit (e.g. Stratta et al. 2004).
5.1.2 Integrated host galaxy studies
One can also study the extinction properties of host galaxy as a whole, and there are again several methods to do this. Whilst it has been shown that GRBs occur in starforming regions in the host (Bloom et al. 2002; Fruchter et al. 2006), many host galaxies are small and mixing timescales may be short, enabling global properties to be measured. The host and afterglow have similar, moderate reddening in GRB 000418 (Gorosabel et al. 2003a) which is taken as evidence that the ISM is well mixed. But more extreme values of reddening are also seen, such as the extremely red afterglow and host of GRB 030115, in which the host is an Extremely Red Object (ERO, Levan et al. 2006).
One of the most common methods of integrated host galaxy studies is fitting of the broadband optical and near-infrared SEDs of the hosts themselves (e.g. Christensen et al. 2004). Galaxy templates can be fit to the data, using photometric redshift programmes such as HyperZ (Bolzonella et al. 2000) providing values for the photometric redshift, the age of the dominant stellar population and the extinction, by fitting a series of galaxy templates. The extinction measured this way is the extinction by the ISM of the galaxy on the stellar light, , in which the geometry of the dust in the galaxy can play an important role (e.g. dustlanes as opposed to an homogeneous dust distribution). A study of a large sample of hosts has been performed through HyperZ template fitting by Christensen et al. (2004), who find that GRB hosts generally exhibit little extinction, and have young stellar populations. The dependence on metallicity and assumed initial mass function is small (Gorosabel et al. 2003a,b; Christensen et al. 2004). One of the difficulties faced here is that the galaxies are often very faint.
5.1.3 Emission-line spectroscopy
In low redshift () cases, an optical spectrum of the host galaxy can be taken, typically showing several nebular and Balmer emission lines. The Balmer lines can be used to derive values for the reddening by calculating their deviation from case B recombination values expected in typical starforming region conditions (Osterbrock 1989). The derived reddening is the reddening of the ionized gas in the source, i.e. the dominant starforming region(s) producing the Balmer emission lines. In general the reddening found from the Balmer decrement is low (see e.g. Prochaska et al. 2004), to very low (Wiersema et al. 2006).
The two host galaxy extinction estimates and may be correlated for most galaxies (see Calzetti 2001 for a review). The increasing data volume on nearby GRB host galaxies will allow a test of these correlations, providing further insight into effective GRB host galaxy extinction curves.
On rare occasions it is possible to obtain high-resolution spectra of an afterglow that also shows host galaxy emission lines, allowing one to obtain a simultaneous view of the extinction along the line of sight and of the Balmer decrement. In the case of GRB 060218, both absorption lines and emission lines are detected at high resolution using the UVES spectrograph on the VLT (Wiersema et al. 2006). The spectrum shows asymmetric emission lines that are well fitted with two Gaussians separated by 22 km s-1. The same two velocity components can be seen in absorption in Ca II and Na I, and have different chemical properties. These two systems can be interpreted as two seperate starforming regions, through which the light of the afterglow shines. A broadband measure of the extinction either from the afterglow or from template fitting of the host would not have been able to seperate out the contributions of the two individual systems.
5.1.4 The longer wavelengths
Yet another way to detect the presence of dust, is the detection of GRB host galaxies in the far-infrared or sub-mm (see e.g. Barnard et al. 2003; Tanvir et al. 2004), where the UV radiation from massive stars is reprocessed by dust and reradiated in the far infrared. Detection of hosts in the far infrared as well as optical can severely constrain their SED (Le Floc’h et al. 2006), providing estimates for the unobscured star formation rate of GRB hosts. In a few cases values up to hundreds of solar masses per year have been reported, while optical indicators give much lower values, indicating a lot of dust-obscured star formation. A different probe of unobscured star formation is the radio continuum flux, which is thought to be formed by synchrotron emission from accelerated electrons in supernova remnants and by free-free emission from H II regions (Condon 1992). Berger et al. (2003) performed a survey of host galaxies at radio and sub-mm wavelengths, finding that a significant fraction of GRB host galaxies have a much higher radio-derived star formation rate than optical methods indicate, pointing again to significant dust extincted star formation but based on only a few detections.
5.1.5 Our method compared
All methods considered, SED fitting of the afterglow as described and carried out in this paper is the most broadband view of line-of-sight properties. Given the very well known underlying continuum shape, the extinction curve can in principle be extremely well modelled using this method. As discussed in Section 1, the effects of dust extinction in the optical are better measured at higher redshifts whereas the X-ray absorption is best measured at lower redshifts, so this method is most reliable for some middle range of redshifts centred around which approximately corresponds to the current Swift median redshift (e.g. Jakobsson et al. 2006b). As with any line-of-sight method, the measured columns may not be representative of the host galaxy as a whole, so comparison with the integrated host galaxy methods is important. The general drawbacks of this method lie in the inability to disentangle the locations of absorbers, both intervening (between us and the host) and within the host itself. Intervening absorbers may be identified using afterglow spectroscopy (Ellison et al. 2006). Distribution of absorbers within the host may be tackled from the point of view of searches for variability in the absorption which may indicate destruction of dust or ionisation by the GRB and/or afterglow, and comparison of the measured columns with known absorbers such as Molecular clouds. Campana et al. (2006a) find that the X-ray absorptions of 17 bursts (including most of this sample) are consistent with the GRBs lying along random sightlines towards Galactic-like Molecular clouds. Our sample is too small to make such a statistical comparison, but we note that the Campana et al. sample includes the results of the Stratta et al. (2004) study of the GRBs presented here for which we obtain largely consistent extinction values.
Dust destruction is of course impossible to measure in a single SED, but may be seen with multiple epochs of data. Destruction of grains by for example the afterglow UV/X-ray emission would in principle be observable, because depletion indicative line ratios would vary on observable timescales as metals are released from grains into the ISM. Variable line emission has been searched for in afterglows with multiple optical spectra and has been seen in only two cases, GRB 020813, in which the Fe II 2396 transition equivalent widths decreases by at least a factor of five over 16 hours (Dessauges-Zavadsky et al. 2006) and GRB 060418 in which several transitions of Fe II and Ni II are seen to vary in observations covering 11 to 71 minutes post-burst (Vreeswijk et al. 2006). This line emission is thought to arise at 50-100 pc from the GRB site, possibly within range of the GRB ionising flux. A variable has only been suggested for GRB 980703 (described in Section 4.1.6). There is evidence for time variable X-ray absorption in a small number of GRBs ranging from tentative to moderately strong, in particular for GRBs 011121 (Piro et al. 2005), 050730 (Starling et al. 2005) and 050904 (Boër et al. 2006; Campana et al. 2006b; Gendre et al. 2006) and 060729 (Grupe et al. 2006). This implies ionisation of the line-of-sight gas, probably by the high energy GRB jet (though we note that column density changes and early-time spectral evolution can have similar effects on the spectrum).
Dust destruction can, however, only affect the immediate environment around a burst, (perhaps out to 10 pc, Waxman & Draine 2000), and not all the dust in that region need be destroyed since this depends on the efficiency of the mechanism and on the dust grain size distribution. Kann et al. (2006) noted a possible tentative correlation between and star formation rate as measured via host galaxy emission in the sub-mm (for a sample of 7 GRBs). If this turns out to hold when tested against larger samples it would demonstrate that a substantial amount of the dust we see comes from star forming regions located throughout the whole host galaxy rather than very close to the burst where it could be destroyed. However, this correlation is unlikely to be real given the very low resolution of the sub-mm observations which make it difficult to differentiate between host galaxy emission and field galaxy emission. This differentiation can be made with Spitzer and lower star formation rates in comparison with the sub-mm derived values have been found for some hosts including those of GRBs 980703 and 010222 (Le Floc’h et al. 2006).

6 Conclusions
Here we have demonstrated the advantages of simultaneous fitting of broadband data using a subsample of BeppoSAX GRB afterglows. In no cases is a MW-like extinction preferred, when testing MW, LMC and SMC extinction laws. The 2175Å bump would in principle be detectable in all these afterglows, but is not present in these data. An SMC-like gas-to-dust ratio (or lower value) can be ruled out for 4 of the hosts analysed here (assuming SMC metallicity and extinction law) whilst the remainder of the sample have too large an error to discriminate.
We discuss the various methods employed to derive host galaxy extinctions, and compare our results with previous works. We find that this method provides similar central values of and to previous works in which extinction or absorption is determined through afterglow continuum fitting, and in the majority of cases we obtain tighter constraints. We confirm that, with respect to continuum fitting methods such as this, optical extinction is overestimated with the depletion pattern method, and quantify this for a small number of cases.
Swift, robotic telescopes and Rapid Response Mode on large telescopes such as the William Herschel Telescope on La Palma and the Very Large Telescopes in Chile now allow earlier and higher quality data to be obtained, which will help immensely in discriminating between the different extinction laws at work in the host galaxies.
References
- Arnaud et al. (1996) Arnaud K. et al., 1996, ASPC 101, 17
- Barnard et al. (2003) Barnard V. E. et al., 2003, MNRAS, 338,1
- Berger et al. (2003) Berger E. et al. 2003, ApJ, 588, 99
- Bloom et al. (1998b) Bloom J. S. et al. 1998b, ApJ, 508, L21
- Bloom et al. (2001) Bloom J. S., Djorgovski S. G., Kulkarni S. R., 2001, ApJ, 554, 678
- Bloom et al. (1998a) Bloom J. S., Djorgovski S. G., Kulkarni S. R., Frail D. A., 1998a, ApJ, 507, L25
- Bloom et al. (2002) Bloom J. S., Kulkarni S. R., Djorgovski S. G., 2002, AJ, 123, 1111
- Blustin et al. (2006) Blustin A. J. et al., 2006, ApJ, 637, 901
- Boër et al. (2006) Boër M., Atteia J. L., Damerdji Y., Gendre B., Klotz A., Stratta G., 2006, ApJ, 638, L71
- Bolzonella et al. (2000) Bolzonella M., Miralles J.-M., Pello R., 2000, A&A, 363, 476
- Borkowski et al. (2006) Borkowski K. J. et al., 2006, ApJ, 642, L141
- Calzetti (2001) Calzetti D., 2001, New Astron. Rev., 45, 601
- Calzetti et al. (1994) Calzetti D., Kinney A.L., Storchi-Bergmann T., 1994, ApJ, 429, 582
- Campana et al. (2006a) Campana S. et al., 2006, A&A, 449, 61
- Campana et al. (2006b) Campana S. et al., 2006, ApJ Letters, in press
- Cardelli et al. (1989) Cardelli J. A., Clayton G. C., Mathis J. S., 1989, ApJ, 345, 245
- Castro et al. (2003) Castro S., Galama T. J., Harrison F. A., Holtzman J. A., Bloom J. S., Djorgovski S. G., Kulkarni S. R., 2003, ApJ, 586, 128
- Castro-Tirado et al. (1999) Castro-Tirado A. J. et al., 1999, ApJ, 511, L85
- Chary et al. (1998) Chary R. et al., 1998, ApJ, 498, L9
- Chary et al. (2002) Chary R., Becklin E. E., Armus L. 2002, ApJ, 566, 229
- Chen et al. (2005) Chen H.-W., Prochaska J. X., Bloom J. S., Thompson I. B., 2005, ApJ, 634, L25
- Christensen et al. (2004) Christensen L., Hjorth J., Gorosabel J., 2004, A&A, 425, 913
- Condon (1992) Condon J. J., 1992, ARA&A, 30, 575
- Corsi et al. (2005) Corsi A. et al., 2005, A&A, 438, 829
- Cowsik et al. (2001) Cowsik R., Prabhu T. P., Anupama G. C., Bhatt B. C., Sahu D. K., Ambika S., Padmakar, Bhargavi S. G., 2001, BASI, 29, 157
- Dessauges-Zavadsky et al. (2006) Dessauges-Zavadsky M., Chen H.-W., Prochaska J. X., Bloom J. S., Barth A. J., 2006, ApJL, submitted
- Dickey & Lockman (1990) Dickey J. M. & Lockman F. J., 1990, ARA&A, 28, 215
- Diercks et al. (1997) Diercks A. et al., 1997, IAU Circular 6791
- Diplas & Savage (1994) Diplas, A., Savage, B. D., 1994, ApJ, 427, 274
- Draine & Lee (1984) Draine B. T., Lee H. M., 1984, ApJ, 285, 89
- Draine & Salpeter (1979) Draine B. T., Salpeter E. E., 1979, ApJ, 231, 438
- Djorgovski et al. (1998) Djorgovski S. G., Kulkarni S. R., Bloom J. S., Goodrich R., Frail D. A., Piro L., Palazzi E., 1998, ApJ, 508, L17
- Ellison et al. (2006) Ellison S. L. et al., 2006, MNRAS, 372, L38
- Fitzpatrick (1985) Fitzpatrick E. L., 1985, ApJ, 299, 219
- Fruchter et al. (1999) Fruchter A. S. et al., 1999, ApJ, 519, L13
- Fruchter et al. (2006) Fruchter A. S. et al., 2006, Nature, 441, 463
- Fruchter et al. (2001) Fruchter A. S., Krolik J. H., Rhoads J. E., 2001, ApJ, 563, 597
- Fukugita et al. (1995) Fukugita M., Shimasaku K., Ichikawa T., 1995, PASP 107, 945
- Fynbo et al. (2001) Fynbo J. P. U. et al., 2001, A&A, 373, 796
- Fynbo et al. (2006) Fynbo J. P. U. et al., 2006, A&A, 451, L47
- Galama et al. (1998a) Galama T. J. et al., 1998a, Nature, 395, 670
- Galama et al. (1998b) Galama T. J. et al., 1998b, ApJ, 497, L13
- Galama et al. (1999) Galama T. J. et al., 1999, Nature, 398, 394
- Galama et al. (2000) Galama T. J. et al., 2000, ApJ, 536, 185
- Galama & Wijers (2001) Galama T. J., Wijers R. A. M. J., 2001, ApJ, 549, L209
- Gendre & Boër (2005) Gendre B., Boër M., 2005, A&A, 430, 465
- Gendre et al. (2006) Gendre B., Galli A., Corsi A., Klotz A., Piro L., Stratta G., Boër M., Damerdji Y., 2006, A&A, in press
- Gorosabel et al. (2003a) Gorosabel J. et al., 2003a, A&A, 409, 123
- Gorosabel et al. (2003b) Gorosabel J. et al., 2003b, A&A, 400, 127
- Grupe et al. (2006) Grupe D. et al., 2006, ApJ, submitted, astro-ph/0611240
- Halpern et al. (1998) Halpern J. et al., 1998, Nature, 393, 41
- Harrison et al. (2001) Harrison F. A. et al., 2001, ApJ, 559, 123
- Hjorth et al. (2003) Hjorth J. et al., 2003, ApJ, 597, 699
- Holland et al. (2001) Holland S. et al., 2001, A&A, 371, 52
- Houck & Denicola (2000) Houck J. C., Denicola L. A., 2000, ASPC, 216, 591
- in ’t Zand et al. (1998) in ’t Zand J. J. M. et al., 1998, ApJ, 505, L119
- Jakobsson et al. (2006b) Jakobsson P. et al., 2006, A&A, 447, 897
- Jakobsson et al. (2006a) Jakobsson P. et al., 2006, A&ALetters, in press
- Jaunsen et al. (2001) Jaunsen A. O. et al., 2001, ApJ, 546, 127
- Jensen et al. (2001) Jensen, B. L. et al., 2001, A&A, 370, 909
- Jha et al. (2001) Jha S. et al., 2001, ApJ, 554, L155
- Jones (2004) Jones A. P., 2004, Astrophysics of Dust, Eds. A.N. Witt, C.C. Clayton and B.T. Draine, ASP Conference Series, 309, 347
- Kalberla et al. (2005) Kalberla P. M. W., Burton W. B., Hartmann D., Arnal E. M., Bajaja E., Morras R., Poppel W. G. L., 2005, A&A, 440, 775
- Kaneko et al. (2006) Kaneko Y. et al., 2006, ApJ, in press
- Kann et al. (2006) Kann D. A., Klose S., Zeh A., 2006, ApJ, 641, 993
- Kawai et al. (2006) Kawai N. et al., 2006, Nature, 440, 184
- Kawai et al. (2005) Kawai N., Yamada T., Kosugi G., Hattori T., Aoki K., 2005, GCN Circular 3937
- Koornneef (1982) Koornneef J., 1982, A&A, 107, 247
- Kulkarni et al. (1999a) Kulkarni S. R. et al., 1999a, Nature, 398, 389
- Kulkarni et al. (1999b) Kulkarni S. R. et al., 1999b, ApJ, 522, L97
- Kuulkers et al. (2000) Kuulkers E. et al., 2000, ApJ, 538, 638
- Le Floc’h et al. (2006) Le Floc’h, E., Charmandaris, V., Forrest, W.J., 2006, ApJ, 642, 636
- Le Floc’h et al. (2003) Le Floc’h, E., Duc, P.-A., Mirabel, I.-F., 2003, A&A, 400, 499
- Lee et al. (2001) Lee B. C. et al., 2001, ApJ, 561, 183
- Levan et al. (2006) Levan A. et al., 2006, ApJ, 647, 471
- Madau (1995) Madau P., 1995, ApJ, 441
- Madau et al. (1996) Madau P. et al., 1996, MNRAS, 283
- Maiorano et al. (2005) Maiorano E. et al., 2005, A&A, 438, 821
- Martin et al. (1989) Martin N., Maurice E., Lequeux J., 1989, A&A, 215, 219
- Masetti et al. (2001) Masetti N. et al., 2001, A&A, 374, 382
- Meurer et al. (1999) Meurer G. R., Heckman T. M., Calzetti D., 1999, ApJ, 521, 64
- Mirabal et al. (2002) Mirabal N. et al., 2002, ApJ, 578, 818
- Nicastro et al. (1999) Nicastro L. et al., 1999, A&AS, 138, 437
- Nousek et al. (2006) Nousek J. A. et al., 2006, ApJ, 642, 389
- Osterbrock (1989) Osterbrock D. E., 1989, Astrophysics of Gaseous Nebulae and Active Galactic Nuclei (Mill Valley: University Science Books)
- Panaitescu & Kumar (2002) Panaitescu A., Kumar P., 2002, ApJ, 571, 779
- Pei (1992) Pei Y. C., 1992, ApJ, 395, 130
- Perna & Lazzatti (2002) Perna R., Lazzatti D., 2002, ApJ, 580, 261
- Perna et al. (2003) Perna R., Lazzatti D., Fiore F., 2003, ApJ, 585, 775
- Pettini et al. (1998) Pettini M., Kellogg M., Steidel C., Dickinson M., Adelberger K. L., Giavalisco M., 1998, ApJ, 508, 539
- Pian et al. (2001) Pian E. et al., 2001, A&A, 372, 456
- Piro et al. (2005) Piro L. et al., 2005, ApJ, 623, 314
- Predehl & Schmitt (1995) Predehl P., Schmitt J. H. M. M., 1995, A&A, 293, 889
- Price et al. (2001) Price P. A., Harrison F. A., Galama T. J., 2001, ApJ, 549, L7
- Prochaska (2006) Prochaska J. X., 2006, ApJ, in press, astro-ph/0606500
- Prochaska et al. (2004) Prochaska J. X. et al., 2004, ApJ, 611, 200
- Ramaprakash et al. (1998) Ramaprakash A. N. et al., 1998, Nature, 393, 43
- Reichart et al. (1999) Reichart D. E. et al., 1999, ApJ, 517, 692
- Savaglio & Fall (2004) Savaglio S., Fall S. M., 2004, ApJ, 614, 293
- Savaglio et al. (2003) Savaglio S., Fall S. M., Fiore F., 2003, ApJ, 585, 638
- Schlegel et al. (1998) Schlegel D. J., Finkbeiner D. P., Davis M., 1998, ApJ, 500, 525
- Stanek et al. (1999) Stanek K. Z., Garnavich P. M., Kaluzny J., Pych W., Thomson I., 1999, ApJ, 522, L39
- Starling et al. (2005) Starling R. L. C. et al., 2005, A&A, 442, L21
- Stratta et al. (2004) Stratta G., Fiore F., Antonelli L. A., Piro L., De Pasquale M., 2004, ApJ, 608, 846
- Stratta et al. (2005) Stratta G., Perna R., Lazzatti D., Fiore F., Antonelli L. A., Conciatore M. L., 2005, A&A, 441, 83
- Tanvir et al. (1997) Tanvir N. et al., 1997, IAU Circular 6796
- Tanvir et al. (2004) Tanvir N. R. et al., 2004, MNRAS, 352, 1073
- Tinney et al. (1998) Tinney C. et al., 1998, IAU Circular 6896.1
- Vreeswijk et al. (1999) Vreeswijk P. M. et al., 1999, ApJ, 523, 171
- Vreeswijk et al. (2001) Vreeswijk P. M. et al., 2001, ApJ, 546, 672
- Vreeswijk et al. (2004) Vreeswijk P. M. et al., 2004, A&A, 419, 927
- Vreeswijk et al. (2006) Vreeswijk P. M. et al., 2006, A&A, submitted, astro-ph/0611690
- Watson et al. (2006) Watson D. et al., 2006, ApJ, in press
- Watson et al. (2002) Watson D., Reeves J. N., Osborne J. P., Tedds J. A., O’Brien P. T., Tomas L., Ehle M., 2002, A&A, 395, L41
- Waxman & Draine (2000) Waxman E., Draine B. T., 2000, ApJ, 537, 796
- Wiersema et al. (2006) Wiersema K. et al., 2006, A&A, submitted
- Wijers & Galama (1999) Wijers R. A. M. J., Galama T. J., 1999, ApJ, 523, 177
- Williams et al. (2006) Williams B. J. et al., 2006, ApJ, submitted (astro-ph/0610166)
- Wilms et al. (2000) Wilms J., Allen A., McCray R., 2000, ApJ, 542, 914
- Woosley & Bloom (2006) Woosley S. E., Bloom J. S., 2006, ARA&A, 44, 507
- Yost et al. (2002) Yost S. A. et al., 2002, ApJ, 577, 155
- Zeh et al. (2006) Zeh A., Klose S., Kann D. A., 2006, ApJ, 637, 889