Galaxy Evolution through Infrared Surveys: from Spitzer to Herschel
Abstract
The Spitzer Space Telescope is devoting a significant fraction of the observing time to multi-wavelength cosmological surveys of different depths in various low-background sky regions. Several tens of thousand mid-IR galaxies have been detected over a wide interval of redshifts. A progressively clearer picture of galaxy evolution is emerging, which emphasizes populations of luminous galaxies at , likely corresponding to the main phases of stellar formation and galaxy assembly. These results are entirely consistent with previous outcomes from ISO, SCUBA and COBE observations, and provide valuable constraints of high statistical and photometric precision. We briefly report here on our attempt to extract from statistical data some general properties of galaxy evolution and describe evidence that a population of very luminous objects at share different properties from those of starbursts at lower redshifts, indicating some seemingly anti-hierarchical behavior of galaxy evolution in the IR. We warn, however, that these results are based on large, still uncertain, extrapolations of the observed mid-IR to bolometric fluxes, for measuring which the forthcoming far-IR and submillimetre Herschel Space Observatory will be needed. We finally comment, based on our present understanding, about Herschel capabilities for investigating the early phases of galaxy evolution.
1Astronomy Department, Vicolo Osservatorio 2, I-35122 Padova, Italy
2University of California San Diego, La Jolla, CA 92093-0424, USA
1. Introduction
The interest of long wavelength observations for cosmological studies was raised 20 years ago by the IRAS mission, showing the most luminous local galaxies to emit the bulk of their radiant energy in the far-IR due to dust reprocessing (e.g. Soifer et al. 1988; Sanders et al. 1988). Ten years later the ISO mission has found first evidence for strong evolution of dust-enshrouded starbursts between and (Franceschini et al. 2001; Elbaz et al. 2002; Genzel & Cesarsky 2003). Together with parallel findings in the sub-mm with SCUBA (e.g. Blain et al. 2002) and with COBE (Hauser et al. 1998), these results have established the relevance of long wavelength studies for our understanding of galaxy formation (Franceschini et al. 2003; Baugh et al. 2005): a major fraction of the emission by the most massive, luminous and short-lived stars, when they are still embedded inside their parent dusty molecular clouds, is optically extinguished and reprocessed at IR to sub-mm wavelengths.
With the advent of the Spitzer Space Telescope, the exploration of the distant universe at IR wavelengths has become possible with similar sensitivities and spatial (to some extent also spectral) resolutions typical of optical searches with large ground-based telescopes. Spitzer exploits a battery of sensitive detectors from to 70 m (Rieke et al. 2004), while its performance at longer wavelengths is limited by telescope diffraction. The 24 m band of the MIPS imager, in particular, detects the 8 m PAH bundle emission to for the first time. Thanks to all this, the observatory has identified large samples of star-forming galaxies and IR-emitting active galactic nuclei over wide redshift intervals (Perez-Gonzales et al. 2005; Le Floc h et al. 2005; Rowan-Robinson et al. 2005; Caputi et al. 2006; Babbedge et al. 2006; Dole et al. 2006).
Early attempts to constrain galaxy evolution based on Spitzer observations have made use of the identifications of large samples of faint 24 m sources with Spitzer IRAC near-IR data, allowing a good characterization of the galaxy SED and photometric redshifts. In particular, a 0.6 region of the CDFS was observed at 24 m by Le Floc’h et al. (2005) and a sample of 2600 galaxies brighter than 80 was combined with existing optical (COMBO17) data in the field and used to derive bolometric IR luminosity functions and SFR’s from z=0 to . These results imply a comoving IR energy density in the Universe to evolve proportionally to to . From MIPS 24 m observations of the CDFS and HDFN, combined with a systematic photometric redshift analysis using the Spitzer IRAC data, Perez-Gonzales et al. (2005) derived estimates of the redshift-dependent galaxy luminosity functions and found that the SFR density remains roughly constant above .
We will follow a different approach in the next Sects., based on the analysis of statistical data, whose integral nature is less subject to the uncertainties in the photometric redshifts estimates.
2. Statistical Observables…
Galaxy number counts in the most sensitive Spitzer MIPS 24 m channel have been estimated by various teams with surveys at different depths. Based on data from the SWIRE survey (Lonsdale et al. 2004, Rowan-Robinson, these Proceedings), Shupe et al. (2006) have found quite significant field-to-field variations (up to a factor of 2) at bright fluxes due to local structure. Averaged over the large areas covered by SWIRE, the differential counts show a sharply non-Euclidean behavior as in Figure 1. Counts at deeper flux levels (wider cosmic volumes) in smaller fields from Papovich et al (2004) and Chary et al (2004) reveal a very fast convergence. At 70 m the bright galaxy counts are from SWIRE (Afonso-Luis et al. 2006), while the deeper ones from Frayer et al. (2006; Fig. 1 right panel), and similarly for the 160 m data.
Another critical constraint is offered by the observed redshift distributions from complete 24 m galaxy samples. Earlier estimates were reported by Perez-Gonzalez et al. and Caputi et al. (2005), based on a sample in CDFS flux-limited to 83 Jy. We report in Figure 2 a reassessment of the z-distribution for galaxies brighter than 100 Jy in the CDFS GOODS area (see http://data.spitzer.caltech.edu/popular/goods), including some new spectroscopic redshifts and our own estimate of photometric redshifts. As previously mentioned in Caputi et al., the observed distribution (broken continuous line) reveals a bimodality, likely due to the effect of strong PAH emission features in the typical source SEDs convolved with the MIPS channel transmission function.
Additional relevant data further constraining galaxy evolution come from the SCUBA number counts and redshift distributions, from the COBE background intensity and from the IRAS local luminosity functions, among others.
3. … and Model Analyses
This large dataset poses a serious challenge to any attempts to explain it with simple evolutionary prescriptions. Previous models (Franceschini et al. 2001; Xu et al. 2004; Pozzi et al. 2004) have tried to fit the ISO and IRAS data by combining the contributions of moderately-evolving local spirals with that of a fast evolving population of dusty starbursts, with evolution rates independent of luminosity.
We have found that this minimal scheme is ruled out by the combination of the Spitzer 24 m and SCUBA data. The extremely narrow peak at fluxes of 0.3 mJy in the galaxy differential counts (Fig.1) requires a population of moderately luminous starbursts with maximum comoving IR emissivity around and a fast decline at higher-z. Such evolutionary rate is illustrated as the cyan line in the right panel of Fig.2, where the bolometric emissivity is expressed in equivalent SFR density. Contributions to the various statistics by this class of sources are reported as cyan lines in Figs.1 and 2.
The fast decrease of this population at implies that these objects cannot explain the secondary peak at in the redshift distribution of 24 m sources and are essentially unrelated with the high-z sub-millimetric SCUBA population. An additional component of very high luminosity starburst galaxies (ULIRGs), very rare locally but numerous and dominating the emissivity at , is then required (red dashed lines in Fig.1 and 2).
Altogether, the combined set of IR data reveal clear evidence for down-sizing in galaxy evolution: the high luminosity starburst population (Fig.2 right) evolved faster at decreasing redshift and was active at earlier cosmic times, , compared to the lower-luminosity objects forming stars for a more prolonged time and whose main evolutionary phases peak around . This evidence based on IR data (see also Caputi et al. 2006) agrees with a variety of independent analyses (e.g. Cowie et al. 1996), and is particularly strong because of the constraint imposed by the spectral intensity of the far-IR background.
4. The Herschel Perspective
Our results on galaxy evolution, as summarized in the right panel of Fig.2, are based on large extrapolations of the observed mid-IR (and sub-mm) to bolometric fluxes. In spite of some efforts to calibrate these relations (e.g. Elbaz et al. 2002), they are still subject to large uncertainties.
A major progress is then expected from the forthcoming far-IR and sub-millimetric Herschel Space Observatory mission that, thanks to the substantial improvement in telescope size and to the correspondingly lower confusion noise, will allow us to obtain extensive characterization of the IR to sub-mm SEDs of large samples of high-z galaxies. The programs for cosmological surveys in the PACS and SPIRE instrument Guaranteed Times are discussed by Griffin and Poglitsch (these Proceedings). We exploit here our multi-wavelength IR model to predict some of the outcomes of such observations.
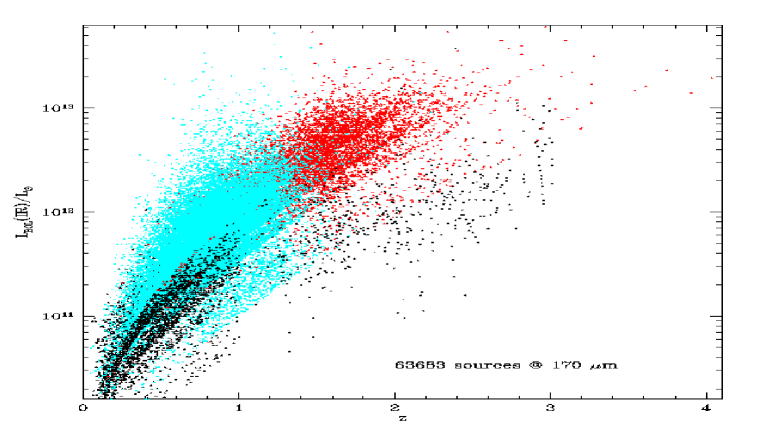
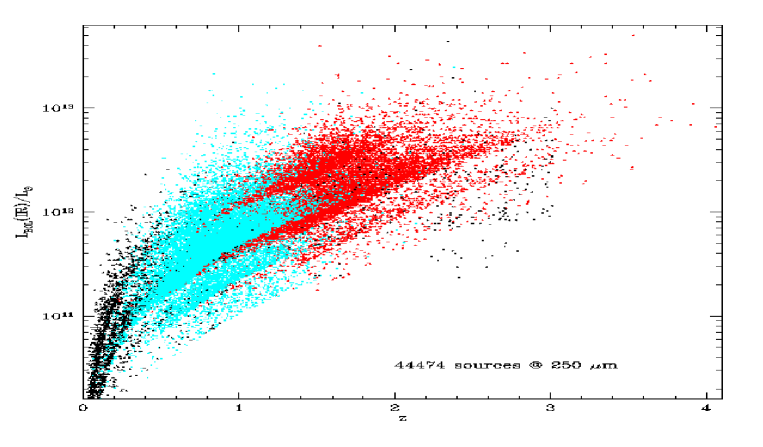
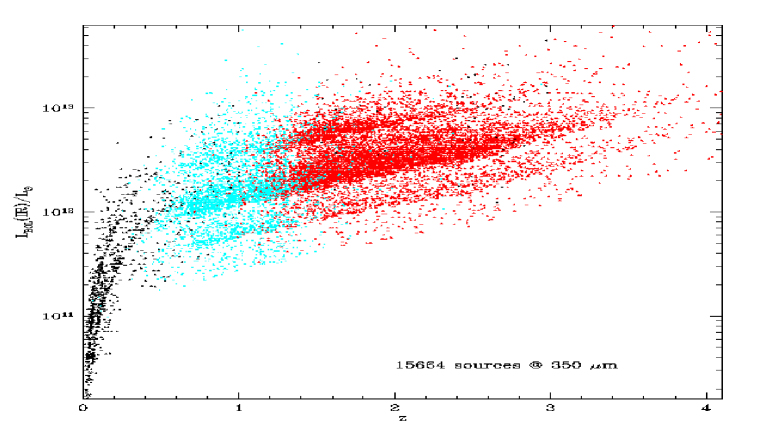
Figures 3, 4 and 5 illustrate the expected bolometric luminosity vs. redshift plots of surveys in various areas to different depths performed at 170, 250, and 350 m. The apparent stripes correspond to different areas and sensitivity limits of the GT survey program, and the effects of K-correction are also evident in decreasing the slope of the L/z correlation at increasing wavelengths. In conclusion, already within the GT program, the Herschel mission will ensure wide coverage of the galaxy far-IR luminosity functions at and an excellent characterization of the high luminousity end at higher-.
References
- (1) Afonso-Luis, et al., 2006, in preparation
- (2) Babbedge, T.S.R., et al., 2006, MNRAS 370, 1159
- (3) Baugh, C. M., Lacey, C. G., Frenk, C. S., et al, 2005 MNRAS 356, 1191
- (4) Blain, A.W., et al., 2002, Physics Reports 369, Issue 2, 111
- (5) Caputi et al. 2006, ApJ 637, 727
- (6) Chary, R., et al., 2004, ApJS, 154, 80
- (7) Dole, H., et al., 2006, A&A 451, 417
- (8) Elbaz, D., et al., 2002, A&A, 384, 848
- (9) Franceschini, A., et al., 2001, A&A, 378, 1
- (10) Franceschini, A., et al., 2003, A&A, 403, 501
- (11) Frayer, D. T., et al., 2006, ApJ 647, L9
- (12) Genzel, R. & Cesarsky, C.J., 2000, ARAA 38, 761
- (13) Hauser, M.G., et al., 1998, ApJ 508, 25
- (14) Le Floc’h, E., 2005, ApJ 632, 169L
- (15) Lonsdale, C., et al., 2004, ApJS 154, 54
- (16) Papovich C., Dole H., Egami E., 2004, ApJS, 154, 70
- (17) Perez-Gonzales, P., et al., 2005, ApJ 630., 82
- (18) Pozzi, F., et al., 2004, ApJ 609, 122
- (19) Rieke, G. H., Young, E. T., Engelbracht, C. W., et al., 2004, ApJS 154 25
- (20) Rowan-Robinson, M., et al., 2005, 2005, AJ 129, 1183
- (21) Shupe, D., et al., 2006, ApJ in press
- (22) Sanders, D.B., 1988, ApJ 325, 74
- (23) Soifer, B.T., Neugebauer, G., Houck, J. R., 1987, ARA&A 25, 187
- (24) Xu, C.K., et al., 2003, ApJ 587, 90