Beyond the Cool Core: The Formation of Cool Core Galaxy Clusters
1 Abstract
Why do some clusters have cool cores while others do not? In this paper, cosmological simulations, including radiative cooling and heating, are used to examine the formation and evolution of cool core (CC) and non-cool core (NCC) clusters. Numerical CC clusters at accreted mass more slowly over time and grew enhanced cool cores via hierarchical mergers; when late major mergers occurred, the CC s survived the collisions. By contrast, NCC clusters of similar mass experienced major mergers early in their evolution that destroyed embryonic cool cores and produced conditions that prevent CC re-formation. We discuss observational consequences.
2 Introduction
Recently, 49% of clusters were identified as having cool cores in a flux-limited sample, HIFLUGCS, based upon ROSAT and ASCA observations [1]. The earliest and simplest model assumed these clusters to be spherical, isolated systems where “cooling flows” formed; as radiating gas loses pressure support, cooling gas flows inwards to higher density values which further accelerates the cooling rate (e.g., [2]). However, the predicted end-products of this mass infall (e.g., star formation, HI, CO) have not been observed and the central temperatures indicate that the gas at the cores has cooled only moderately (generally only 30-40% of the virial temperature [3]). Furthermore, this model failed to consider the important effects of mergers and on-going mass accretion from the surrounding supercluster environment.
We have performed numerical simulations of the formation and evolution of clusters in a cosmological context using the adaptive mesh refinement N-body/hydro code Enzo, aimed at further understanding cool cores [4]. We find that most mergers are oblique with halos spiraling into the cluster center and gently bequeathing cool gas; this allows the cool core to strengthen over time. Thus, in this model, cool cores themselves grow hierarchically via the merger/accretion process. Also, a realistic model of cool cores must involve heating, as well as cooling, that “softens” the cores (i.e., reduces density and increases temperature) potentially by star formation or by AGNs. This softening would increase the susceptibility of disruption of the cool core by subsequent mergers.
In this paper, we present new enhanced-physics Enzo cosmology simulations that include radiative cooling, star formation (i.e., a mass sink for cold gas), and heating (modeled via kinetic energy input from Type II supernovae). In addition to the more realistic baryonic physics, these simulations are superior to previous numerical models (e.g., [5, 6]) due to their bigger volumes and larger samples of clusters. With hundreds of clusters of mass , we have the capability for the first time to examine evolutionary effects in these numerical clusters with adequate statistics.
3 The Formation of CC and NCC Clusters
Enzo is an adaptive mesh refinement cosmological simulation code that couples an N-body particle-mesh (PM) solver with an Eulerian block-structured AMR method for ideal gas dynamics. Enzo has physics modules which model radiative cooling of both primordial and metal-enriched gases, and prescriptions for star formation and feedback [7].
Our AMR simulations have produced a sample of 1494 numerical clusters with and . Only 10% of this sample of numerical clusters have cool cores. This fraction is smaller than observed. We believe that our specific recipe for star formation and heating has over-softened the cores making them too vulnerable to disruption. This will be addressed in subsequent simulations.
In Figure 1, we show examples of the evolution of a CC and an NCC cluster which represent well the general scenarios for how such clusters form. This figure illustrates the different histories of two clusters which have the same final mass at , .


Many clusters start off with cool cores early in their history when initial conditions produce central densities and temperatures that allow the gas to radiatively cool. Depending upon the sequence and magnitude of cluster collisions, cool cores will be destroyed in some clusters and preserved in others. NCC clusters often undergo major mergers early in their history. From z=0.65 to z=0.5, the mass of the NCC cluster in Fig. 1 increased by 110%. Such mergers destroy the cool cores, leaving behind hotter, thermalized, moderately dense cores. Subsequently, cool halos infalling into these NCC clusters do not survive passage through the central parts of the clusters and the central conditions do not allow cool cores to re-establish. NCC clusters continue to experience minor mergers as they continue to slowly evolve (typically mass increases 10-20% over Gyr time frames). We suggest that such an early major merger produced the complex characteristics observed today for the Coma cluster.
On the other hand, Figure 1 suggests that CC clusters evolve differently. Many CC clusters do not experience major mergers early in their history but rather grow slowly such that the cool cores increase in mass and stability. The CC cluster at z=0.65 began with a higher mass than the NCC at the same redshift. From z=0.65 to z=0.1, mergers increased the mass of the CC cluster by only 20%. At , substantial multiple mergers occurred increasing the mass by 50% by z=0. But by this epoch, the cool core is so well established that it survives ever larger impacts. In fact, the cool gas from the infalling halos near the present epoch merges with the cool core such that it continues to grow.
4 Consequences of Evolutionary Differences in CC and NCC Clusters
The large-scale X-ray surface brightness profiles () of our simulated NCC clusters have distributions which fit very well to -models () out to the cluster virial radius as we recently described [8]. This is not true for CC clusters in our samples. As detailed in [8], the -model does a poor job of extrapolating the surface brightness from to (subscripts refer to overdensities relative to critical density; ) for CC clusters. The CC cluster profile has a typically 35% steeper slope than the -model in the outer part of the cluster. We view this as a further signature of recent merger activity. The result is a bias or overestimate of the density profile, leading to a significant overestimate in mass.

These results are typical for CC clusters in our sample. We have fit -models to the synthetic X-ray surface brightness profiles for all the numerical clusters with and (800 clusters). The fits excluded the core regions with kpc and extended out to to mimic what is typically available for X-ray observations. We then extrapolated the fit out to and calculated the reduced between the -model and the actual profile for the numerical clusters. A histogram of the cumlative fraction of the distribution for NCC and CC clusters is presented in Figure 2. There is a significant difference between the quality of the -model fits between these two types of clusters. Nearly 90% of the NCC clusters have reduced whereas only 60% of CC clusters have values . This results in a mass overestimate or bias of typically a factor of 3-5 for CC clusters. Thus, there is a breakdown in the assumptions of a single -model (i.e., dynamical equilibrium as assumed in simple cooling flow model) even outside the core for CC clusters. Similar results for a sample of cool core clusters observed by Chandra have been found [9].
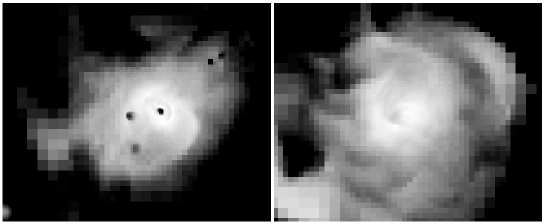
Our numerical CC clusters also generally show a higher incidence of cold substructure outside the core than do their NCC counterparts when measured relative to the virial temperatures. The lower temperature gas is composed of both compact infalling halos as well as diffuse cool gas. We predict that this signature will be apparent in hardness ratio maps. As shown in Fig. 3 for two typical cases drawn from our simulations, the hard-to-soft band ratios (2-8 keV/0.7-2 keV) illustrate the abundance of cooler gas beyond the cores in CC clusters. We find that this prediction agrees well with the hardness ratio distribution of several Abell clusters observed by Chandra.

5 Conclusions
Our cosmological numerical simulations suggest that
-
•
Non-cool core (NCC) clusters suffer early major mergers when embryonic cool cores are destroyed. Cool core (CC) clusters, on the other hand, grow more slowly without early major mergers.
-
•
The X-ray surface brightness profiles for NCC clusters are well fit by single -models whereas the outer emission for CC clusters is biased low compared to -models. The resulting densities and masses of CC clusters estimated from single -model extrapolations are biased high by factors of 3-5.
-
•
CC clusters have more cool gas beyond the cores than do NCC clusters, reflected in hardness ratio maps.
This work was supported in part by grants from the U.S. National Science Foundation (AST-0407368) and NASA (TM3-4008A).
References
- [1] Y. Chen and et al. In H. Boehringer, editor, These proceedings, 2006.
- [2] A. C. Fabian. Cooling Flows in Clusters of Galaxies. In Lighthouses of the Universe: The Most Luminous Celestial Objects and Their Use for Cosmology: Garching, Germany, 6-10 August 2001, ESO ASTROPHYSICS SYMPOSIA. ISBN 3-540-43769-X. Edited by M. Gilfanov, R. Sunyaev, and E. Churazov. Springer-Verlag, 2002, p. 24, pages 24–+, 2002.
- [3] M. Donahue and G. M. Voit. Cool Gas in Clusters of Galaxies. In J. S. Mulchaey, A. Dressler, and A. Oemler, editors, Clusters of Galaxies: Probes of Cosmological Structure and Galaxy Evolution, pages 143–+, 2004.
- [4] P. M. Motl, J. O. Burns, C. Loken, M. L. Norman, and G. Bryan. Formation of Cool Cores in Galaxy Clusters via Hierarchical Mergers. ApJ, 606:635–653, May 2004.
- [5] P. M. Motl, E. J. Hallman, J. O. Burns, and M. L. Norman. The Integrated Sunyaev-Zeldovich Effect as a Superior Method for Measuring the Mass of Clusters of Galaxies. ApJL, 623:L63–L66, April 2005.
- [6] A. V. Kravtsov, D. Nagai, and A. A. Vikhlinin. Effects of Cooling and Star Formation on the Baryon Fractions in Clusters. ApJ, 625:588–598, June 2005.
- [7] B. W. O’Shea, G. Bryan, J. Bordner, M. L. Norman, T. Abel, R. Harkness, and A. Kritsuk. in Adaptive Mesh Refinement: Theory and Applications. Berlin: Springer, March 2005.
- [8] E. J. Hallman, P. M. Motl, J. O. Burns, and M. L. Norman. Challenges for Precision Cosmology with X-Ray and Sunyaev-Zeldovich Effect Gas Mass Measurements of Galaxy Clusters. ApJ, 648:852–867, September 2006.
- [9] A. Vikhlinin, A. Kravtsov, W. Forman, C. Jones, M. Markevitch, S. S. Murray, and L. Van Speybroeck. Chandra Sample of Nearby Relaxed Galaxy Clusters: Mass, Gas Fraction, and Mass-Temperature Relation. ApJ, 640:691–709, April 2006.