The Spitzer c2d survey of Large, Nearby, Interstellar Clouds. V. Chamaeleon II Observed with IRAC
Abstract
We present IRAC (3.6, 4.5, 5.8, and 8.0 µm) observations of the Chamaeleon II molecular cloud. The observed area covers about 1 square degree defined by . Analysis of the data in the 2005 c2d catalogs reveals a small number of sources (40) with properties similar to those of young stellar or substellar objects (YSOs). The surface density of these YSO candidates is low, and contamination by background galaxies appears to be substantial, especially for sources classified as Class I or flat SED. We discuss this problem in some detail and conclude that very few of the candidate YSOs in early evolutionary stages are actually in the Cha II cloud. Using a refined set of criteria, we define a smaller, but more reliable, set of 24 YSO candidates.
1 Introduction
One of the goals of the Spitzer Legacy Program “From Molecular Cores to Planet-forming Disks” (c2d) is to observe a sample of five molecular clouds (Chamaeleon II, Lupus, Perseus, Serpens and Ophiuchus) selected to represent a wide range of physical conditions such as cloud mass, gas density, extent, structure, and internal velocity dispersion (Evans et al., 2003). The comparison between star-forming environments in these nearby molecular clouds through observations in the infrared will provide a better picture of the interplay of ambient conditions and local star-formation processes.
The molecular cloud complex in Chamaeleon (hereafter Cha) has three major clouds: Cha I, Cha II, and Cha III (Schwartz, 1977). These clouds are located somewhat below the Galactic plane [, see Fig. 7 in Lépine & Duvert (1994)]. CO observations have been presented by Vilas-Boas et al. (1994) and Mizuno et al. (2001), while 13CO and C18O data are discussed by Mizuno et al. (1999). Comparisons of the CO column density and extinction were made by Hayakawa et al. (2001), who characterized the clouds as being very close to virial equilibrium, though Boulanger et al. (1998) argued that Cha II has two velocity components that may not be bound. The estimated virial mass of Cha II is 1.7103 M⊙, which is consistent with mass estimates from 100 µm extinction maps (Boulanger et al. 1998).
Cha II is at a distance of 178 18 pc (Whittet et al. 1997). Its galactic coordinates of , place it considerably off the Galactic plane; its high ecliptic latitude of implies that asteroids will be rare. The directions of Galactic and equatorial coordinates are very similar for Cha Il.
Some low-mass cores are present in the Cha clouds (Vilas-Boas et al., 1994). These cores have lower column density than typical cores in Taurus and Ophiuchus, and the star formation efficiency is lower as well (Vilas-Boas et al., 1994). Previous studies indicated that star formation activity decreases from Cha I to Cha III, with Cha II intermediate. Cha II was chosen for the c2d survey to exemplify clouds with modest star formation activity, based on previous data. The goal was to determine if the much more sensitive data from Spitzer would change this picture.
A number of low mass T Tauri stars have been observed in the Cha II cloud. Nine of the Cha II T Tauri stars (Class II, or stars with disks) selected from their Hα emission, have been observed at 1.3 mm (Henning et al., 1993), with 3 detected; their spectral energy distributions can be fitted by stars with disks with radii of about 25 AU. This sample includes the only intermediate mass star in the cloud, the Herbig Ae/Be star IRAS 12496-7650, also known as DK Cha (Hughes et al., 1991). There is also a string of Herbig-Haro objects, HH 52, 53, and 54, which move towards the NE direction (see §7.1). The YSO population in Cha II has been discussed by a number of authors, including Alcalá et al. (2000), Vuong et al. (2001), Persi et al. (2003), and Young et al. (2005). In particular, Persi et al. (2003) used ISOCAM and JHK images to study the population of young stars in an area centered about 23′ to the east of our coverage. A number of the Class II sources were observed with the IRS instrument on the Spitzer Space Telescope and show signs of grain growth (Kessler-Silacci et al., 2006).
We describe observations of Cha II from 3.6 to 8 µm, along with complementary data from other bands in §2 and a description of data reduction and photometry in §3. The results are presented in §4, and the identification and classification of candidate young stellar objects (YSOc) are in §5. We discuss problems of background contamination in §6 and present a smaller, less contaminated sample based on refined classification criteria. We compare our results to previous work in §7 and summarize our results in §8. This is a companion paper to one on c2d observations of Cha II at longer wavelengths (Young et al., 2005). It follows roughly the same plan as previous papers on IRAC data from the c2d survey of Serpens (Harvey et al., 2006) and Perseus (Jørgensen et al., 2006), in an attempt to provide a uniform set of statistics and diagnostic tools.
This paper does not present a complete list of YSOs associated with Cha II. Analysis of the combined set of IRAC and MIPS data, along with data from other studies, will be presented by Alcalá et al. (in prep.). That study will include a complete list of YSOs, based both on our data and on work that covers areas outside our survey (e.g., Persi et al. 2003).
2 Observations
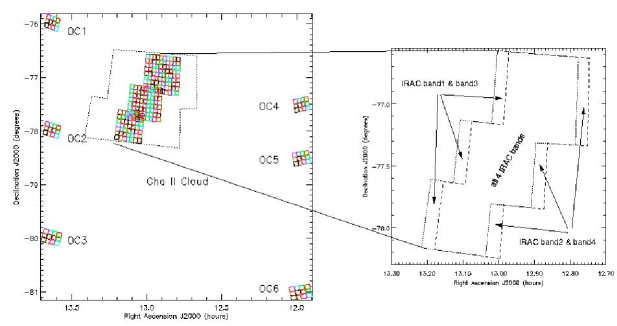
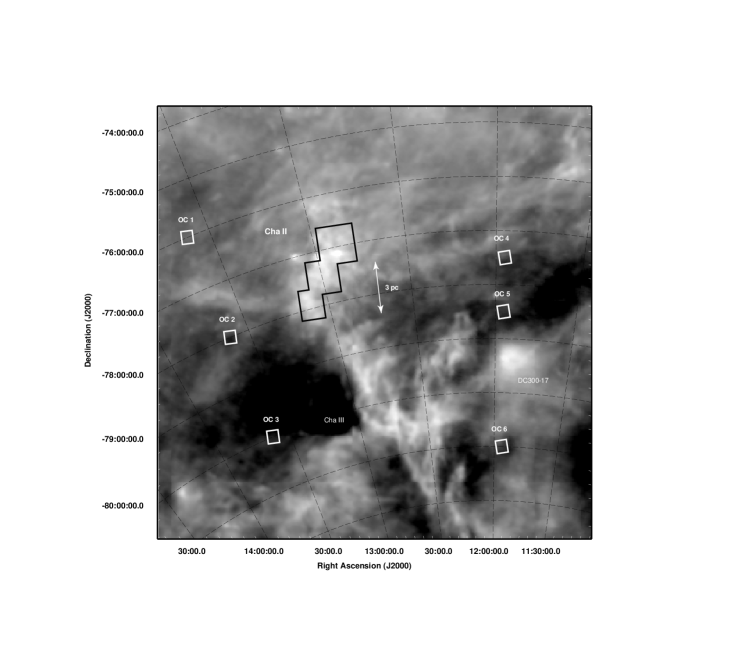
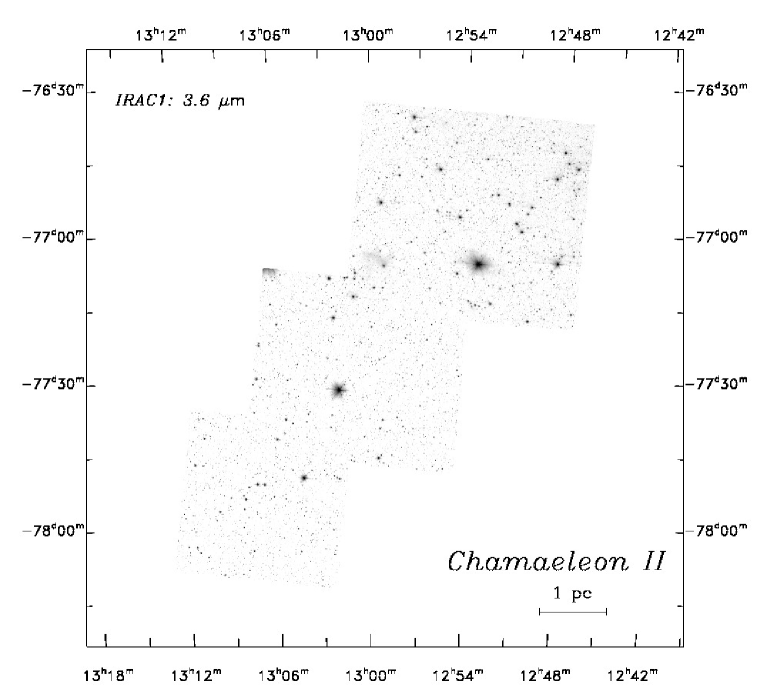
The Cha II molecular cloud was observed with the Spitzer Space Telescope (hereafter Spitzer) (Werner et al., 2004) with the Infrared Array Camera (IRAC) described by Fazio et al. (2004). We observed in the four IRAC bands (with filters centered at about 3.6, 4.5, 5.8, and 8.0 m) on 4 April 2004. The coverage is shown in detail in Figure 1. The area mapped in these four bands is shown on top of the IRAS 100 µm image in Figure 2. It was selected based on the criterion that mag in maps made by Cambrésy (1999), as shown in Figure 1 of Evans et al. (2003).
The entire area was observed twice. The first observation, or epoch, was separated from the second epoch by about 6.5 hours. The first epoch was observed in high dynamic range mode (HDR, alternate short and long time exposures) while the second epoch was observed in full array mode (FA, only one initial short time exposure followed by several long time exposures). The integration time per pointing, or frame time, was selected to be 12 sec. HDR mode enables short integration time observations of 0.6 sec for complementary photometry of very bright sources that might saturate in the long exposure time observations of 12 sec. Every pointing in both epochs was repeated twice with a small positional shift of 20-30. The combination of these two dithered images per pointing not only increases the signal-to-noise of the observations but also facilitates the removal of some occasional bad pixels in the detector, as well as cosmic ray rejection. The exposure time (i.e., the effective integration time per pixel) was 10.4 sec and 0.4 sec for the long and short integrations, respectively. Thus, the total integration time of the combined epochs, with two dithers each, is at least 42 sec and 0.4 sec (HDR) throughout the surveyed region.
The observed Cha II cloud area was covered by three overlapping grids of 9 10, 8 9, and 7 7 pointings located in the northern, middle, and southern parts of the cloud, respectively (Table 1). Each individual IRAC pointing has a FOV of (see the coverage scheme in Figure 1); thus the complete mosaic of 211 pointings embraces more than one square degree, for each pair of bands, with the coverage for bands 1 and 3 offset to the east from that of bands 2 and 4 (Fig. 1). The area covered by all four IRAC bands was square degrees or 10.0 pc2.
Six off-cloud (OC) regions were also observed with IRAC to compare the stellar population found outside the molecular cloud region. These were selected to have mag and little or no CO emission (Evans et al., 2003). The coordinates of the central position of these OC regions and the three in the Cha II cloud are summarized in Table 1, and their locations are shown in Figure 1. All six OC regions were covered by grids of 3 4 pointings. The observations were made in HDR mode with two repetitions on every two dither positions, and the frame time was 12 sec. This parameter selection gives the same integration time for the off-cloud fields as for the on-cloud area. The locations of the off-cloud regions are shown in Figure 2.
All Cha II IRAC observations are available at the SSC archive under the PID number 176, as part of the IRAC campaign 6. The AOR keys for Cha II in-cloud are: 0005739520, 0005739776, 0005740032, 0005740288, 0005740544, and 0005740800, while for the OC regions: 0005741312, 0005741568, 0005741824, 0005742080, 0005742336, and 0005742592.
3 Data Reduction
A detailed description of the c2d pipeline can be found in the data delivery document111http://ssc.spitzer.caltech.edu/legacy/ (Evans et al., 2005), and a substantial description has been published by Harvey et al. (2006). The source extraction and photometry will be described by Harvey et al. (in prep.). Consequently, we restrict ourselves here to a summary that highlights points needed for later discussion.
IRAC images were processed by the Spitzer Science Center (SSC) using a standard pipeline (S11) to produce Basic Calibrated Data (BCD) images. The data were then processed through the standard c2d pipeline. The BCD images were corrected by the c2d Calibration and Correction (CC) team for some instrumental signatures providing Improved Calibrated Data (ICD) to be mosaiced in every IRAC band. Sources were identified using the mosaics, but the individual images were used for the final source extraction and photometry. The short exposure data were used for bright sources to avoid saturation. An outlier rejection algorithm was used to remove asteroids, which should be rare at the ecliptic latitude of Cha II. Sources that did not fit a point source profile were identified; most of the analysis in this paper is restricted to point sources. The uncertainty in the flux calibration is conservatively estimated to be 15%. Apparent magnitudes were calculated using the posted222http://ssc.spitzer.caltech.edu/irac/calib/overview.html IRAC zero magnitude flux densities.
A catalog of band-merged data with data quality flags was produced. The IRAC data were merged with MIPS data at 24 µm (Young et al., 2005) and with the Two Micron All Sky Survey (2MASS) catalog (Cutri et al., 2003). For a source to be band-merged across IRAC bands or with 2MASS, a position match within 2″ is required; for MIPS 24 µm, the match must be within 4″.
4 Results
The results in this paper are based on the c2d data products delivered to the Spitzer Science Center in December 2005 (hereafter 2005 products) and described by Evans et al. (2005).
4.1 Cloud Images
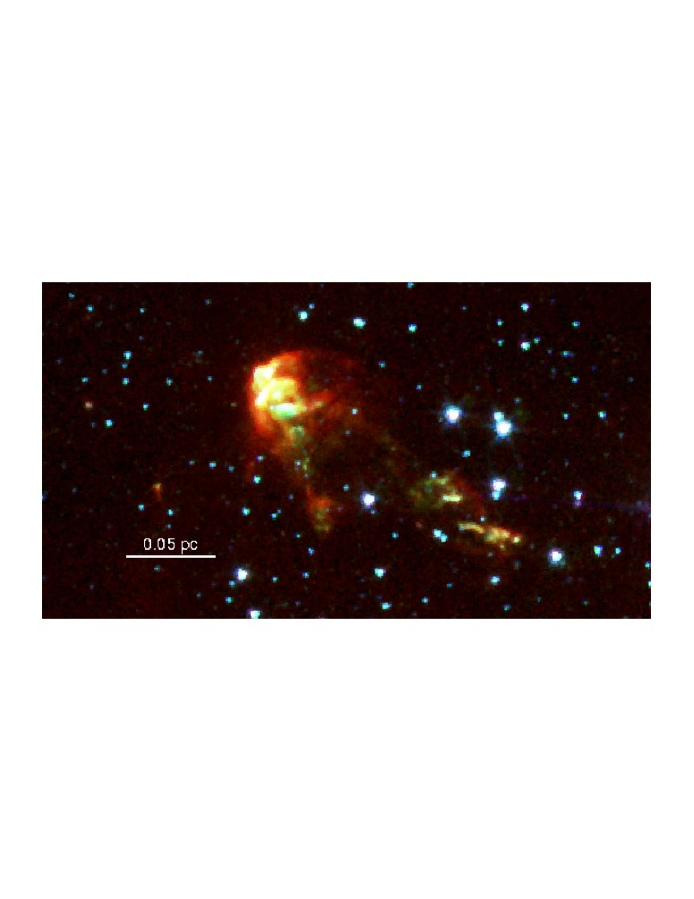
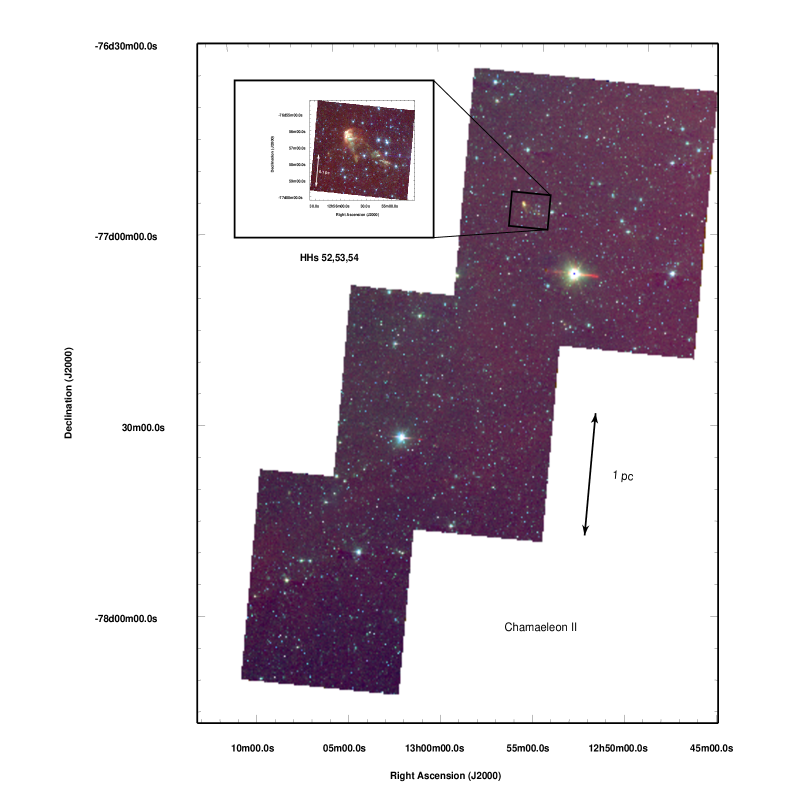
Figure 3 shows a color composite image in IRAC bands 1, 2, and 4 of the three overlapping regions of the Cha II molecular cloud. The gray-scale images for each band are shown in Figure 4. The brightest source corresponds to IRAS , an Ae/Be star. A Herbig-Haro object, HH 54, (Reipurth & Bally, 2001) is also visible in Figure 3 and a blow-up of the region of the HH object is shown. This object will be discussed later (see section 7.1).
Compared to both Serpens (Harvey et al., 2006) and Perseus (Jørgensen et al., 2006), Cha II shows less diffuse emission at 8 µm, indicative of a lower level of interstellar radiation or a lower abundance of PAHs in Cha II, or both. The MIPS images (Young et al., 2005) show strong diffuse emission around IRAS and in a region to the east of it, which unfortunately lies just off the edge of the IRAC images. This region, associated with the Class I source, IRAS (also known as ISO-ChaII-28) is seen in the IRAS emission shown in Figure 2.
4.2 Source Statistics
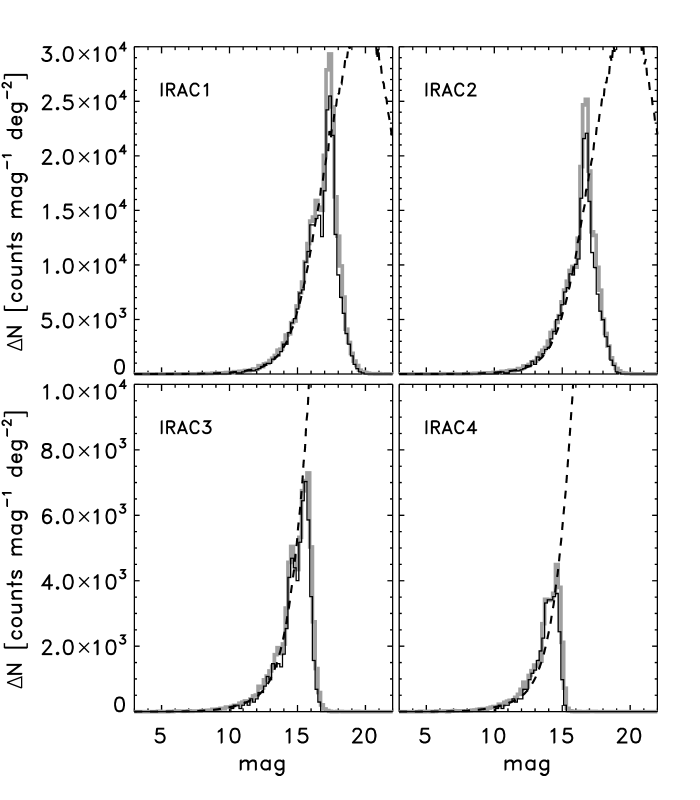
Table 2 shows the number of sources detected in Cha II with signal-to-noise of at least 7. The vast majority of the 69848 sources detected in at least one band are background stars. This fact is illustrated in Table 3, where the number of sources per band is listed at various levels of signal-to-noise. The number of sources detected at each level is much greater in the shorter wavelength bands. The differential source counts per solid angle for each band, shown in Figure 5, indicate very similar surface densities in the on-cloud and off-cloud fields (gray and black lines, respectively). The counts also agree closely with predictions of a Galactic model (Wainscoat et al., 1992) until near the limiting magnitude, where an extra peak is seen in both the on and off-cloud fields, most clearly in IRAC bands 1 and 3. A similar effect was seen in Perseus (Jørgensen et al., 2006) and attributed to the distribution of background galaxies or stars. The limiting magnitudes for a complete sample suggested by Figure 5 are 17.5, 16.5, 15.0, and 14.0 mag for 3.6, 4.5, 5.8, and 8.0 m respectively. These are each about 0.5 mag higher than our pre-launch predictions for the 5- sensitivities (Evans et al., 2003).
For further analysis, we restrict ourselves to the “high quality” catalog, which includes only sources with detections in all 4 IRAC bands, excludes sources which were classified as extended during source extraction, and excludes sources without a quality of detection of either “A” or “B” in at least one IRAC band (signal-to-noise greater than about 10 or 7 , respectively). These criteria are discussed by Harvey et al. (2006) and Evans et al. (2005); applying them leads to a drastically pruned sample of 6284 sources (Table 2). For comparison, 1532 sources were detected with MIPS at 24 µm in the somewhat larger field (1.5 square degrees) covered by that instrument (Young et al., 2005). The number of sources with 2MASS identifications and detections in IRAC band 1 and band 2 is 4621 (Table 2). Many on-cloud sources (2179) were detected by IRAC, but not 2MASS; a few sources (67) were detected (S/N at least 10 in both H and K) by 2MASS, but not IRAC. Such sources are generally located around the edges of the IRAC coverage, though a few correspond to sources that saturated the IRAC images. The two brightest sources are not listed in our high-quality catalog because they are saturated; these are IRAS (DK Cha) and IRAS (CD).
In comparison to Perseus (Jørgensen et al., 2006), Cha II has a similar number of 4-band detections in an area that is smaller by nearly a factor of 4; this difference arises because Cha II is somewhat closer to the Galactic plane () than Perseus (), and closer to the Galactic center ( versus ). The number of 4-band detections in Serpens () is still greater than in Cha II by a factor of more than 2 (Harvey et al., 2006).
5 Candidate Young Stellar Objects: the 2005 Catalog
The sensitivity of the c2d survey is sufficient to detect embedded sources and young stars down to very low levels of luminosity ( L⊙). We refer to such objects as Young Stellar Objects (YSOs) whether they are in fact stellar or substellar, and we include all stages of evolution from deeply embedded protostars to revealed stars as long as they have a convincing infrared excess over the stellar photosphere.
As was clear from the discussion in §4.2 and from Figure 5, the vast majority of sources that we detect are background stars, while background galaxies represent a significant contaminant at low flux levels. The question is how to separate the wheat from the chaff. As discussed by Harvey et al. (2006) and Jørgensen et al. (2006), our 2005 catalogs (Evans et al., 2005) did not effect a complete separation. Instead, we used a combination of criteria based on color-magnitude and color-color diagrams to produce samples “enriched” in YSOs and “impoverished” in background stars and galaxies. We will explore this sample, discuss its limitations, and then describe a more refined sample based on an improved separation procedure that is currently being tested.
5.1 Diagnostic Diagrams
Figures 6 to 8 show color-magnitude or color-color diagrams for Cha II, the off-cloud control region, and data from the SWIRE observations (Surace et al., 2004) of the ELAIS N1 field (Rowan-Robinson et al., 2004). Only the “high-quality” sources, as defined above, are included. The SWIRE field should not include any YSOs and should represent the background galaxy distribution. The SWIRE data were processed through our pipeline in the same way as the c2d data for consistency. Then our SWIRE catalog was statistically extincted with the same distribution of extinction levels seen toward Cha II and resampled to best match the limiting magnitudes of our Cha II observations (P. Harvey, in prep.). Several independent samples were made of the full 5.3 deg2 area to check for variations, which were small. For the figures, the sources from one of these samples were again randomly sampled to simulate the solid angle covered by our Cha II data.
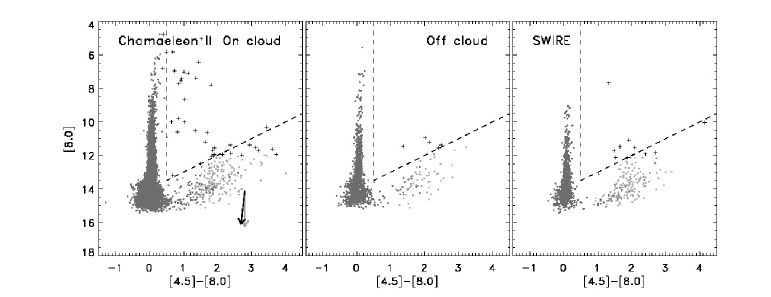
Figure 6 shows a color-magnitude diagram for Cha II, the off-cloud control region, and the resampled version of the SWIRE sample. Stars with no infrared excess occupy a band around zero color in ; sources to the right of the vertical dashed line at have significant infrared excess. This criterion is based on finding a minimum in the distributions of stars and galaxies from the SWIRE sample at this color (S. Lai et al., in prep.). At faint 8.0 µm magnitudes, a second distinct clump of faint sources appears. This clump is seen in both the off-cloud field and the SWIRE data as well, and it is clearly composed primarily of background galaxies. Analysis of the SWIRE data indicates that 95% of the galaxies lie below a line corresponding to , as shown by the diagonal dashed line. In the 2005 catalog, we classified sources lying between the two dashed lines as “YSO candidates” (YSOc), as discussed in Evans et al. (2005) and S. Lai et al. (in prep.), and these are indicated by plus signs in Figure 6.
Some sources outside the dashed lines are also classified as YSOc; these have satisfied a similar set of criteria in another color-magnitude plot using the MIPS 24 µm data. That criterion typically finds stars with infrared excesses that are significant only for µm; typically it provides only a modest increment to the YSOc category ( sources out of the total of 40 YSOc in the case of Cha II). Some relatively bright galaxies will be misclassified as YSOc in this process; based on the resampled SWIRE sample, there may be such galaxies in the Cha II sample, but extinction in the cloud might make this an upper limit. The extinction vectors in Figure 6 show that extinction will tend to move objects below the diagonal line. It is also possible that we are excluding real YSOs from the YSOc category because they are faint or highly extincted. The Serpens data show evidence for a population of such faint sources (Harvey et al., 2006).
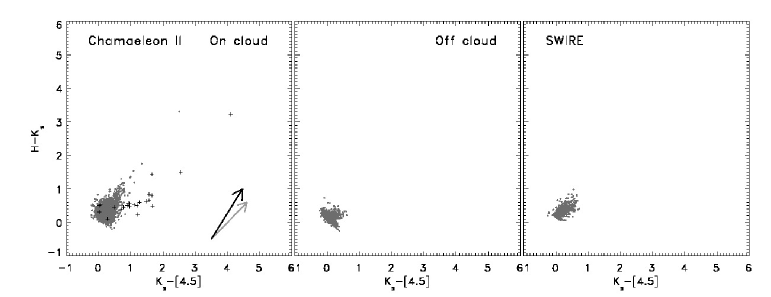
Figure 7 shows the color-color diagram with vs. (Megeath et al. 2004; Allen et al. 2004), and Figure 8 shows the vs. (Gutermuth et al., 2004) color-color diagram. These diagrams have proven useful in separating YSOs from stars, and our classification of YSOc (again plotted as plus signs) is generally consistent. Clearly, the galaxies cannot be excluded from the vs. diagram, as many occupy the same space as the YSOs. The vs. diagram is much more effective in separating galaxies, but the requirement for data at and might eliminate a substantial number of YSOc sources, especially the most deeply embedded, as long as only 2MASS data are available. For Cha II, only 22 of the 40 YSOc can be plotted. This diagram illustrates how deeper near-infrared surveys could effect a cleaner separation of the YSOs and galaxies. However, extinction can have a bigger impact on this diagram, as shown by the arrows.
5.2 Classification of YSO Candidates
Using the sample of YSO candidates selected in §5.1, we characterize sources in Cha II. In doing so, we must bear in mind that this sample only purports to be enriched in actual YSOs. We will explore the effects of contamination in the next section.
Table 4 shows the number of YSO candidates and divides them into classes. Both the total number (40) and the number per square degree (38.5) are much less than what was found toward Serpens (, ) by Harvey et al. (2006) and Perseus (, ) by Jørgensen et al. (2006). Moreover, this calculation does not account for possible contamination by background galaxies.
The sources were divided into the traditional classes (Lada, 1987) based on a fit to their spectral slope: . We use a least-squared fit to all photometric points available between and 24 µm in the calculation of . We then place these in the class system as extended by Greene et al. (1994):
- I
-
- flat
-
- II
-
- III
-
.
We have arbitrarily included sources with in Class I. As noted in column 2 of Table 4, Cha II would appear to host roughly equal numbers of Class I and flat sources versus Class II sources, with a smaller number of Class III sources. Since the Class III category does not require any minimum value of , while we include only sources with significant infrared excesses, the low counts in Class III should not be over-interpreted. Data at other wavelengths are needed to add pre-main-sequence stars without substantial infrared excess.
The ratio of Class I and flat spectrum to Class II sources in Cha II (1.1) is higher than in either Serpens (0.39) or Perseus (0.51), suggesting that star formation in Cha II is at a relatively early stage. The ratio is comparable to that found in the extended Perseus cloud, after the clusters (IC348 and NGC1333) are removed. This would be a surprising result, and we examine it critically in §6.
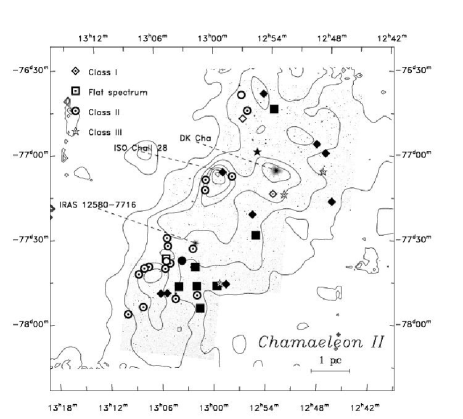
The spatial distribution of YSOc sources by class in Cha II (Fig. 9) shows that in general, all classes are sparsely distributed in the molecular cloud, particularly in the middle of the central region. This is a region of relatively modest extinction. There are small groups of Class II sources near extinction peaks.
6 Low Luminosity Class I Sources or Extragalactic Vermin?
In this section, we reconsider the criteria for classifying sources as YSO candidates. We will conclude that many of those classified as YSOc in the 2005 catalog, especially those classified as Class I or flat SEDs, are in fact extragalactic background sources. This discussion provides a warning to people using those catalogs. We then discuss steps currently underway to obtain a more reliable sample.
The statistics of the last section suggested a surprisingly large fraction of Class I sources in the Cha II cloud. Such an early phase of star formation in this cloud would be at odds with previous studies and with the lack of strong continuum emission at millimeter wavelengths over most of the cloud (Young et al., 2005). Furthermore, most of the putative Class I sources have very low luminosity ( L⊙), after integrating over all wavelengths with available photometry from 1.2 to 70 µm. (Most are not detected at µm.) Such low apparent luminosities for Class I sources, if real, would be very interesting in light of the emerging evidence for a class of Very Low Luminosity Objects (VeLLOs) in some of the small clouds in our study (Young et al. 2004; Bourke et al. 2006; Dunham et al. 2006), though the established VeLLOs have to 0.1 L⊙, rather than L⊙.
A comparison to the table of YSO candidates in Young et al. (2005) found matches for only 2 of the 11 putative Class I sources. However, all but two of our sources do have detections at MIPS 24 µm; their absence from the candidate list of Young et al. (2005) is caused by a lack of 2MASS detections, which was required by Young et al. (2005).
The Cha II cloud presents a good test case for checking for extragalactic contamination: the surface density of sources is low, making such contamination relatively more important; and the small number of sources allows careful examination. We focus here on the sources classified as Class I or flat SED, as these would be the most surprising. We will employ methods that do not require careful examination of each object, so that these methods may be useful for other clouds.
We will first consider a statistical correction based on our extincted and resampled SWIRE data from the ELAIS-N1 field. (The off-cloud data also suggest substantial contamination, but the statistics are too poor to do a detailed correction.) We use a section of the SWIRE data covering 5.3 deg2 to obtain source counts per solid angle. Then we normalize to the area covered in Cha II. We assume that all sources classified as YSOc in the SWIRE sample are in fact background contamination. The number of sources classified as YSOc in the off-cloud and SWIRE fields (also shown in Table 4) indicates that about 12 of the 40 YSOc sources in Cha II could be background galaxies. The preponderance of Class I and flat SED sources among these galaxies is clearly seen in those entries in Table 4 and by the distribution of “YSOc” in the SWIRE panel of Fig. 7.
Focusing on the 19 putative Class I and flat SED sources, the statistics of the SWIRE data suggest that only about 9 should actually be embedded sources. Small number statistics make this number very uncertain. Can we decide which are bona fide Class I sources and which are extragalactic vermin? Only two have L⊙; both of these are IRAS sources and they are the two Class I sources also identified as YSOs by Young et al. (2005). Of the other 9 Class I sources, 7 have L⊙, assuming the distance to Cha II. These are very unlikely to be actual Class I sources.
We conclude that extragalactic vermin are a substantial source of fake Class I and flat SED sources in Cha II. We caution that extragalactic vermin can be a significant source of false YSOc in early stages in fields with low surface densities of bona fide sources, leading to distortions in source counts and classification schemes.
6.1 Toward a Cleaner Sample of YSOs
We are currently working on a set of criteria that will effect a much cleaner separation between true YSOs and background galaxies. These criteria will be described in detail by Harvey et al. (in prep.). They use both IRAC and MIPS color and magnitude criteria. When applied to the Cha II data and the extincted, resampled SWIRE data, these new criteria deliver much smaller numbers of YSO candidates: 24 in Cha II and 3 in the full SWIRE sample covering 5.3 deg2. This would predict that only 0 or 1 fake YSO should appear in the new sample of YSOc in Cha II, which covers only 1.04 deg2.
It is instructive to compare the old and new YSOc samples. The 19 sources rejected by the new criteria are almost all the sources of apparent low luminosity (14 of 19 with L⊙) and early (Class I or flat) SEDs (17 of 19). Only one reject is a legitimate YSO, ISO-ChaII-28, or IRAS (Persi et al. 2003; Young et al. 2005).
The YSOc selected by the new criteria include 3 sources not included previously. Two of these are legitimate YSOs based on other work: Sz54 (Hughes & Hartigan, 1992) and IRAS (J. Alcalá et al. in prep.). They were previously excluded by the apparent presence of a second source within 20 in the 4.5 µm band. This criterion has been relaxed in the new criteria. The third new source is an interesting case study in the remaining problems. It was previously excluded because it was fitted as an extended source in two bands. It is brighter at long wavelengths than any source in the larger SWIRE field, and it has a steeply rising spectral index (1.66). It would have a luminosity out to 70 µm of about 0.05 L⊙. It is either a VeLLO or an unusally bright background galaxy. Fortuitously, this object has been observed with HST in a study of putative edge-on disks (Stapelfeldt et al. in prep.). In that image, it is clearly a pair of interacting galaxies!
The YSOc rejected by the new criteria are shown as filled symbols in Fig. 9; they mostly lie in regions of low extinction, though they are surprisingly clustered. The surviving YSOc correlate better with the extinction contours.
The new criteria seem to be much more effective. They have included only one clear background galaxy (pair) and they have excluded one legitimate YSO, a much better record. If we delete the known contaminant and add the known left-out source, we get the statistics in the “New” Column in Table 4. Recall that the two brightest sources are not included because of saturation; of these, DK Cha would be a Class I YSO (Henning et al., 1993). Further analysis of the entire YSO population requires data at other wavelengths and will be pursued in a follow-up paper (J. Alcalá, in prep.). Early results from that work support the value of the new criteria in separating YSOs from background galaxies.
7 Comparisons to Other Studies and Comments on Individual Objects
The two certain Class I sources (IRAS and IRAS , also known as ISO-Cha II-28) have been discussed by Young et al. (2005). Rather than discuss individual sources in detail, we engage in some comparison of our samples of YSOc to those found in previous studies with the goal of illustrating the complementary nature of different surveys.
The YSO population in Cha II has been analyzed by Vuong et al. (2001), Persi et al. (2003), Alcalá et al. (2000), and Young et al. (2005). A number of brown dwarfs with disks have been identified using deep near-infrared data and our c2d catalogs (Allers et al., 2006). Some of the sources discussed by these authors show up as YSOc sources in our catalogs, primarily in the classes from “flat” to Class II. We describe briefly comparisons to some of the previous catalogs.
Six of our YSOc list are found in Table 1 of Vuong et al. (2001), selected on the basis that . Only three of the objects in the Tables in Persi et al. (2003) are in our YSOc list; the overlap is small because the area covered by their study was smaller and about half is off to the east of our coverage. Of the seven candidate brown dwarfs with disks in Cha II listed by Allers et al. (2006), 5 appear in our YSOc list. The two missing sources are too faint to be included in the 2MASS catalog, and hence have insufficient wavelength coverage to be classified in our catalogs, even though they are well detected. Allers et al. (2006) were able to classify them using deeper near-infrared data. Most of the objects found by Allers et al. (2006) have now been confirmed with spectroscopy to be brown dwarfs (Alcalá et al. 2006; Allers 2006; Jayawardhana & Ivanov 2006).
7.1 HH 54
The three color image in Fig. 10 shows the Herbig-Haro objects HH 54 (upper left) and HH 52/53 (lower right). HH 54 is a well studied region notable for its large abundance of water vapor (Liseau et al., 1996) and ratios of ortho-to-para H2 below those expected for the observed gas temperatures ( K), as discussed by Gredel (1994) and Neufeld et al. (1998). Observations of HH 54 with IRS aboard Spitzer (Neufeld et al., 2006) show that IRAC bands 3 and 4 are dominated by shocked rotational transitions of H2, tracing temperatures of 400-1200 K, while H2 emission in IRAC band 2 traces somewhat higher temperatures and is a good tracer of shocked outflow emission without the possible confusion from PAH emission (Smith & Rosen 2005; Noriega-Crespo et al. 2004). The bow shock of HH 54 shows a mix of green and red emission (IRAC bands 2 and 4 respectively), while the region behind the bow and around HH 52/53 is dominated by green emission (IRAC band 2 only), indicative of higher temperatures and in broad agreement with the trends seen by Neufeld et al. (2006). HH 54 is also well detected at 24 µm by MIPS and IRS.
8 Conclusions
The Cha II molecular cloud has been surveyed with the IRAC instrument of the Spitzer Space Telescope. Among the nearly 70,000 sources detected in at least one band in our 2005 catalogs, 40 objects have been identified as candidates to be young stellar or substellar objects, collectively known as YSOc’s. The total number and number per solid angle of YSOc’s are much smaller than toward other c2d clouds analyzed so far, Serpens and Perseus. The number of the YSOc’s that were classifed as Class I or flat spectrum sources is comparable to the number in the Class II stage, unlike the situation in Serpens and Perseus. If real, these would indicate much more active star formation than previously known in Cha II, concentrated on very low luminosity objects. However, many of these appear to be background galaxies; improved criteria yield only 24 objects classified as YSOc, mostly Class II objects. Care must be taken to avoid distortion of the statistics of sources in various classes by background objects, especially in fields with low surface density of YSOs, such as Cha II. The contaminating background galaxies are preferentially found in the earlier classes.
References
- Alcalá et al. (2000) Alcalá, J. M., Covino, E., Sterzik, M. F., Schmitt, J. H. M. M., Krautter, J., & Neuhäuser, R. 2000, A&A, 355, 629
- Alcalá et al. (2006) Alcalá, J. M., Spezzi, L., Frasca, A., Covino, E., Porras, A., Merín, B., & Persi, P. 2006, A&A, 453, 1
- Allen et al. (2004) Allen, L. E., et al. 2004, ApJS, 154, 363
- Allers et al. (2006) Allers, K. N., Kessler-Silacci, J. E., Cieza, L. A., & Jaffe, D. T. 2006, ApJ, 644, 364
- Allers (2006) Allers, K. N. 2006, Ph. D. Dissertation, The University of Texas at Austin
- Boulanger et al. (1998) Boulanger, F., Bronfman, L., Dame, T. M., & Thaddeus, P. 1998, A&A, 332, 273
- Bourke et al. (2006) Bourke, T. L., et al. 2006, ApJ, 649, L37
- Cambrésy (1999) Cambrésy, L. 1999, A&A, 345, 965
- Cutri et al. (2003) Cutri, R. M., et al. 2003, The IRSA 2MASS All-Sky Point Source Catalog, NASA/IPAC Infrared Science Archive. http://irsa.ipac.caltech.edu/applications/Gator/,
- Dunham et al. (2006) Dunham, M. M., et al. 2006, ApJ, in press
- Evans et al. (2003) Evans, N. J., et al. 2003, PASP, 115, 965
- Evans et al. (2005) Evans, N. J., et al. 2005, “Third Delivery of Data from the c2d Legacy Project: IRAC and MIPS (Pasadena, SSC)”
- Fazio et al. (2004) Fazio, G. G., et al. 2004, ApJS, 154, 10
- Gredel (1994) Gredel, R. 1994, A&A, 292, 580
- Greene et al. (1994) Greene, T. P., Wilking, B. A., Andre, P., Young, E. T., & Lada, C. J. 1994, ApJ, 434, 614
- Gutermuth et al. (2004) Gutermuth, R. A., Megeath, S. T., Muzerolle, J., Allen, L. E., Pipher, J. L., Myers, P. C., & Fazio, G. G. 2004, ApJS, 154, 374
- Harvey et al. (2006) Harvey, P. M., et al. 2006, ApJ, 644, 307
- Hayakawa et al. (2001) Hayakawa, T., Cambrésy, L., Onishi, T., Mizuno, A., & Fukui, Y. 2001, PASJ, 53, 1109
- Henning et al. (1993) Henning, T., Pfau, W., Zinnecker, H., & Prusti, T. 1993, A&A, 276, 129
- Hughes & Hartigan (1992) Hughes, J., & Hartigan, P. 1992, AJ, 104, 680
- Hughes et al. (1991) Hughes, J. D., Hartigan, P., Graham, J. A., Emerson, J. P., & Marang, F. 1991, AJ, 101, 1013
- Indebetouw et al. (2005) Indebetouw, R., et al. 2005, ApJ, 619, 931
- Jayawardhana & Ivanov (2006) Jayawardhana, R., & Ivanov, V. D. 2006, ApJ, 647, L167
- Jørgensen et al. (2006) Jørgensen, J. K., et al. 2006, ApJ, 645, 1246
- Kessler-Silacci et al. (2006) Kessler-Silacci, J., et al. 2006, ApJ, 639, 275
- Lada (1987) Lada, C. J. 1987, in IAU Symp. 115: Star Forming Regions (D. Reidel Publishing Co., Dordrecht), Vol. 115, 1
- Lépine & Duvert (1994) Lépine, J. R. D., & Duvert, G. 1994, A&A, 286, 60
- Liseau et al. (1996) Liseau, R., et al. 1996, A&A, 315, L181
- Megeath et al. (2004) Megeath, S. T., et al. 2004, ApJS, 154, 367
- Mizuno et al. (1999) Mizuno, A., et al. 1999, PASJ, 51, 859
- Mizuno et al. (2001) Mizuno, A., Yamaguchi, R., Tachihara, K., Toyoda, S., Aoyama, H., Yamamoto, H., Onishi, T., & Fukui, Y. 2001, PASJ, 53, 1071
- Noriega-Crespo et al. (2004) Noriega-Crespo, A., et al. 2004, ApJS, 154, 352
- Neufeld et al. (1998) Neufeld, D. A., Melnick, G. J., & Harwit, M. 1998, ApJ, 506, L75
- Neufeld et al. (2006) Neufeld, D. A., et al. 2006, ApJ, 649, 816
- Persi et al. (2003) Persi, P., Marenzi, A. R., Gómez, M., & Olofsson, G. 2003, A&A, 399, 995
- Reipurth & Bally (2001) Reipurth, B., & Bally, J. 2001, ARA&A, 39, 403
- Rowan-Robinson et al. (2004) Rowan-Robinson, M., et al. 2004, MNRAS, 351, 1290
- Schwartz (1977) Schwartz, R. D. 1977, ApJS, 35, 161
- Smith & Rosen (2005) Smith, M. D., & Rosen, A. 2005, MNRAS, 357, 1370
- Surace et al. (2004) Surace, J. A., et al. 2004, VizieR Online Data Catalog, 2255, 0
- Vilas-Boas et al. (1994) Vilas-Boas, J. W. S., Myers, P. C., & Fuller, G. A. 1994, ApJ, 433, 96
- Vuong et al. (2001) Vuong, M. H., Cambrésy, L., & Epchtein, N. 2001, A&A, 379, 208
- Wainscoat et al. (1992) Wainscoat, R. J., Cohen, M., Volk, K., Walker, H. J., & Schwartz, D. E. 1992, ApJS, 83, 111
- Werner et al. (2004) Werner, M. W., et al. 2004, ApJS, 154, 1
- Whittet et al. (1997) Whittet, D. C. B., Prusti, T., Franco, G. A. P., Gerakines, P. A., Kilkenny, D., Larson, K. A., & Wesselius, P. R. 1997, A&A, 327, 1194
- Young et al. (2004) Young, C. H., et al. 2004, ApJS, 154, 396
- Young et al. (2005) Young, K. E., et al. 2005, ApJ, 628, 283
| Region | Central Position1 | Area2 | |
| R. A. (J2000) | Dec (J2000) | (deg2) | |
| h min sec | ∘ | ||
| ChaII-1 | 13 01 38.88 | 01 11.98 | 0.48 |
| ChaII-2 | 13 01 11.52 | 34 12.00 | 0.37 |
| ChaII-3 | 12 54 13.68 | 58 48.01 | 0.22 |
| OC-1 | 13 37 54.00 | 58 48.01 | 0.05 |
| OC-2 | 13 38 02.64 | 58 48.01 | 0.05 |
| OC-3 | 13 38 15.36 | 58 48.01 | 0.05 |
| OC-4 | 11 58 02.16 | 30 36.01 | 0.05 |
| OC-5 | 11 58 07.68 | 30 36.01 | 0.05 |
| OC-6 | 11 58 26.16 | 00 36.01 | 0.05 |
| 1of IRAC 3.6 5.8m grids | |||
| 2Area covered by all four IRAC bands | |||
| On cloud | Off cloud | |
| Detection in at least one IRAC band | 69848 | 18483 |
| Detection in all 4 IRAC bands | 6476 | 1562 |
| Detection in 3 IRAC bands | 5460 | 1424 |
| Detection in 2 IRAC bands | 27506 | 7017 |
| Detection in 1 IRAC band | 30406 | 8480 |
| Detection in 2MASS onlya | 67 | 0 |
| Detection in IRAC only | 65139 | 17222 |
| Detection in 4 IRAC bands and not 2MASSa | 2179 | 462 |
| Excluding extended sources: | ||
| Four band detections | 6284 | 1496 |
| Four band detections with 2MASS associationa | 4229 | 1086 |
| Detected in IRAC1+2 and 2MASSa | 4621 | 1248 |
aA source is counted as detected by 2MASS if it has a S/N of at least 10 in both and .
| 3.6 m | 4.5 m | 5.8 m | 8.0 m | |
|---|---|---|---|---|
| Detections with | ||||
| S/N of at least 7 | 61769 | 46221 | 11583 | 8219 |
| S/N of at least 10 | 55742 | 39034 | 8204 | 5992 |
| S/N of at least 15 | 39527 | 24636 | 4979 | 4248 |
| Final sample (excluding extended sources) | 60601 | 45935 | 11513 | 8003 |
| 2MASS ass. (S/N at least 10 in and ) | 4633 | 4642 | 4443 | 4453 |
| Quantity | Cha IIaaBased on 2005 criteria for YSO candidates; actual numbers for classes | OCaaBased on 2005 criteria for YSO candidates; actual numbers for classes | SWIREbbBased on 2005 criteria for YSO candidates; numbers for classes are noralized to area of Cha II | NewccBased on new criteria for YSO candidates (see discussion in §6) |
|---|---|---|---|---|
| Area (deg2) | 1.04 | 0.3 | 5.3 | 1.04 |
| YSO candidates | 40 | 5 | 59 | 24 |
| YSOc’s per sq. degree | 38.5 | 17 | 11.6 | 23.1 |
| Class I | 11 (27.5%) | 4 | 3.7 | 2 (8%) |
| “Flat spectrum” | 8 (20.0%) | 0 | 5.9 | 0 (0%) |
| Class II | 17 (42.5%) | 1 | 0.8 | 19 (79%) |
| Class III | 4 (10.0%) | 0 | 1.2 | 3 (13%) |
![[Uncaptioned image]](/html/astro-ph/0610849/assets/x5.png)
![[Uncaptioned image]](/html/astro-ph/0610849/assets/x6.png)
![[Uncaptioned image]](/html/astro-ph/0610849/assets/x7.png)