Quasar X-ray jets: -ray diagnostics of the synchrotron and inverse Compton hypotheses, the case of 3C 273
Abstract
The process responsible for the Chandra-detected X-ray emission from the large scale jets of powerful quasars is a matter of ongoing debate. The two main contenders are external Compton (EC) scattering off the cosmic microwave background (CMB) photons (EC/CMB) and synchrotron emission from a population of electrons separate from those producing the radio - IR emission. So far, no clear diagnostics have been presented to distinguish which of the two, if any, is the actual X-ray emission mechanism. Here we present such diagnostics based on a fundamental difference between these two models: the production of synchrotron X-rays requires multi - TeV electrons, while the EC/CMB model requires a cutoff in the electron energy distribution (EED) below TeV energies. This has significant implications for the -ray emission predicted by these two models, that can be tested through GeV and TeV observations of the nearby bright quasar 3C 273. We show how existing and future GeV and TeV observations can confirm or refute one or both of the above hypotheses.
1 Introduction
The unexpected X-ray detection of the radio jet of quasar PKS 0637-752 by Chandra (Schwartz et al. 2000, Chartas et al. 2000) ushered in a new era in the study of extragalactic jets (for a recent review see Harris & Krawczynski 2006). The broadband spectral energy distribution (SED) of the jet knots exhibits a concave shape with two spectral components, a low energy synchrotron one peaking at Hz and cutting off at or below the optical regime, and a high energy one dominating the jet luminosity and peaking beyond the Chandra energy range. Although some X-ray synchrotron - self Compton (SSC) emission was anticipated, the observed X-ray flux was found to be much higher than the SSC flux calculated under equipartition conditions (Chartas et al., 2000). Tavecchio et al. (2000) and Celotti, Ghisellini, & Chiaberge (2001) proposed that the X-ray emission can be explained as EC scattering off the CMB (EC/CMB), under the assumption that the large scale jet is relativistic with Lorentz factor and points close to our line of sight, and that its electron EED extends down to energies MeV, significantly lower than the GeV electron energies traced by GHz synchrotron radio emission. Dozens of other quasar jets, subsequently detected by Chandra (e.g. surveys by Sambruna et al. 2004, Marshall et al. 2005), share similar properties and the EC/CMB interpretation of the X-ray extended jet emission became the interpretation of choice.
On closer inspection, however, this interpretation was shown to have problems (see review by Harris & Krawczynski 2006). For example, because the cooling length of the low energy X-ray emitting electrons is comparable to the jet length, the EC/CMB scenario cannot reproduce the kpc size X-ray knots and its low radiative efficiency leads to high, sometimes super - Eddington, requirements on the jet kinetic power (Dermer & Atoyan, 2004; Uchiyama et al., 2006). The problems encountered by the EC/CMB interpretation lead many authors (e.g. Harris, Mossman, & Walker 2004, Kataoka & Stawarz 2005, Hardcastle 2006, Jester et al. 2006, Uchiyama et al. 2006) to suggest that the X-rays are synchrotron emission from an additional EED of multi-TeV electrons. The synchrotron interpretation is very well established in most low power Fanaroff - Riley I jets (Fanaroff & Riley, 1974), where the apparently continuous SED from radio to X-rays strongly suggests a single emission process (i.e. synchrotron) across this entire energy range (e.g. Hardcastle et al. 2002, Perlman & Wilson 2005).
The two interpretations require electrons of very different energies and, therefore, impose very different requirements on jet energetics and dynamics. For example, the high radiative efficiency of the synchrotron interpretation does not require high jet bulk lower Lorentz factors (in agreement with arguments for from statistical radio studies; Wardle & Aaron 1997; Arshakian & Longair 2004), extreme lengths (Dermer & Atoyan, 2004) or super-Eddington jet power, as the EC/CMB does in several cases (Dermer & Atoyan 2004; Jorstad & Marscher 2004; Uchiyama et al. 2006). Because these different requirements have a strong impact on our understanding of quasar jets and of their effect on the host galaxy cluster, it is very important to devise ways to distinguish between the two hypotheses.
Here we examine the GeV and TeV constraints imposed on these two different interpretations by existing and future GeV and TeV observations. In particular, we show (§2) that for the nearby quasar 3C 273, existing EGRET and HESS observations already constrain the permitted parameter range of the two models, and future GLAST and HESS observations hold the potential of ruling one or, possibly, both of them out. We then (§3) discuss some additional points and caveats of this work and draw our conclusions.
2 What can we learn from GeV - TeV observations of 3C 273?
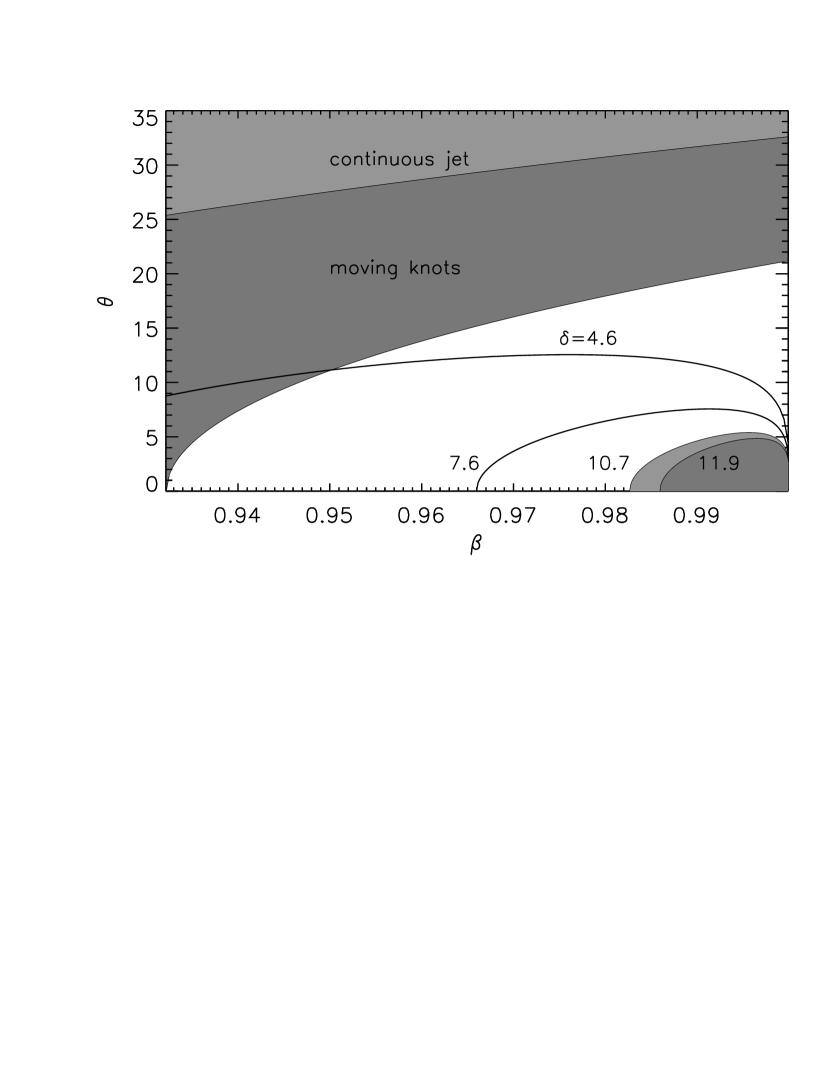
3C 273 is the nearest () powerful quasar and, as such, it has been observed extensively. VLBI observations reveal apparent superluminal components in the pc scale jet with c (e.g. Unwin et al. 1985), constraining the pc-scale jet orientation to , and its Lorentz factor to . The actual angle of 3C 273’s jet to the line of sight cannot be very small, because, unlike better aligned blazars, its optical spectrum exhibits a strong big blue bump (e.g. Courvoisier 1998, D’Elia, Padovani, & Landt 2003). High dynamic range VLA observations have only detected a one-sided large scale jet, with a jet to counter jet ratio (e.g. Conway et al. 1993). The ratio of the jet to counterjet flux is , where is the dimensionless jet speed, is its radio spectral index, for a continuous jet, and for discrete moving blobs (Lind & Blandford, 1985). We plot in figure 1 the constraints on the plane for the two cases. The shaded area above each curve is excluded. Note that this constraint does not depend on the nature of the jet X-ray emission.
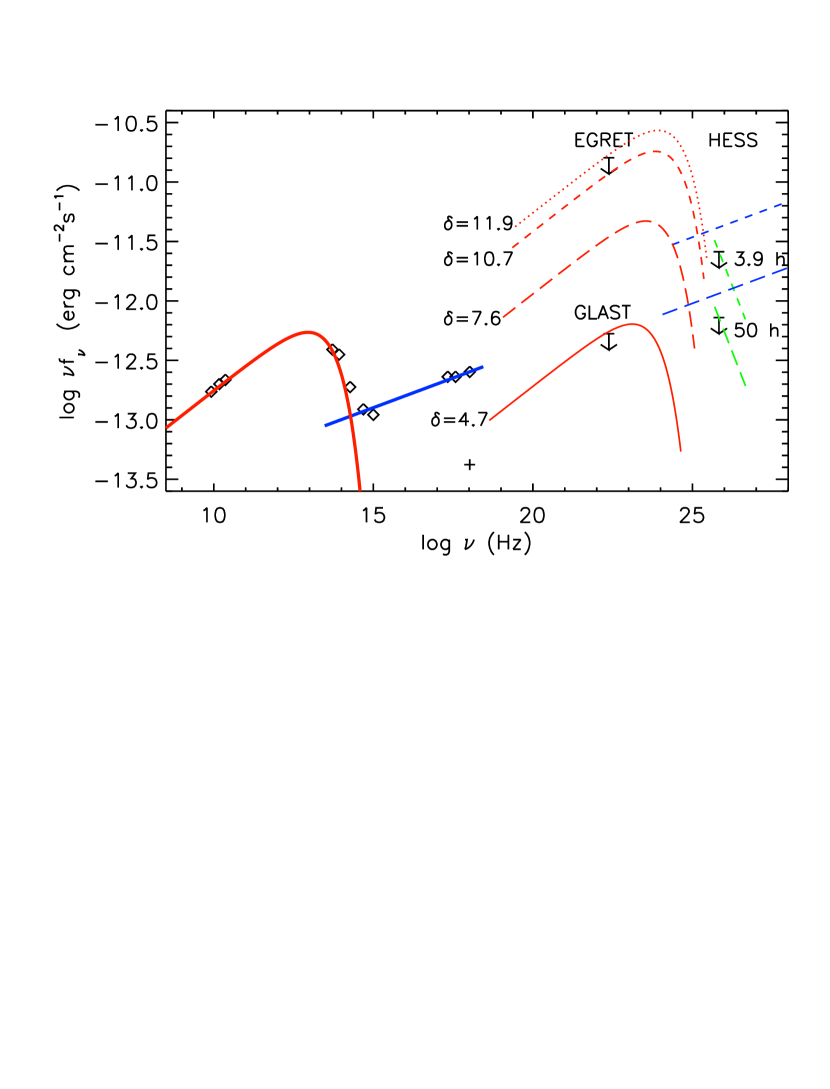
Recent observations of 3C 273 with Chandra and HST (Jester et al., 2006) as well as Spitzer (Uchiyama et al., 2006) show that the SED of each knot in the jet is characterized by two components, a low energy one having a cutoff above Hz, and a high energy one connecting the optical - UV and X-ray data. For the purpose of this work we are interested in the total jet SED, resulting by adding the fluxes of each knot, using the data from table 1 of Uchiyama et al. (2006). We plot this in figure 2 (diamonds), fitted with a two component (thick red and blue lines) analytical expression following Uchiyama et al. (2006). Assuming an equipartition magnetic field G (Jester et al., 2006), where is the usual Doppler factor, implies that the electrons producing the peak of the radio - IR component have energies TeV (Uchiyama et al., 2006), independent of the value of (Harris & Krawczynski 2002; although see Stawartz al. 2003 for a somewhat different result). If we assume that the optical to X-ray component is also synchrotron emission, the electrons of this component must reach energies at least up to TeV, and the rising X-ray SED makes it plausible that the EED extends at least up to TeV.
Unavoidably, all these electrons will upscatter the CMB, and the resulting EC/CMB SED will be an exact copy of the synchrotron one, shifted in frequency and luminosity. The frequency shift is:
| (1) |
where and are the observed EC and synchrotron frequencies emitted by electrons of Lorentz factor , and are the electron charge and mass, Hz is the CMB peak frequency at , and G. To derive the luminosity shift we note that the synchrotron observed and comoving luminosities are related through , while the EC observed and comoving luminosities are related through , for a continuous flow and for discrete moving blobs. The comoving luminosities are proportional to the comoving energy densities, , (Dermer & Schlickeiser, 1994), where erg cm-3 is the CMB energy density at . Using the above, we obtain
| (2) |
where we again used G. The two luminosities are equal for .
2.1 GeV constraints
The electrons producing the synchrotron IR peak also produce a GeV peak from EC/CMB, the level of which scales with (see eq. 2). The existing EGRET flux limit (see figure 2), when the blazar is at its usual low state (von Montigny et al., 1997), requires , plotted as a dotted red line in figure 2. Note that this line, as well as the rest of the red lines of figure 2, does not show the EC/CMB model a la Tavecchio et al. (2000) and Celotti et al. (2001), which account for the X-rays by postulating a low energy electron population, but rather shows the EC/CMB counterparts of the observed synchrotron emission for different Lorentz factors. A line that corresponds to is also plotted in figure 1 and the shaded region below this line is excluded by the EGRET limit. Even this shallow limit on , requires in the EC/CMB X-ray model either an super - Eddington jet ( erg s-1) or an Eddington power leptonic jet (Uchiyama et al., 2006).
The fact that 3C 273 was frequently below the EGRET sensitivity limit, makes it plausible that the quiescent GeV blazar emission is significantly below the EGRET limit. At the GLAST sensitivity limit (see figure 2), a GeV non-detection during suitably low blazar states would set the most stringent limit of , plotted as a thin red solid line EC/CMB SED in figure 2. We also plot a line in figure 1, with the region below it corresponding to . The jet and blazar GeV emission of 3C 273 will be spatially unresolved by GLAST. To discriminate between the two, we note that the jet GeV emission would be (i) steady and (ii) much harder than the blazar one (photon index 1.8 as opposed to for the blazar at low states; von Montigny et al. 1997). The jet emission, therefore, should reveal itself as a steady hard plateau when the steep blazar component drops below the jet flux level. As can be seen in figure 1, even for a GLAST non - detection, there is a significant part of the space that is compatible with both the line and constraints. However, any limit on lower than the limit of EGRET further increases the jet power requirements in the EC/CMB and makes its application to 3C 273 even more problematic.
2.2 TeV constraints
2.2.1 Constraints on the EC/CMB hypothesis
If the optical - X-ray emission is due to EC/CMB, then the highest energy electrons available are those emitting in the IR. As we discuss above, these sub - TeV electrons will produce a GeV component, but are not energetic enough to upscatter the CMB photons to TeV energies. Therefore, no TeV emission is expected in the EC/CMB model, and any hard, steady (i.e. of jet origin) TeV detection from 3C 273, will rule out the EC/CMB scenario. Note that the potential contribution of the steep blazar spectrum (EGRET photon index 3.2 or steeper, when the blazar is at its frequent low state; von Montigny et al. 1997) is expected to be significantly below the 50 hour sensitivity limit of HESS, with the possible exception of high blazar states when the EGRET photon index hardens to 2.2 (von Montigny et al., 1997).
2.2.2 Constraints on the synchrotron hypothesis
What if the optical - X-ray emission is also synchrotron in nature? In this case, the same multi - TeV electrons that produce this emission will also produce a TeV energy EC/CMB component at a level that scales with (see eq. 2). Absorption by the extragalactic background light (EBL) will reduce the TeV level and steepen its spectrum. There is already a flux limit at 0.28 TeV (plotted in figure 2) obtained by a shallow 3.9 hours HESS observation (Aharonian et al. 2005), assuming an absorbed photon index of . To go from the emitted unabsorbed spectrum to the observed absorbed one, we adopt the baseline analytical expression for the 0.2 - 2.0 TeV absorption optical depth of Stecker & Scully (2006), scaled to agree at 0.28 TeV with the EBL profile (P0.45, as described by Aharonian et al. 2006) estimated through HESS observations of blazars H2356-309 and 1ES 101-232 at of 0.165 and 0.186 respectively.
We plot in figure 2 with short dashed lines the SED for . The red line is due to the electrons that produce the radio - IR emission, the blue line due to the electrons producing the optical - X-ray emission in the synchrotron interpretation, and the green line corresponds to the observed TeV flux, after the EBL absorption has been taken into account. As can be seen, in the synchrotron X-ray scenario the upper limit on has to be reduced to not to overproduce the existing HESS TeV upper limit. A line is also plotted in figure 1, with the area shaded below it being excluded.
The HESS flux limit that can be achieved with longer exposure times can been calculated from the 3.9 hour exposure limit, assuming that the achievable flux limit scales with one over the square root of the exposure time. For a fixed synchrotron flux, and assuming equipartition, the EC/CMB flux , where is the X-ray spectral index. The lowest jet that can be detected for a given exposure time, therefore, is
| (3) |
For a 50 hour HESS observation, (long dashed lines in figure 2, same interpretation as before). Therefore, for HESS will be able to detect the TeV emission predicted by the optical - X-ray synchrotron interpretation.
2.3 The combined constraints
We present now the combined constraints on the two hypotheses in terms
of the possible outcomes of GLAST - HESS observations:
() We detect neither GeV nor TeV jet emission. This means that
. We can impose no constraints
on the synchrotron scenario. However, the EC/CMB scenario
is strongly disfavored due to the extraordinary jet power requirements implied by the low value of .
() We detect the
jet GeV emission, at a low level that corresponds to .
We will not be able to detect the corresponding TeV
emission, because it will be below the 50 hour HESS sensitivity limit.
In this regime, again, we cannot constrain the synchrotron scenario, but
the low factors still disfavor the EC/CMB scenario.
() We detect the
jet GeV emission, at a high level that corresponds to .
Observationally, this is the most feasible case,
not only because the jet GeV flux
is high, but also because it is close to the EGRET limit, and the
conditions for detecting its hard steady emission during a low blazar
state are the most favorable.
This is also the most interesting case, because TeV observations will
confirm or reject the synchrotron model: The GeV flux implies a TeV
flux in the synchrotron scenario, that is
above the 50 hour HESS sensitivity limit.
If the anticipated TeV
flux is observed, this will be a strong confirmation of the synchrotron model.
If not, then the synchrotron hypothesis for the X-ray emission is rejected.
We close this section by discussing the lower limit of the EED producing the radio-IR emission in the synchrotron X-ray hypothesis. This is constrained by the requirement that the low energy tail of the EC/CMB GeV-peaking component does not produce any X-ray emission, or, more conservatively, does not dominate over the extended weak X-ray jet emission (the cross in figure 2 represents the jet X-ray flux, excluding the bright knots A and B). This requires that , and becomes relevant for : for and the X-ray emission produced through EC/CMB overproduces the, presumably synchrotron, extended X-ray emission. The above constraint does not affect the GHz radio emission, which requires substantially more energetic electrons (). A similar limit on was found by Jorstad & Marscher (2004) for the quasar 0827+243.
3 Conclusions and Discussion
Although it is agreed that the radio-IR spectrum of powerful extended quasar jets is synchrotron radiation, the X-ray emission mechanism (synchrotron or EC/CMB) is a matter of active debate. The synchrotron interpretation requires a second population of electrons with energies at least up to TeV, while the EC/CMB implies a cutoff of the EED at sub - TeV energies. In both cases, the EED responsible for the radio to IR synchrotron emission will produce a hard and steady GeV component. For the nearby 3C 273, the existing EGRET limits constrain the Doppler factor of the large scale jet to and GLAST observations during the frequent, low level, steep spectrum blazar states can push this limit down to . Such low values for make application of the EC/CMB model problematic (Uchiyama et al., 2006). Because the Universe is practically transparent for GeV photons, GLAST observations could provide upper limits on for sources at higher .
Recent HESS detections of two blazars at and (Aharonian et al. 2006) suggest that the Universe is sufficiently transparent to allow the detection of TeV emission from 3C 273. Such emission is not expected in the EC/CMB model, because the available electrons are not energetic enough to produce any TeV photons via CMB photon upscattering. Detection, therefore, of any steady jet TeV emission will argue against the EC/CMB model for the optical-X-ray emission of 3C 273. The multi-TeV electrons required from the synchrotron interpretation do produce such TeV emission at a level (eq. 2). Existing HESS observations reject synchrotron models with . Coordinated GLAST - TeV observations will be able to confirm or reject the synchrotron hypothesis for . Note that, although a GeV detection close to the GLAST sensitivity limit will only provide limited spectral information, a detection higher in flux by a factor at the important regime, will provide sufficient counts to measure the GeV spectral slope and identify the source of the GeV emission (blazar or extended jet).
The actual TeV fluxes may be higher than our estimates. In the synchrotron case, the anticipated TeV flux increases if the optical - X-ray emission is more beamed than the radio. This could be the case if the X-rays come from a faster moving spine. A thinner optical spine, compared to the radio jet width, has been observed in 3C 273 by Jester et al. (2005). Also, if the jet gradually decelerates (Sambruna et al., 2001; Georganopoulos & Kazanas, 2004), it is possible that the X-ray emission that comes mostly from the first two knots A and B is more beamed than the radio-IR component that peaks further downstream. For a decelerating jet in the context of the EC/CMB model, the Doppler factor of the outer jet must be sufficiently low, , not to overproduce the extended X-ray flux (cross in fig 2).
Our work is based on the assumption of energy equipartition between radiating electrons and magnetic field. As can be seen from eq. (2), if the actual conditions deviate from equipartition with the higher (lower) magnetic field, the anticipated GeV-TeV fluxes will have to be scaled down (up) by the square of the same factor and the observational limits on scaled up (down) by the square root of the same factor. In the EC/CMB interpretation the EED must extend down to . Direct access to this energy range requires low frequency, high resolution radio telescopes such as the future Long Wave Array (LWA) (Harris, 2006), that will be able to probe the radio emission produced by the low energy tail of the EED. We hope this work will motivate TeV (HESS, VERITAS, MAGIC) observations, which together with GLAST GeV observations, hold the potential of identifying the X-ray energy emission process of large scale quasar jets.
References
- Aharonian et al. (2005) Aharonian, F. et al. 2005, A&A, 441, 465
- Aharonian et al. (2006) Aharonian, F. et al. 2006, Nature, 440, 1018
- Arshakian & Longair (2004) Arshakian, T. G., & Longair, M. S. 2004, MNRAS, 351, 727
- Celotti et al. (2000) Celotti, A., Ghisellini, G., & Chiaberge, M. 2001, MNRAS, 321, L1
- Chartas et al. (2000) Chartas, G., et al. 2000, ApJ, 542, 655
- Conway et al. (1993) Conway, R. G.,, Garrington, S. T., Perley, R. A., & Biretta, J. A 1993, A&A, 267, 347
- Courvoisier (1998) Courvoisier, T. J.-L. 1998, A&ARv, 9, 1
- D’Elia, Padovani, & Landt (2003) D’Elia, V., Padovani, P., & Landt, H. 2003, MNRAS, 399, 1081
- Dermer & Schlickeiser (1994) Dermer, C. D., & Schlickeiser, R. 1994, ApJS, 90, 945
- Dermer & Atoyan (2004) Dermer, C. D., & Atoyan, A. M. 2004, ApJ, 611, L9
- Fanaroff & Riley (1974) Fanaroff, B. L. & Riley, J. M. 1974, MNRAS, 176, 31
- Georganopoulos & Kazanas (2004) Georganopoulos, M., & Kazanas, D. 2004, ApJ, 604, L81
- Hardcastle et al. (2002) Hardcastle, M. J., Worrall, D. M., Birkinshaw, M., Laing, R. A., & Bridle, A. H. 2002, MNRAS, 334, 182
- Hardcastle (2006) Hardcastle, M. J. 2006, MNRAS, 366, 1465
- Hardcastle & Croston (2006) Hardcastle, M. J., & Croston, J. H. 2006, MNRAS, 363, 649
- Harris & Krawczynski (2002) Harris, D. E., & Krawczynski, H. 2002, ApJ, 565, 244
- Harris et al. (2004) Harris, D. E., Mossman, A. E., & Walker, R. C. 2004, ApJ, 615, 161
- Harris & Krawczynski (2006) Harris, D. E., & Krawczynski, H. 2006, ARA&A, in press, also in astro-ph/0607228
- Harris (2006) Harris, D. E. 2006, ‘From Clark Lake to the Long Wavelength Array’, ASP Conference Series, Vol. 345, Edited by N. Kassim, M. Perez, M. Junor, and P. Henning, 254
- Jester et al. (2005) Jester, S., Röser, H.-J., Meisenheimer, K., Perley, R. 2005, A&A, 431, 477
- Jester et al. (2006) Jester, S., Harris, D. E., Marshall, H. L., & Meisenheimer, K. 2006, ApJ, 648, 900
- Jorstad & MArscher (2004) Jorstad, S. G. & Marscher, A. P. 2004, ApJ, 614, 615
- Kataoka & Stawarz (2005) Kataoka, J., & Stawarz, L. 2005, ApJ, 622, 797
- Kraft et al. (2005) Kraft, R. P., Hardcastle, M. J., Worrall, D. M., & Murray, S. S. 2005, ApJ, 622, 149
- Lind & Blandford (1985) Lind, K. R., & Blandford, R. D. 1985, ApJ, 295, 358
- Marshall et al. (2005) Marshall, H. L., et al. 2005 ApJS, 156, 13
- Perlman & Wilson (2005) Perlman, E. S. & Wilson, A. S. 2005, ApJ, 627, 140
- Sambruna et al. (2001) Sambruna, R. M., Urry, C. M., Tavecchio, F., Maraschi, L., Scarpa, R., Chartas, G., & Muxlow, T. 2001, ApJ, 549, L161
- Sambruna et al. (2004) Sambruna, R. M.. Gambill, J. K., Maraschi, L., Tavecchio, F., Cerutti, R., Cheung, C. C., Urry, C. M., & Chartas, G. 2004, ApJ, 608, 698
- Schwartz et al. (2000) Schwartz, D. A., et al. 2000, ApJ, 540, L69
- Stawarz, Sikora, & Ostrowski (2003) Stawarz, L., Sikora, M., & Ostrowski, M. 2003, ApJ, 597, 186
- Stecker & Scully (2006) Stecker, F. W., & Scully, S. T. 2006, ApJ, in press, also in astro-ph/0608110
- Tavecchio et al. (2000) Tavecchio, F., Maraschi, L., Sambruna, R., & Urry, C. M. 2000, ApJ, 544, L23
- Tavecchio et al. (2006) Tavecchio, F., Maraschi, L., Sambruna, R. M., Gliozzi, M., Cheung, C. C., Wardle, J. F. C., & Urry, C. Megan 2006, ApJ, 641, 732
- Uchiyama et al. (2006) Uchiyama, Y. et al. 2006, ApJ, 648, 910
- Unwin et al. (1985) Unwin, S. C., Cohen, M. H., Biretta, J. A., Pearson, T. J., Seielstad, G. A., Walker, R. C., Simon, R. S., & Linfield, R. P. 1985, ApJ, 289, 109
- von Montigny et al. (1997) von Montigny, C. et al. 1997, ApJ, 483, 161
- Wardle & Aaron (1997) Wardle, J. F. C., & Aaron, S. E. 1997, MNRAS, 286, 425