A Search for Low Surface Brightness Structure Around Compact Narrow Emission Line Galaxies11affiliation: Based on observations obtained at the Canada-France-Hawaii Telescope which is operated by the National Research Council of Canada, the Institut National des Sciences de l’Univers of the Centre National de la Recherche Scientifique of France, and the University of Hawaii.
Abstract
As the most extreme members of the rapidly evolving faint blue galaxy population at intermediate redshift, the compact narrow emission line galaxies (CNELGs) are intrinsically luminous () with narrow emission linewidths ( 125 km s-1). Their nature is heavily debated: they may be low-mass starbursting galaxies that will fade to present-day dwarf galaxies or bursts of star formation temporarily dominating the flux of more massive galaxies, possibly related to in situ bulge formation or the formation of cores of galaxies. We present deep, high-quality () images with CFHT of 27 CNELGs. One galaxy shows clear evidence for a tidal tail; the others are not unambiguously embedded in galactic disks. Approximately 55% of the CNELGS have sizes consistent with local dwarfs of small-to-intermediate sizes, while 45% have sizes consistent with large dwarfs or disks galaxies. At least 4 CNELGs cannot harbor substantial underlying disk material; they are low-luminosity galaxies at the present epoch (M). Conversely, 15 are not blue enough to fade to low-luminosity dwarfs (). The majority of the CNELGs are consistent with progenitors of intermediate-luminosity dwarfs and low-luminosity spiral galaxies with small disks. CNELGs are a heterogeneous progenitor population with significant fractions (up to 44%) capable of fading into today’s faint dwarfs (), while 15 to 85% may only experience an apparently extremely compact CNELG phase at intermediate redshift but remain more luminous galaxies at the present epoch.
Subject headings:
galaxies: evolution — galaxies: high-redshift1. Introduction
Cosmological lookback time is one of the most powerful tools available to study galaxy evolution. To see the phases at which galaxies build their stellar populations rapidly, we look back in time to find dramatic starbursts. However, we must learn to identify the present-day galaxy population of which these starbursts are the progenitors. In this paper, we work toward a broad understanding of the role of rapid star formation in the evolution of galaxies by investigating the nature of some of the most extreme starbursting galaxies at intermediate redshift, the compact narrow emission-line galaxies (CNELGs). Although the CNELGs are rare in the intermediate-redshift universe ( Mpc-3; Koo et al., 1994), starburst timescales are much less than a Hubble time. Thus, starbursting galaxies may have a relatively low space density even if most galaxies go through such a phase.
Originally defined as stellar in ground-based images of moderate resolution ( FWHM), CNELGs are intrinsically luminous star-forming galaxies () with extremely small half-light radii () and narrow emission line widths in integrated spectra ( km s-1; Koo et al., 1995; Guzmán et al., 1996). The small sizes and narrow emission lines of these galaxies led Koo et al. (1995) to identify the CNELGs as possible starbursting objects that will fade by many magnitudes to become present-day low-luminosity dwarf elliptical (dE) galaxies. However, these authors also note an alternative explanation: that CNELGs are starbursts embedded in more massive galaxies, surrounded by an old stellar population. The two CNELGs with detailed abundance measurements in the literature are more metal-enriched in their gas phase than the mean stellar metallicities of dwarf galaxies (Kobulnicky & Zaritsky, 1999), potentially supporting this hypothesis as we consider further in §3.2.1. In addition, kinematic linewidths can underrepresent the masses of compact galaxies (Kobulnicky & Gebhardt, 2000; Barton & van Zee, 2001; Pisano et al., 2001). If CNELGs are starbursts embedded in more massive galaxies, they may be building stellar mass in central components such as bulges or cores forming in situ (Kobulnicky & Zaritsky, 1999; Hammer et al., 2001). They may represent the formation of a separate class of bulges known as “pseudobulges” or “exponential bulges” that have properties consistent with in situ formation from the infall of disk gas and subsequent central formation (e.g., Carollo, 1999; Kormendy & Kennicutt, 2004).
High-resolution images of the CNELGs with the Hubble Space Telescope reveal lumpy high surface brightness structures within the starbursts in many cases (Guzmán et al., 1998). However, the lack of sensitivity to lower surface brightness features could hamper efforts to find older stellar populations in which CNELGs might be embedded.
Here, we present deep ground-based imaging designed to observe the low surface brightness flux distribution of CNELGs. To interpret the data, the approach we take is to compare the properties of CNELGs to the various specific models of the nature of CNELGs, focusing on one in which they are dwarf elliptical galaxies undergoing a period of rapid star formation and one in which they are starbursts in the centers of galactic disks. In §2, we describe the CNELG sample and the data reduction. §3 is a detailed comparison of the CNELG surface brightness distributions to starbursting dwarfs, disk galaxies, elliptical galaxies, and EA galaxies. In §4 and §5, we discuss the results and list our conclusions. We adopt a cosmology in which , , and H km s-1 Mpc-1.
2. The Sample and Data Reduction
We study a subset of CNELGs that have existing Keck spectroscopy in the literature. The parent sample originates from the photographic plate study of Kron (1980), including the fields SA 57 and SA 68 observed to 50% completeness depths of and (see Kron, 1980; Koo, 1986; Koo & Kron, 1988; Munn et al., 1997). We reobserve the fields in the band for 6-7 hours in queue mode with the 12k camera at the Canada-France-Hawaii Telescope (CFHT) during optimal seeing conditions (Martin et al., 2002). The new data are roughly ten times deeper, with roughly half the seeing disk of the original plate observations.
We exclude objects from the analysis that are too close the edges of the detector, galaxies that are next to very bright stars, and one unresolved galaxy with low-quality spectroscopy that would be much too intrinsically luminous at its tentative redshift. The final sample of observed galaxies includes 27 CNELGs and 3 additional compact galaxies. Of the 27 CNELGs, 19 have high-quality redshift identifications, 5 have one-line redshifts, and 3 have low-quality redshifts.
The deep -band images of the CNELGs are dithered pointings of 600-second duration spread over several nights. We list the total exposure times of high-quality data for each object in Table 1. The seeing FWHM of the final combined images ranges from to . The preliminary data reduction was conducted with the Elixir pipeline processing software at CFHT (Magnier & Cuillandre, 2004). Nominally, the flat fields allow photometric accuracy to 2%. The photometric solutions provided by Elixir were verified by comparing the new results with previous observations of these objects. Further, for SA57, we re-computed the photometric solutions by comparing with -band data in Majewski et al. (1994). While there was good agreement with the Elixir results, we use the revised calibration for the object photometry we present for this field. Our post-processing with the MSCRED package in IRAF111IRAF is distributed by the National Optical Astronomy Observatories. includes coordinate solutions, image projection, and combination. Finally, we subtract the background using a large mesh size with SExtractor (Bertin & Arnouts, 1996). The typical 1- surface brightness limits for the combined images are 28 mag arcsec-2.
Table 1 lists the basic properties of the sample. We use the measured mR from our data, but construct rest-frame colors and MB from a compilation of the photographic and magnitudes and spectroscopic redshifts: from the Munn et al. (1997) study for the three “compact galaxies”; from the series of papers on deep QSO surveys in SA 57 and SA 68 (Koo, Kron, & Kudworth 1986; Koo & Kron 1988; Trevese et al. 1989, 1994; and Bershady et al. 1998) for most of the CNELGs in SA57; and from previously-unpublished catalogs related to the Munn et al. survey for the remainder. We use the transformations from Majewski (1992) to convert observed to observed , noting that these transformations are strictly relevant to stellar spectral-energy-distribution (SEDs) in the rest-frame. Using galaxy SED templates from Coleman, Wu & Weedman (1980) and a starburst template from Bruzual & Charlot (2003), we interpolate between templates to match the observed-frame colors and use the interpolated templates to derive rest-frame colors and MB. A comparison between rest-frame calculated here and in Guzman et al. (1998) yields the same mean values for 8 objects, but a significant dispersion of 0.1 mag.222The Guzman et al. study uses the same redshifts, but include the photographic and bands, and in some cases this was augmented by HST/WFPC-2 colors, in their analysis. We adopt this as an estimate of the uncertainty in deriving rest-frame colors, which comes into play when we discuss the possible fading of these sources in §3.1.1.
2.1. Surface Brightness Distributions of the Compact Narrow Emission Line Galaxies
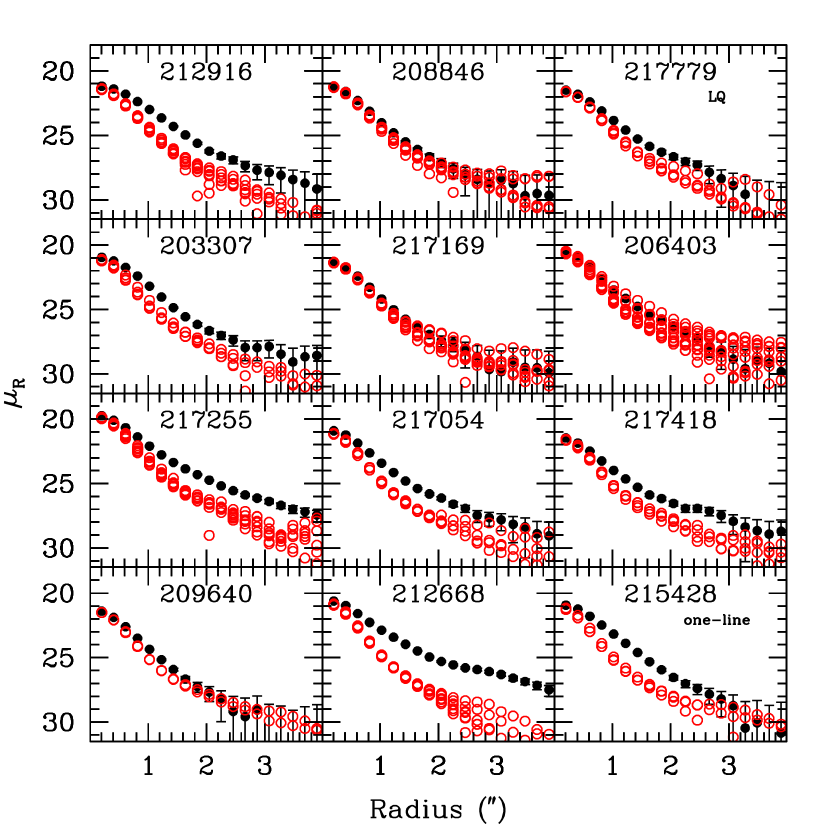
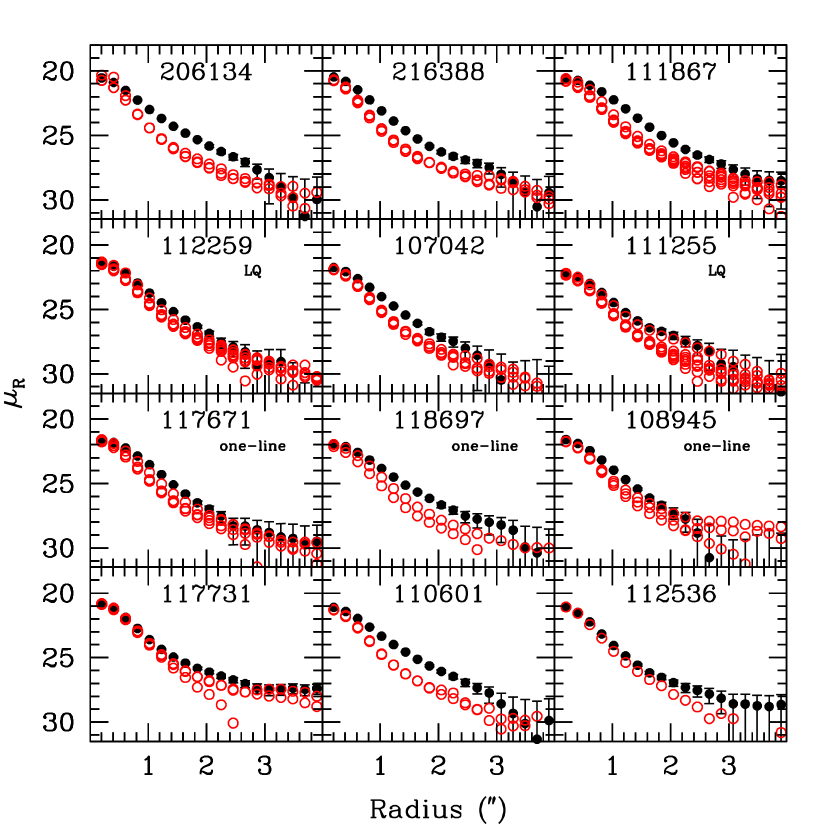
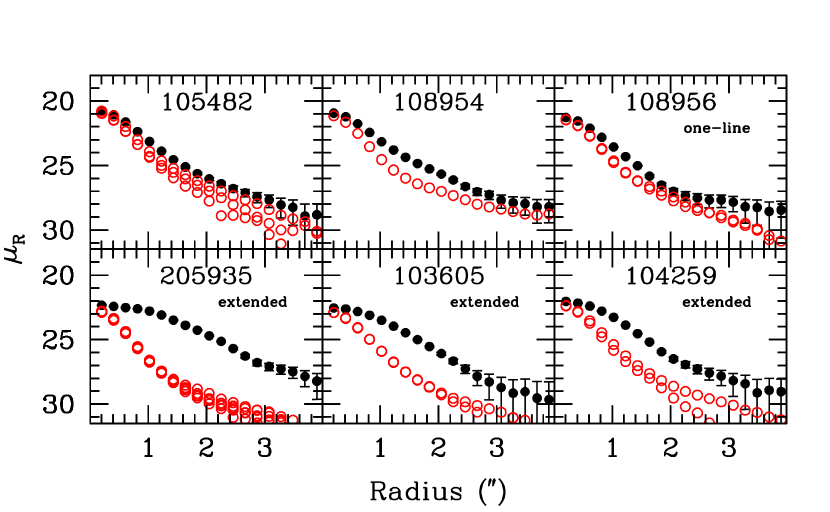
Fig. 1 shows the surface brightness profiles of the final sample (filled circles) based on circular aperture photometry with SExtractor; the smaller open circles are the profile(s) of a nearby star(s) scaled to the central surface brightness of the CNELG. Several CNELGs are unresolved or very nearly unresolved in the images. As we demonstrate below, most of these unresolved galaxies are probably intrinsically small objects. Fig. 2 shows contour plots of the CNELGs. The CNELGs are clearly a heterogeneous population of objects. Many of the CNELG profiles resemble the stellar profiles in the inner regions, suggesting that the inner parts of the galaxies are largely unresolved. Therefore, the sensitivity of our imaging observations to detect underlying disks relies on the analysis of the faint outskirts of the galaxies, where the depth of our observation must be combined with careful data reduction and modeling to determine the types of extended flux to which we are sensitive.
Background galaxies have a large filling factor in deep images of the universe. A superposition of a CNELG on a low surface brightness background (or foreground) galaxy could lead to the misidentification of structure in the outskirts of the CNELG. We use a simple Monte Carlo simulation to explore the probability that this effect is significant. The superposition would not be evident in even high-quality spectra because the high surface brightness CNELG dominates the flux. We add 16 flux-boosted, artificially-redshifted versions of NGC 205 (see § 3.1 below) to randomly drawn positions in the images and count the objects that deviate from the profile of a simulation added to blank sky. We do not count obvious superpositions where the “artificial CNELG” (NGC 205) is separated from an adjacent but distinct object; we count only those that we would likely mistake for underlying structure. For 480 simulated fake CNELGs, we find an average rate of 23% for superpositions, where 15% are obvious superpositions that would probably never have been identified as CNELGs. Of the remaining CNELG simulations, 8.6% are accidental superpositions that would not have been obvious. Thus, our analysis must allow for the fact that on average we expect that of the 27 CNELGs are superpositions on extended, low surface brightness background galaxies.


3. Scenarios for the Nature of the CNELGs
The defining characteristics of CNELGs are their extremely compact sizes yet large blue luminosities, blue optical colors, and strong and narrow line emission. Studies of these objects and of similar luminous compact blue galaxies reveal a heterogeneous population of objects including some that probably fade to become dwarfs and some star forming disk galaxies that fade to become luminous but sub-L⋆ systems, just below the “knee” in the luminosity function. They exhibit a range of emission linewidths, a range of stellar masses based on modeling of near-infrared fluxes, and a range of morphologies (Koo et al., 1994, 1995; Guzmán et al., 1996; Phillips et al., 1997; Guzmán et al., 1997, 1998; Hammer et al., 2001; Guzmán et al., 2003). Here, we scrutinize the surface brightness profiles of the CNELG population from the SA57 and SA68 fields, comparing their surface brightness profiles and colors to models based on the hypotheses that some CNELGs are bursting dwarf galaxies, starbursts in the center of disk galaxies (possibly galactic bulges in formation), the cores of elliptical galaxies in formation, and/or the progenitors of E+A galaxies, which are galaxies with strong post-starburst spectra.
3.1. The bursting dwarf hypothesis
The bursting dwarf hypothesis posits that the luminous, compact star-forming galaxies observed at intermediate redshift are the progenitors to local dwarf galaxies. In this scenario, the distant bursting dwarfs deplete their gas reservoirs in a violent burst of star formation, fading to become the dwarf elliptical galaxies (dEs) observed in abundance in the local universe. This interpretation of the CNELGs is compelling because their emission linewidths and sizes are appropriate for dwarfs and not for more luminous galaxies (e.g., Guzmán et al., 1996). Here, we begin with the model that CNELGs actually are dEs during a bursting phase and test the consistency of that picture.
Formed stellar populations generally cannot shrink in size with time. Thus, if CNELGs are starbursting dwarf galaxies that ultimately fade to become dwarfs in the local universe, the sizes of CNELGs are probably similar to or smaller than their counterpart dwarfs in the local universe. Supporting this conclusion, the CNELGs themselves are observed to have radial color gradients (Guzman et al. 1998), typically with blue cores. If CNELGs fade to dEs, the aging stellar populations in local dEs do not contradict the conclusion that they do not shrink with time. In particular, dEs exhibit only mild systematic gradients in color or stellar population (e.g., Vader et al., 1988; Jerjen, Binggeli, & Freeman, 2000; Barazza, Binggeli, & Jerjen, 2003; van Zee, Barton, & Skillman, 2004); if anything, most are slightly (0.1 mag.) redder in their centers than their outskirts. Therefore, we assume that CNELGs are smaller than or equal to the sizes of the objects to which they ultimately fade.
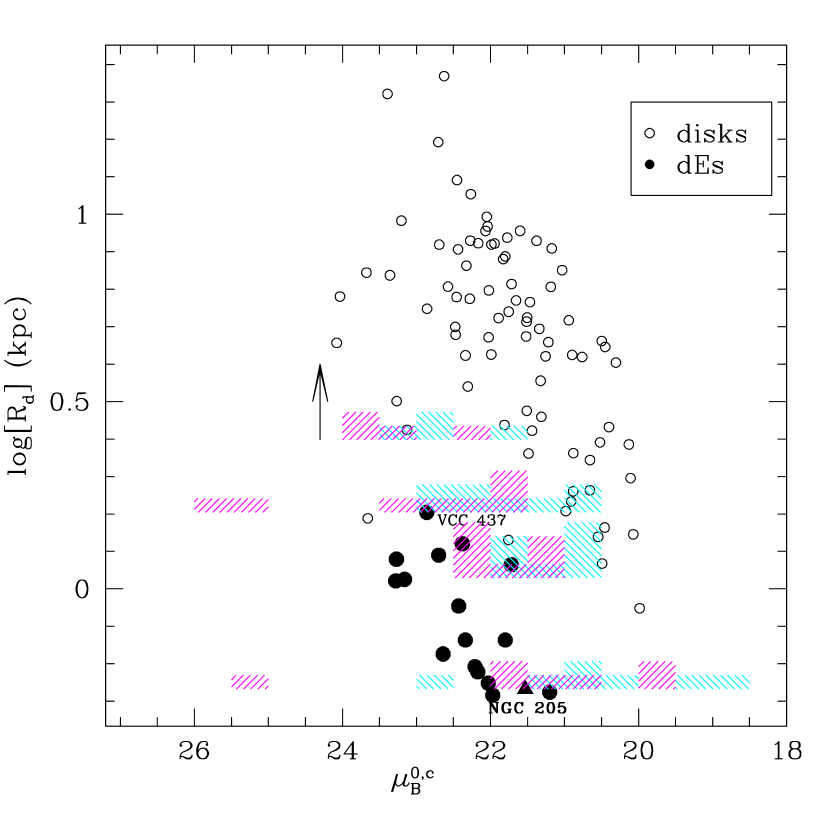
To test the hypothesis that CNELGs are the progenitors of dwarfs, we compare their sizes directly to examples of both compact and more extended local dEs. We use this analysis to argue that objects that are larger than dE’s do not fade to become dE’s by the present epoch, taking examples from a wide range of small and large dE’s. The fiducial example of a small dwarf CNELG analog is NGC 205, a dwarf companion to M31. The Virgo cluster holds a more varied population of dEs including galaxies that are much larger than NGC 205. Fig. 3 shows the central surface brightnesses and scale lengths of NGC 205,333 Observations of NGC 205 were obtained with the MOSAIC camera on the WIYN 0.9-meter telescope on 2003 December 19. The observations consisted of three 300 s exposures in the B-band; the observations were dithered substantially to fill in the interstitial gaps. While the night was non-photometric, photometric calibration was obtained by comparison with the integrated magnitudes tabulated in Mateo (1998). and a set of Virgo dEs (van Zee, Barton, & Skillman, 2004). The shaded regions show the half-width at half maximum (HWHM) of the range of seeing disks in the CFHT data at different redshifts. Although this figure serves as a guide to the sizes of these objects, whether or not we can resolve these objects depends on their luminosities and surface brightness profiles. We explore these questions in more detail below, using simulations added to the data.

Using a rest-frame B-band image of NGC 205 from the WIYN 0.9-meter telescope and B-band images of elongated Virgo dEs from van Zee, Barton, & Skillman (2004), we evaluate the bursting dwarf hypothesis by comparing the surface brightness profiles of CNELGs to artificially redshifted versions of dwarf galaxies. To construct the model bursting dwarfs, we boost the integrated flux of the model to the measured -band apparent magnitude of the CNELG with which we are comparing. We re-compute the physical scale of the image at the redshift of the CNELG and rebin the data to the resolution the CFHT data. We convolve with the point-spread function using a nearby star. We simulate the appropriate Poisson noise for the object flux and add the object to the frames near the relevant CNELGs. We measure surface brightness profiles with a procedure that is identical to that used for the CNELGs themselves.
Figures 4 and 5 show examples of the resulting boosted-dwarf surface brightness profiles. The red points are nearby stars boosted to match the central surface brightness of the CNELG or artificial dwarf. Fig. 4 includes examples at the highest and lowest redshifts of the sample (111867 and 209640, respectively), and 212916 at the median redshift, . The figures highlight the fact that our discriminatory power varies as a function of redshift. For example, our data resolve NGC 205 at but it is essentially unresolved at . However, we would be able to resolve VCC 437 at any redshift in our range.
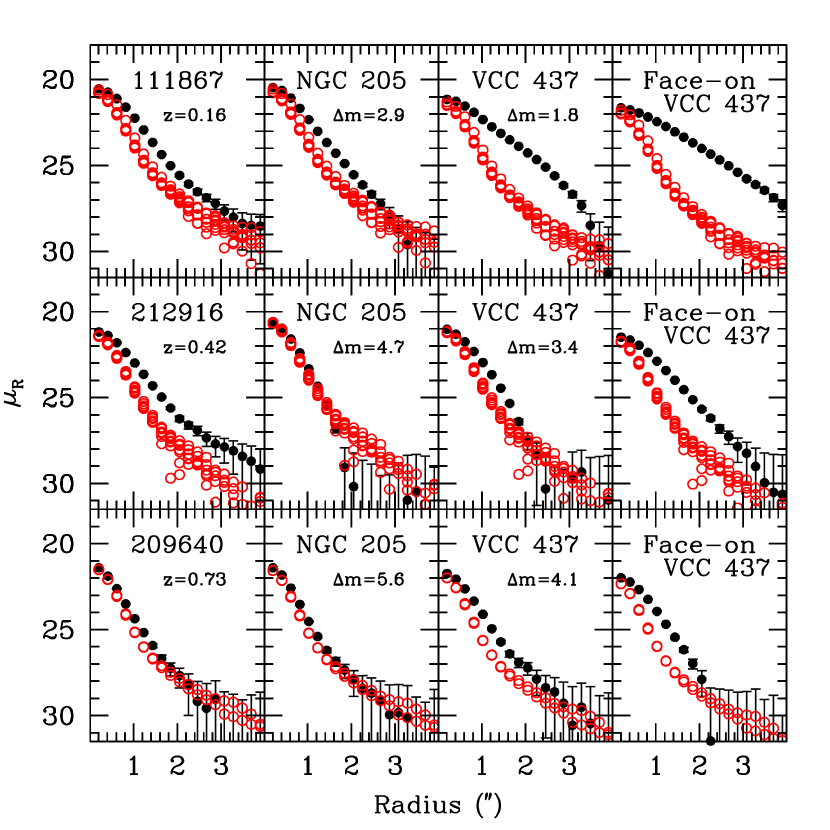

In Fig. 4, 111867 and 209640 are similar to NGC 205, but the remaining galaxies are larger or have detected flux extending to larger radii. Fig 5 shows that 212668 is more extended than even our model version of the largest Virgo dE from van Zee, Barton, & Skillman (2004), VCC 437, viewed as though it were a face-on disk. It has an exponential scale length of kpc that is large enough to fall within the size range of small disk galaxies. Similar figures for the remaining galaxies indicate that of the CNELGs, 7/27 (26%) are smaller than or similar in size to NGC 205, 8/27 (30%) are between NGC 205 and VCC 437 and thus plausible typical dEs, 8/27 (30%) are similar in spatial extent to VCC 437 and thus consistent with a large dwarf or small spiral. 4/27 (15%) are more extended than even the largest dE in the van Zee, Barton, & Skillman (2004) sample. We list these broad classifications in Table 1 and use them to group the CNELGs hereafter.
To compute the true amount of (integrated) -band luminosity boost required to match the integrated -band flux of the CNELG, we use the interpolated template spectral energy distribution corresponding to the rest-frame color of the CNELG to generate k-corrections for the hypothetical bursting dwarf (see §2). For NGC 205, the required boosts range from 1.5 to 6.0 magnitudes. The Virgo dEs fall into a more reasonable range. For the most luminous dE, VCC 1261, the required burst luminosity boosts satisfy ; for the least luminous dE of the van Zee, Barton, & Skillman (2004) sample, the requirements are in the range . Below, we examine the constraints on luminosity fading for individual CNELGs available from their rest-frame colors.
3.1.1 Fading Limits for the CNELGs
Spectral synthesis models provide a means of estimating an upper limit to the amount that CNELGs have faded to the present day. Fig. 6 shows the amount of fading and the composite colors for Bruzual & Charlot (2003) models with added starbursts. Adopting a Chabrier (2003) stellar initial mass function and solar metallicity, we assume two episodes of star formation that are bursts of equal duration. The second burst occurs 8 Gyr after the first with an amplitude of 0%, 1%, 50%, or 100%. On the plot, time is measured since the start of the second burst. More rapid bursts reach higher fractional peak luminosities.
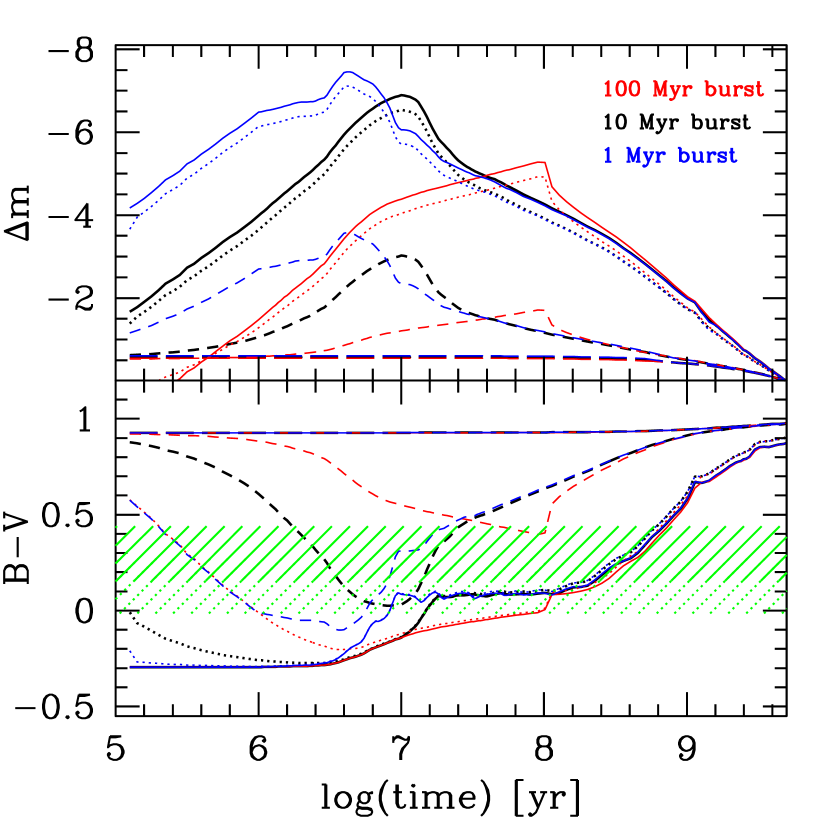
For global bursts of star formation, the burst timescales must be the dynamical timescales. With central velocity dispersions km s-1 (Geha, Guhathakurta, & van der Marel, 2003; van Zee, Skillman, & Haynes, 2004) and disk scale lengths kpc (e.g., van Zee, Barton, & Skillman, 2004), the dynamical timescales of the Virgo dEs are always Myr and usually Myr. Thus, we consider models in which the bursts last 10 Myr and 100 Myr as typical timescales for global starbursts in a dE. For comparison, estimated dynamical timescales for CNELGs yield a mean of 20 Myr within the half-light radius as observed at intermediate redshift.444 We use , which comes from adopting (Binney & Tremaine, 1987), and the dynamical mass formula (Guzmán et al., 1996) assuming . The values of and are from Koo et al. (1994, 1995) and Guzmán et al. (1996). More localized bursts of star formation may last for shorter amounts of time. Thus, we include 1 Myr bursts to encompass this possibility. We note that abundance patterns in nearby dwarfs appear to rule out star formation histories that involve extremely rapid formation of 100% of the stellar population: such a scenario would result in alpha-enhanced dwarfs, while dEs typically have solar or sub-solar [/Fe] ratios (Geha, Guhathakurta, & van der Marel, 2003; van Zee, Barton, & Skillman, 2004), indicating that their dominant stellar population was not formed in a single rapid starburst. In any case, we find that the derived fading limits are insensitive to choice of burst timescale in the explored range.
Our inability to correct for extinction accurately, on an object-by-object basis, is the most important systematic error of this analysis. The average measured , derived for 7 CNELGs by Kobulnicky & Zaritsky (1999) and Hoyos et al. (2004), is 0.17. However, if the CNELGs are starbursting dwarfs that resemble strongly star-forming dwarfs in the nearby universe, their reddening may be minimal. Thus, we compute the expected fading of CNELGs assuming both no dust and .
As Fig. 6 shows, objects that will fade by magnitudes () in the 5 Gyr after the burst are bluer than the observed CNELGs for any of these scenarios, unless the rest-frame colors are corrected for dust. A correction of increases the allowed fading to 3-4 magnitudes in most cases, and to magnitudes in the very bluest 3 CNELGs.555As noted in Table 1, the three bluest CNELGs are not necessarily the smallest. One is consistent with the size of NGC 205, but 2/3 are consistent only with the much larger VCC 437. Extending the amount of fading time to the lookback time for the highest redshift of the sample allows 4 magnitudes of fading and decreasing it to the lowest redshift decreases the allowed fading to 3 magnitudes. Reducing the assumed metallicity to 0.02 Z☉, which may be appropriate for the smallest dwarfs but is not warranted by the small amount of existing data for CNELGs (Kobulnicky & Zaritsky, 1999), decreases the fading allowed in 5 Gyr to 2.5 magnitudes.
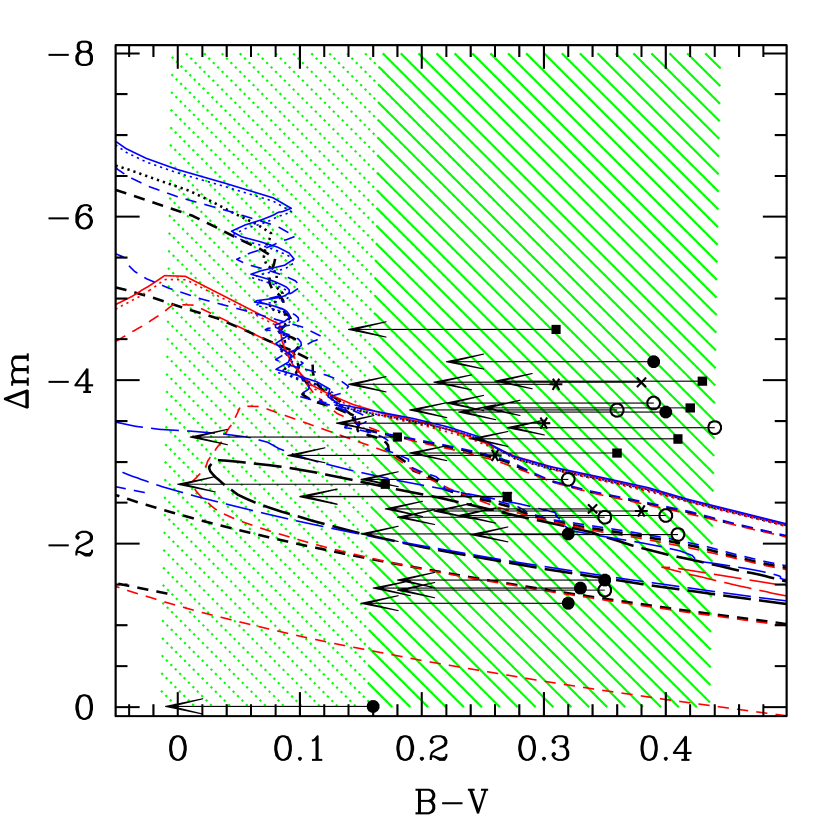
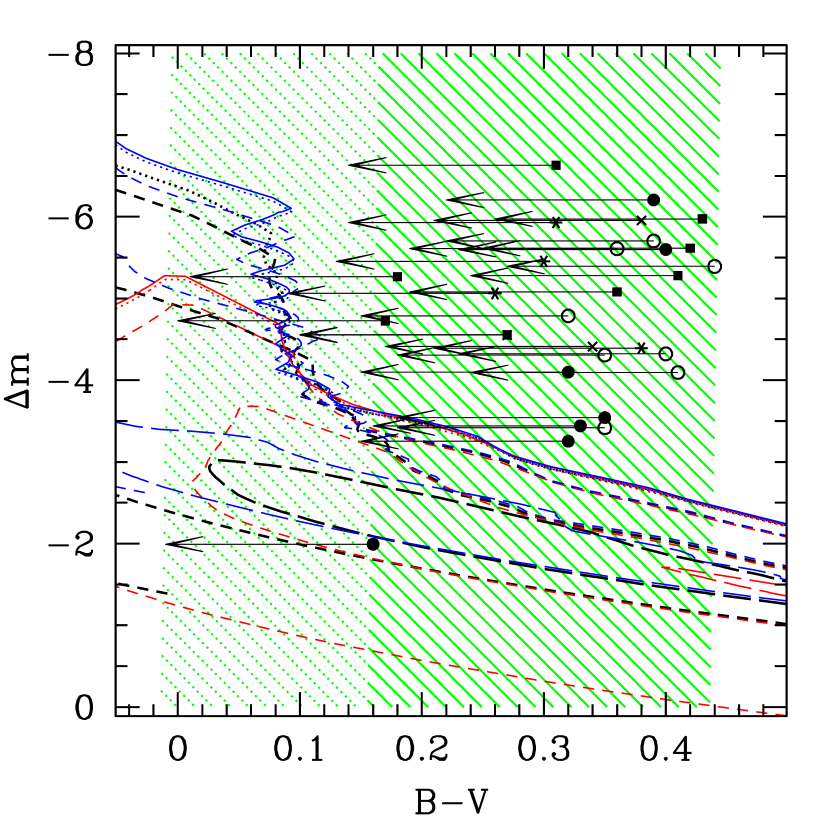
Despite the effects of burst duration on the peak luminosity boost allowed by a given burst of star formation, the relationship between the total amount a starburst can fade and the color of the galaxy is nearly independent of the timescale of the burst. In Fig. 7, we plot this relationship for the models shown in Fig. 6. The figures show rest-frame color as a function of number of magnitudes the burst will fade by the time 5 Gyr has elapsed since burst. The points show the CNELGs and the additional luminous compact blue galaxies (crosses). We plot each point at its observed rest-frame color on the x-axis, and at the number of magnitudes the CNELG needs to fade to become the brightest dwarf in the van Zee sample, VCC 1261 with M (left), and the number of magnitudes the CNELG needs to fade to become the faintest dwarf in the van Zee sample, VCC 1743, with M (right). Arrows indicate the intrinsic rest-frame if .
We list the true upper limit to the amount of fading allowed by this analysis in Table 1 calculated using the lookback time to each object (set to 5 Gyr in Fig. 7), both with and without reddening. The upper limits correspond to the position on the solid line for the color of the galaxy in Fig. 7 if the models were shifted each time to normalize at the lookback time of the redshift of the CNELG. For example, renormalizing the fading dwarf to correspond to a fading time of 6.43 Gyr, the lookback time at the highest redshift in our sample (), instead of the 5 Gyr used in Fig. 7, increases the allowed amount of fading by 0.24 magnitudes. In Figs. 8a and b we plot the minimum faded (present-day) magnitude of each CNELG as a function of redshift with and without the reddening correction, respectively. In any scenario, all the galaxies can fade to become sub-L⋆ galaxies with M. Without the reddening correction and neglecting errors, 14/27 cannot fade to (the most luminous dwarf in the van Zee sample) and 26 cannot to (the faintest in the van Zee sample). With the reddening correction and neglecting errors, 7 cannot fade to and 24 cannot fade to . With the reddening correction and the bluest color allowed by the estimated error, all but one of the galaxies can fade to and 15 cannot fade to .


The amount of possible fading we compute from the measured colors and redshifts is not strongly correlated with our classification of the surface brightness profiles of the CNELGs. However, in §2.1 we estimate that 1–3 of the CNELGs in our study are actually superposed on flux from background or foreground galaxies. Because these low surface brightness features would not be evident in the spectra of CNELGs, we cannot rule out the possibility that some of the apparently larger CNELGs are actually superpositions. However, the superposed galaxies are not likely to affect the measured colors and the fading analysis. The two luminous galaxies that are roughly as compact as tiny NGC 205 but that cannot fade to even M are surprising. However, both galaxies are at relatively high redshifts, where our size analysis has less discriminatory power; as a result, both are also formally consistent with intermediate-sized dwarf galaxies.
From this analysis, we conclude that most CNELGs (96 %) could conceivably fade to become at least as faint as luminous dwarf galaxies , although it is by no means guaranteed that they will fade to these limits. We predict that at most 11% of CNELGs fade to become very low-luminosity dwarf galaxies ().666Accounting for the estimated errors in , this analysis shows that less than 44% can fade to this limit given the bluest possible colors consistent with the data. The remaining CNELGs fade by smaller amounts to the present epoch, to become sub-L⋆ galaxies or luminous dwarfs. Thus, the “bursting-faint-dwarf” model works for at most 11 - 44% of CNELGs. The others must fade to become higher-luminosity dwarfs or more luminous galaxies. In Sec. 3.2 – 3.4 we explore alternative scenarios which involve more massive galaxy descendants.
3.2. The bulges-in-formation hypothesis
The analysis of § 3.1 demonstrates that the bursting dwarf hypothesis is not a satisfactory explanation for all of the CNELGs because some CNELGs are too large to fade to dE’s and some are not likely to fade enough. In § 3.2 – 3.4, we explore the alternative possibility that some CNELGs are actually starbursts in the centers of intrinsically more massive galaxies that fade by magnitudes to become present-day luminous galaxies (Koo et al., 1995; Kobulnicky & Zaritsky, 1999).
Here, we explore the possibility that CNELGs are bursts of star formation in the centers of spiral galaxies. If these starbursts form a substantial population of new stars in the centers of the galaxies, they are almost certainly associated with the in situ formation or enhancement of a galactic bulge. In this scenario, the narrow kinematic emission linewidths of the CNELGs may result from the fact that the starburst is centrally concentrated. The emission line flux samples only the central part of the galaxy’s potential well (Kobulnicky & Gebhardt, 2000; Barton & van Zee, 2001; Pisano et al., 2001). Similarly, CNELGs may be central starbursts in disks viewed face-on (Homeier & Gallagher, 1999; Homeier, Gallagher, & Pasquali, 2002).
Bulges in formation may be very difficult to discern. The low mass-to-light ratio of even a small forming bulge allows it to dominate the flux of a spiral galaxy during rapid formation (e.g., Fig. 3 of Barton & van Zee, 2001). In this scenario, the galaxy as whole fades less to the present epoch, but it’s surface brightness distribution changes dramatically. When the forming bulge fades, the disk becomes much more obvious and the object appears as a disk galaxy instead of a CNELG.
Because CNELGs are selected as compact objects, they are not embedded in extremely obvious galactic disks. With the exception of 212668, which has an evident tidal tail in the new data, our deep ground-based data do not reveal incontrovertible evidence for disks based on visual inspection alone. However, lower surface brightness disks and small disks would not be evident in a visual inspection. The analysis in § 3.1 demonstrates that only 4 of the CNELGs, those in the large category (that includes 212668), are more extended spatially than even large dwarf galaxies.
As Fig. 3 illustrates using the de Jong (1996) local sample of spirals, most isolated disks at redshifts would be resolved by our data. However, the inner disks may be overwhelmed by light from the central starburst in some CNELGs. To be observed clearly in a distant galaxy, the disk must exceed the surface brightness limit of the observation at a radius well beyond the influence of the central burst. Thus, our ability to detect a disk depends on both the central surface brightness of the disk and its scale length: larger, higher surface brightness disks are easier to see. The ability to discern a disk is also a strong function of redshift because of cosmological surface brightness dimming; distant disks can fade into the sky noise without extending very far past the influence of the bulge (or central starburst). Finally, disk detection depends on the luminosity of the central starburst — or equivalently the bulge-to-disk ratio — because the luminosity of the central source affects the radius at which its light dominates the disk. For these reasons, we explore the detectability of disks in our CNELGs one at a time using models constructed at the redshift and resolution appropriate for each CNELG.
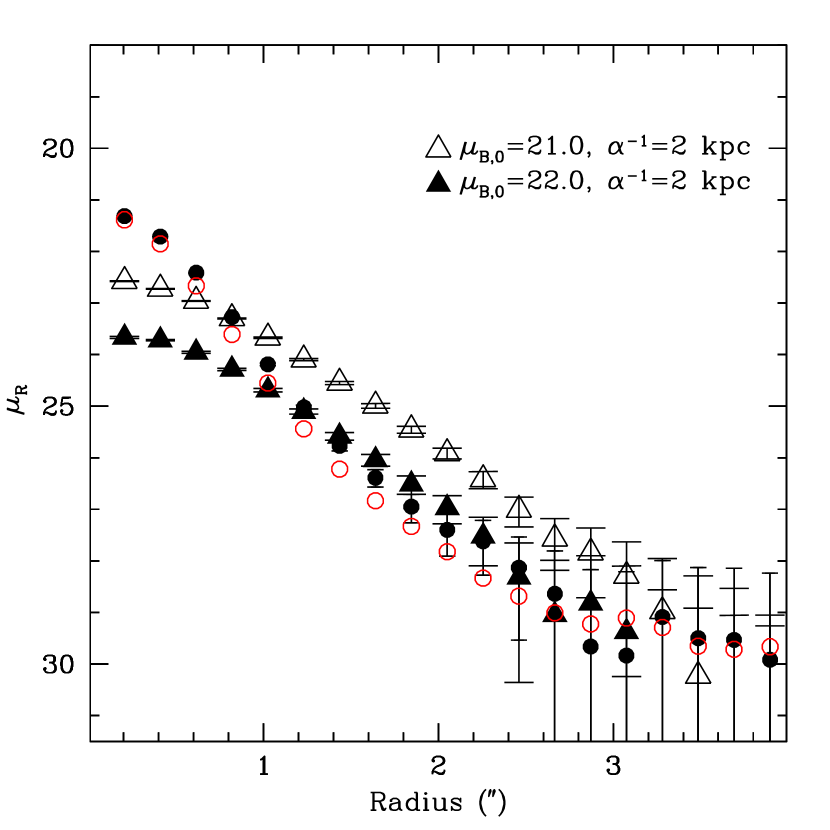
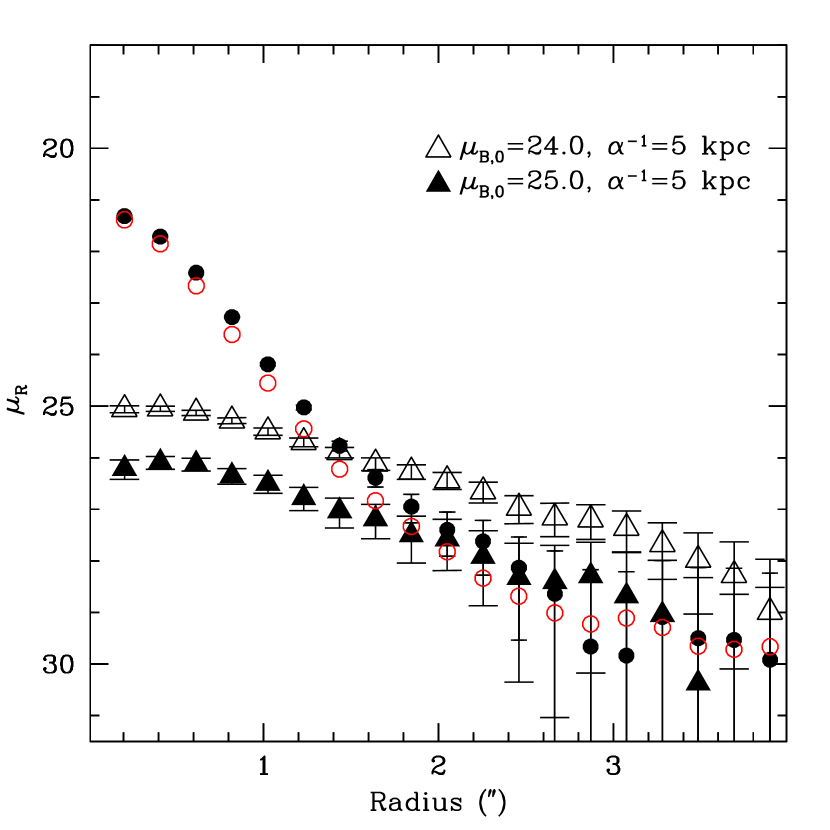
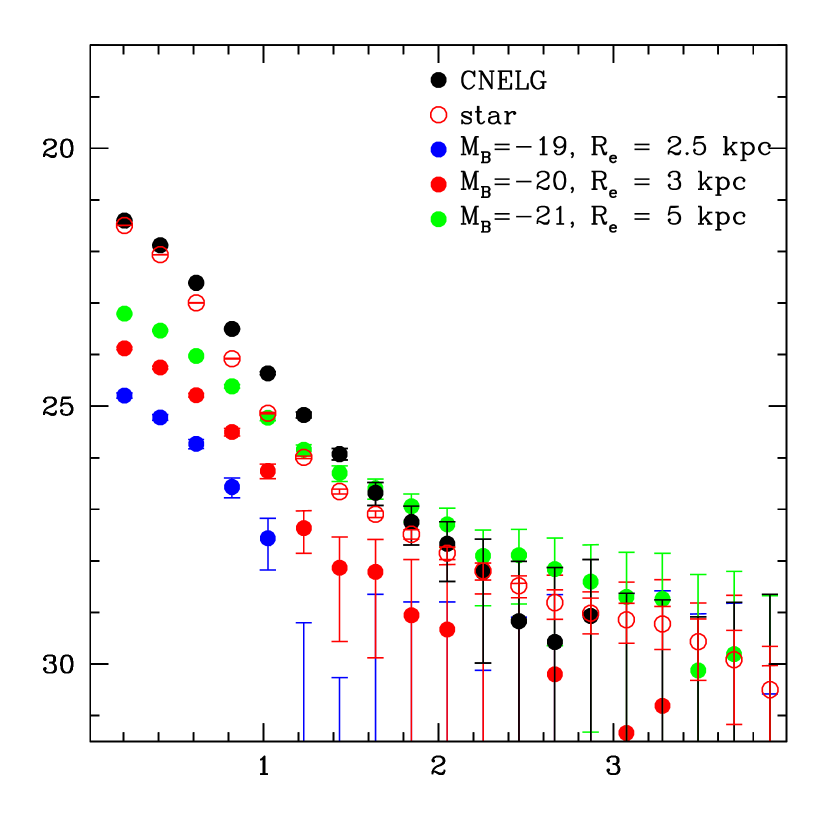
In the absence of a “smoking gun” for disks, we use our data to explore the possibility that CNELGs are embedded in disks by computing the surface brightnesses of the brightest disks of a given size that could be accommodated by our data. Figs. 9 – 10 show the circular surface brightness profiles of two CNELGs plotted on top of circular surface brightness profiles of models of isolated face-on disks with Sbc-type spectral energy distributions that were added to blank-sky regions of the data. The plots are similar for moderately inclined disks. Highly inclined disks are likely ruled out because they would be evident in the data, giving the galaxies a “pinched” appearance.
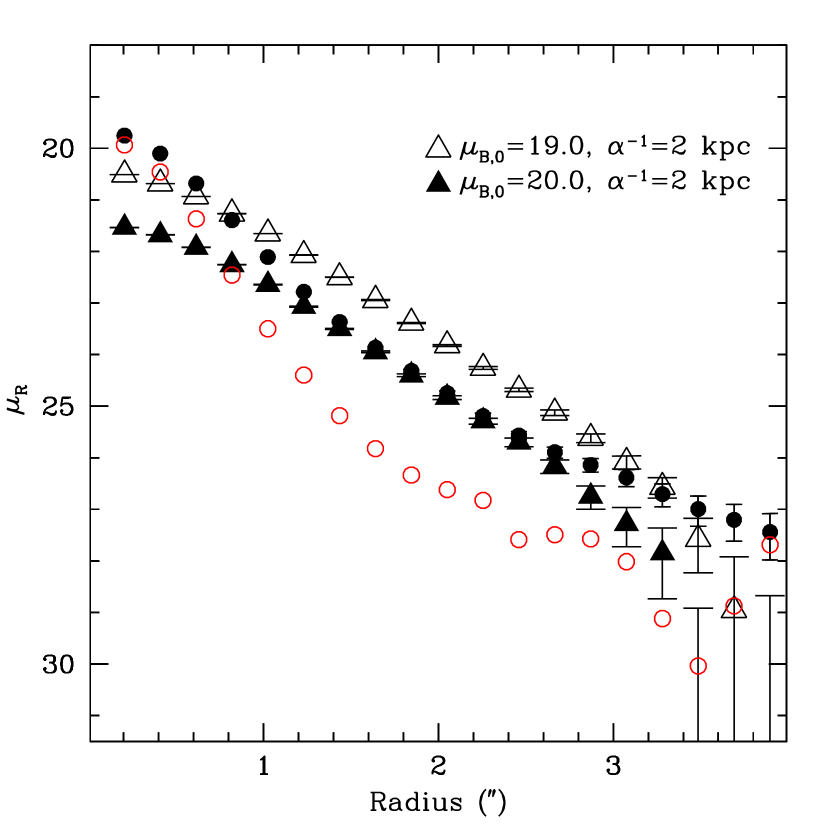
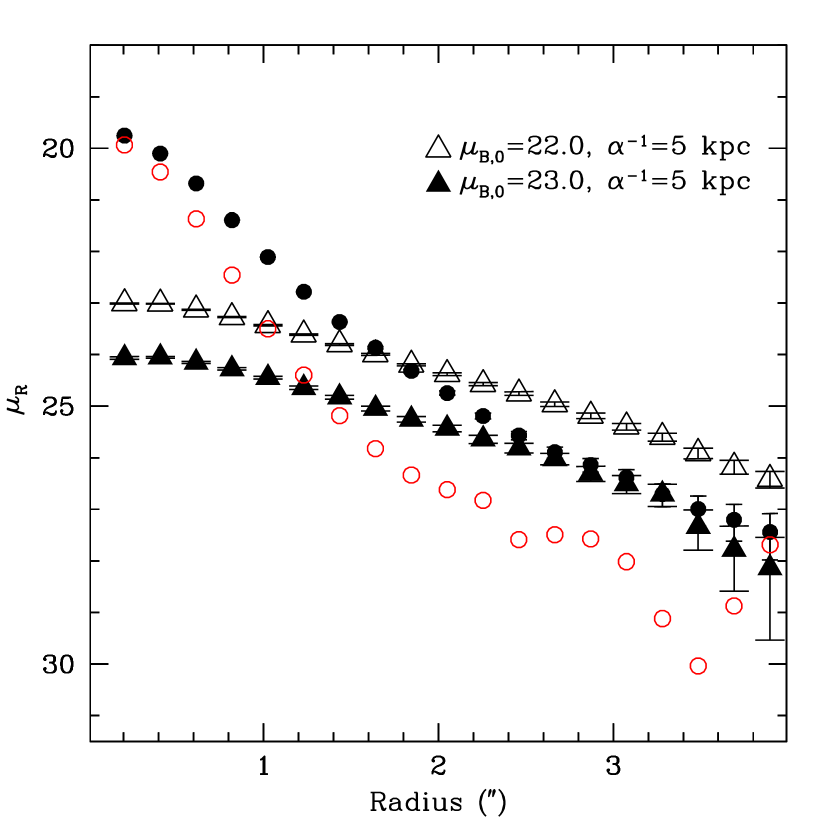
The figures show the sample disks near the maximal limits for a marginally unresolved CNELG (Fig. 9) and a well-resolved, spatially extended CNELG (Fig. 10). Our data rule out disks that fall above the surface brightness of the CNELG at large radii. The results illustrated by Fig. 9 are typical of the NGC 205-like CNELGs in our study (see the classifications in Table 1). These CNELGs are not spatially extended enough to accommodate most of the local disks larger than 2 kpc in the de Jong (1996) sample. The detailed limits set by this analysis are a strong function of redshift. The lowest-redshift NGC 205-like CNELGs can accommodate essentially no realistic face-on disks. 111255 requires for even a 2 kpc disk.
For example, in the left panel of Fig. 9, we illustrate that our data could accommodate a 2 kpc disk with (for an Sbc-type spectral energy distribution), but not one with . The right panel shows that the data accommodate a 5 kpc disk with , but not one with . Substantially larger disks (e.g., 10 kpc) with realistic surface brightnesses () are nearly always ruled out. Even Malin 1, with but kpc (Impey & Bothun, 1989), would be quite evident in the data.
As Fig. 3 illustrates, the known disks typical in the local universe occupy a limited range of surface brightnesses, although this range may be artificially truncated by selection effects even in the local universe. While there are 2 kpc disks with , there are very few 5 kpc disks with . Thus, we conclude from Fig. 9 that if the nearly unresolved CNELG 217169 is embedded in a disk, it is either much lower surface brightness than most known disks in the local universe or it is quite small (2 kpc).
We compute the approximate maximum disk surface brightness accommodated by the CNELGs. We compare model disks (with noise) to the CNELGs in the outer radii beginning where the model disk flux first exceeds the CNELG flux. We create models at 1-magnitude intervals in central surface brightness and interpolate to the disk surface brightness that corresponds to in these outskirts. We list the results for Sbc-type disks in Table 2, sorted by redshift. For two cases, we quote only a lower limit to the maximum surface brightness (i.e., if 112259 has a 10 kpc disk, its central surface brightness is ). Assuming the disks have bluer (Im-type) spectral energy distributions changes the -band surface brightnesses by magnitudes. For context, we know that a the fiducial “Freeman” (bright) disk has a central surface brightness of (Freeman, 1970).
Both 111867 and 208846 accommodate 2 kpc disks with Sbc spectral energy distributions only if ; 111255 requires for a 2 kpc and for a 5 kpc disk. 112259 requires for a 2 kpc disk and for a 5 kpc disk, and 217169 (Fig. 9) requires for a 2 kpc disk and for a 5 kpc disk. These 5 objects are the most unusual in nature. All have and M. We discuss their nature further below. The higher-redshift NGC 205-like CNELGs accommodate more common small or low surface brightness disks, as Table 2 indicates.
3.2.1 Implications of the maximum allowable disks
The bulges-in-formation picture arose as a solution to the problem suggested by the apparently high metallicities of the CNELGs that have measured abundances. Kobulnicky & Zaritsky (1999) study the gas-phase metallicities of a set of two CNELGs, finding that they lie along the luminosity-metallicity relation of field galaxies. Although we note that there are many exceptions to the luminosity-metallicity relation such as NGC 205, the naive interpretation of their results may restrict the amount of fading possible to these galaxies: the two CNELGs in the Kobulnicky & Zaritsky study appear to be too metal-rich to fade to the observed low-luminosity (M) dEs in the local universe. They predict fading for CNELGs that is magnitudes. The authors propose that CNELGs are either progenitors to the more luminous and metal-enriched dEs, or they are bulges forming before their disks are evident. However, these detailed metallicities have only been measured for a small number of CNELGs. In addition, the starbursts in CNELGs may represent a relatively small fraction of the total gas at a later stage in the galaxy’s history, arguing that the metallicity in the gas phase may be higher than the metallicity of the galaxy as a whole.
Although the present deep imaging data do not prove that most CNELGs are embedded in galactic disks, we explore how the presence of a disk could affect the fading of the CNELGs to the present day. Here, we hypothesize that the CNELGs are starbursts in the middle of face-on disks that have the approximate maximum disk luminosities allowed by the surface brightness profiles of the CNELGs (Table 2). Assuming the objects harbor Sbc-type disks with the maximum allowed central surface brightnesses, most of the 27 CNELGs are “bulge-dominated” (or starburst-dominated) objects, with for the 2 kpc disks and for the 5 kpc disks. For these maximum allowable disks, these numbers are lower limits to the average B/T (or starburst/T) ratios of the CNELGs.
If the disks do not evolve in luminosity or size but the central starbursts fade substantially, the ratios of the objects decline rapidly (see, e.g., Barton & van Zee, 2001). At the same time, the total luminosities of the galaxies evolve, but by much less than the fading central starbursts evolve. In this way, the luminosity in the disk “stabilizes” the CNELG against fading. Here, we assume SEDs for the disks and that the disks do not evolve substantially in luminosity or color, then explore the fading caused by fading of the “bulge” component in two ways, by considering (1) the amount of fading allowed to bring the galaxy’s B/T ratio to a given final value and (2) the amount of fading that will occur by the present day assuming the color of the observed CNELG must match the color of the composite “bulge”disk at the redshift of the CNELG.


Fading to a given B/T ratio: In Fig. 11, we explore the amount of total object fading that results from the fading of the bulge to an eventual bulge-to-disk ratio that is more typical of spiral galaxies. We assume the maximum compatible disks described above. Thus, we show an approximate lower limit to the amount of total object fading required to achieve a for the faded object, which is appropriate for the progenitor of a typical small late-type spiral (see, e.g., de Jong, 1996). The objects would require less fading to achieve larger ratios appropriate for an earlier-type spiral. We plot the required fading to as a function of redshift to illustrate the mild systematic trends with redshift that result from the heterogeneity of the sample and our decreasing ability to rule out more luminous disks at higher redshifts. The classes of CNELGs from Table 1 are differentiated by point styles.
The relationship between color and amount of fading defined by the models in Fig. 6 allows us to examine whether this picture is consistent with the colors of CNELGs. In some cases, the objects are too blue to support this picture: even if the disk is blue (Im-type) and remains stable in color and -band luminosity, the bulges must fade to to explain the color of the composite CNELG.
Color matching: If we fix the color of the disk and match the color of the composite object to the color of the actual CNELG, allowing any final ratio , the objects themselves fade by less than 2 magnitudes to match their colors if they are surrounded by Sbc-type (), Scd-type (), or Im-type () disks of maximal surface brightness. We note that some of these disk colors are not blue enough to allow a color equal to the object color for a final, faded ; in these cases we only allow the bulge to fade to . Fig. 12 shows the faded magnitudes of the CNELGs in this model. With the maximum allowed disk, the objects fade little and most remain luminous; 89% (24/27) have mean faded M. Conversely, the low-redshift 4 objects whose maximal fading is below M, 111867, 111255, 208846, and 112259, almost certainly cannot be luminous galaxies. Even without fading they have M. These are among the 5 objects identified in § 3.1 as the best candidates for starbursting dwarf galaxies. The fifth, 217169, has a faded mean M. Because of the “stabilizing” disk population, reddening can have little effect on Fig. 12. Assuming colors that are 0.3 magnitudes bluer changes the mean results by an average of only 0.14 magnitudes for the 27 CNELGs. If the disks increase in luminosity through continued star formation, the objects fade by even less than the predicted amount. Conversely, if the disks fade the objects will fade, but this effect is very general and equally applicable to discussions of all disk galaxies at intermediate redshift.

If most CNELGs actually harbor disks, they will fade by roughly 1-2 magnitudes and most will remain luminous galaxies (M). As Fig. 12 illustrates, the maximum allowable small disks support enough stellar mass to stabilize most of the galaxies against fading to dwarfs. Only 4/27 CNELGs essentially must fade to M.
3.3. The cores of elliptical galaxies in formation
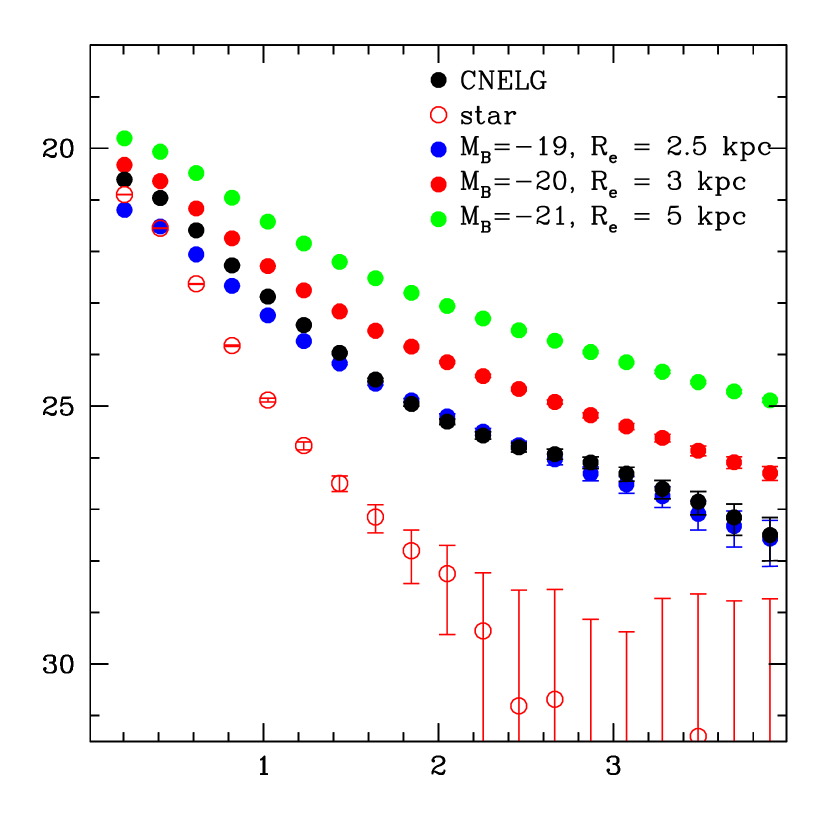
The surface brightness profiles of most of the nearby CNELGs in our study rule out the existence of a red underlying population with the structural parameters of a giant elliptical. However, the redshift dependence in our ability to detect an underlying older galaxy is extremely strong because of the much larger k-corrections associated with older stellar populations. In Fig. 13, we show the surface brightness profiles of model elliptical galaxies on the profiles for two CNELGs, 212668 (left), which is actually a large galaxy at lower redshift and 209640, a NGC 205-like galaxy at the highest redshift of the sample, . We are unable to rule out giant ellipticals from the surface brightness profile of the distant galaxy, even though it is very compact. However, very luminous ellipticals are ruled out for the large galaxy. In this example, our ability to find underlying red stellar populations is dominated by redshift and not by the actual measured extent of the galaxy. Because of this extremely strong redshift dependence, the surface brightness profile provides little useful information about the presence of a very old stellar population.
The strongest arguments against the hypothesis that CNELGs and other compact blue galaxies at intermediate redshift are giant ellipticals involve kinematics (e.g., Im et al., 2001). The velocity widths of CNELG emission lines are narrower than the absorption line widths of nearly all elliptical galaxies. Concentrating the star formation in the center of an elliptical to form a CNELG is unlikely to solve the linewidth problem because many elliptical galaxies have velocity dispersions that rise in the center (e.g., Franx, Illingworth, & Heckman, 1989; Im et al., 2001). Some elliptical galaxies have a distinct central component organized into a disk. If the disk formed rapidly with a central burst of star formation in the elliptical, the system might resemble a CNELG for a brief time. However, the nearby disks in ellipticals observed at high spatial resolution appear to have similar star formation histories to their parent galaxies (Carollo et al., 1997). Lower-luminosity elliptical galaxies provide another possibility but the majority of even these low-mass systems also have larger velocity dispersions than the CNELGs (e.g., Halliday et al., 2001).
3.4. CNELGs as progenitors of E+A galaxies
By definition, EA galaxies have strong Balmer absorption lines and little or no line emission. Thus, they are composed of a mix of older stars and a dominant population of A-type stars, but no younger, more massive stars; their spectra are consistent with a strong burst of star formation that abruptly ceased 1 Gyr ago (Couch & Sharples, 1987; Newberry, Boroson, & Kirshner, 1990; Schweizer, 1996; González Delgado, Leitherer, & Heckman, 1999; González Delgado & Leitherer, 1999). Although they are currently only a small fraction of the luminous galaxy population (0.2%; Zabludoff et al., 1996), they represent a distinct phase of post-strong-starburst evolution (Dressler & Gunn, 1983; Zabludoff et al., 1996; Quintero et al., 2004). Longslit spectroscopy demonstrates that the young components of the stellar populations of EA’s are more centrally concentrated than the older stars (Norton et al., 2001). Although detailed morphologies of the separate young and old populations are not available, morphological studies with HST of a subset of EA’s reveal disturbed galaxies dominated by spheroids with small half-light radii; at least some of the tidal features are low surface brightness and thus too difficult to see at intermediate redshifts (Yang et al., 2004). Thus, it is quite possible that many, if not all, EA galaxies are descendants of CNELGs. Because the definition of an EA is independent of morphology, this hypothesis and those outlined in § 3.2 and § 3.3 are not mutually exclusive. To put it in another way, with a sufficiently strong and short burst (e.g., akin to the bursting dwarf scenario), CNELGs must go through an E+A phase.
High resolution images of a subset of 5 extremely blue non-cluster E+A’s show that they are spheroid dominated (), although 2/5 EA’s with published HST images have spiral disks (Yang et al., 2004). Because kinematic studies of EA’s reveal little rotation, Norton et al. (2001) argue that EA galaxies likely evolve into dynamically hot, spheroid-dominated systems. Thus, the CNELGs that are progenitors to EA’s probably evolve into ellipticals or early-type spirals. Indeed, Bershady et al. (2005) find that 6/7 CNELGs with HST/STIS long-slit spectroscopy have V/, i.e., in the spheroidal range.
Similar to the problems posed by identifying CNELGs with elliptical galaxies (§ 3.3), the kinematics of the CNELGs continue to represent a barrier to identifying them with EA galaxies. Norton et al. (2001) measure a range of velocity widths, , for the old stellar populations of EA’s that place them only 0.6 magnitudes brighter than the Faber-Jackson (1976) relation. The measured values of vary from km s-1 to 241 km s-1. Furthermore, the values of measured from absorption lines associated with the young stellar populations are on average larger than those for the older populations. The differences may result from systematic differences between the kinematics of a young emission-line population and its kinematics in absorption after 1 Gyr of aging. However, Kobulnicky & Gebhardt (2000) find no evidence for systematic differences between emission linewidths and absorption linewidths in a sample of 22 local galaxies that span a wide range of morphologies. Alternatively, perhaps the only EA’s that go through CNELGs phase are those with the narrowest linewidths, which is possible if the EA’s with the narrowest linewidths are also the most compact. Existing studies of EA’s are not large enough to uncover a trend of this sort.
4. Discussion and Implications
The two basic pictures for CNELG evolution can be categorized as (1) the bursting dwarf hypothesis, where the galaxies are intrinsically low-mass systems that fade to become present-day dwarfs, and (2) the hypothesis that CNELGs are the centers of more massive galaxies that fade little and remain luminous to the present day (). § 3.2-3.4 all discuss variants on the latter hypothesis: that CNELGs are starbursts in the centers of disk galaxies, possibly related to the formation of galactic bulges (§ 3.2), that CNELGs are cores in elliptical galaxies (§ 3.3), and that CNELGs are the immediate progenitors of E+A galaxies (§ 3.4). Hypothesis (2) is very general, and may include many different types of formation scenarios.
To explore the dwarf model, we calculate the maximal amount of fading to the present day allowed by the lookback times and colors of the CNELGs. To explore the hypothesis that CNELGs are the centers of more massive galaxies, we consider a scenario in which the CNELG is surrounded by the largest exponential older (Im to Sbc-like) stellar population accommodated by its surface brightness profile. We assume that the disk does not fade or change color with time and find the amount of fading that matches the color. Because the surrounding older stellar population stabilizes the galaxy against fading, this technique essentially allows us to compute a minimal amount of fading in the case of a non-evolving disk. If the disk increases in luminosity with time, however, the object will fade less.
The surface brightness profiles we measure indicate that if CNELGs are embedded in disks most of them are embedded in low surface brightness disks. We note, however, that this hypothesis is broadly consistent with at least one favored formation scenario for the the bulge of the Milky Way. The bulge probably formed from a rapid burst of star formation at early times (e.g., Ferreras, Wyse, & Silk, 2003). Although the disk has a high surface brightness now, it has formed stars and increased in surface brightness from much earlier times to the present epoch. Thus, at the time the bulge formed, the disk may have been below the central surface brightness limits allowed by Table 2. Although the Milky Way bulge almost certainly formed long before , the basic formation scenario indicates that the Milky Way may have gone through a CNELG-tye phase if its disk was low surface brightness when its bulge formed.
4.1. Sorting Different Types of CNELGs
Both the literature and our analyses support the conclusion that CNELGs are a heterogeneous class of objects. The CNELG sources studied here were selected with three main attributes: (1) they are unresolved sources in moderate-seeing ground-based images, (2) they are selected from a magnitude limited sample; and (3) they are selected to have blue colors unlike Galactic stars. The apparent magnitude-limited nature of the sample results in a strong correlation of luminosity with redshift. Roughly, sources above are brighter than M, while lower redshift sources are fainter than M. Surface-brightness limits on embedded disks (§3.2) are similarly correlated with redshift, with = 21 mag arcsec-2 corresponding to the break point at . On the other hand, because the color selection was narrowly defined and k-corrections for these blue colors are small, there is little-to-no trend in rest-frame color with redshift. As Fig. 4 illustrates, even at the highest redshift in our sample we can distinguish a small dwarf like NGC 205 from a large dwarf like VCC 437. We can also distinguish both types from much larger galaxies. Most surprisingly, however, the size classes based on the analysis in this paper are also not strongly correlated with redshift, with the exception of the extreme compactness of the four lowest-redshift CNELGs. With these considerations of homogeneity and heterogeneity in mind, we can combine constraints gleaned from the CFHT imaging presented here with other information to gain insight into their nature.
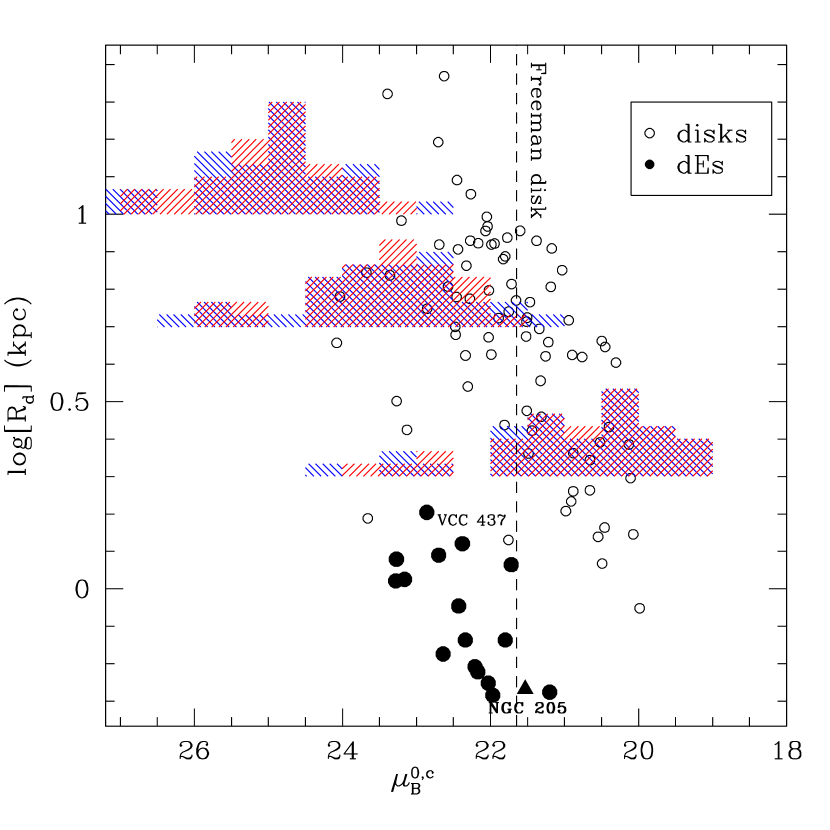
We summarize the two basic models of dwarf galaxies from § 3.1 and § 3.2 in Fig. 14. On the left, the colored histograms correspond to the dwarfs of different sizes for the maximal fading model. On the right, the colored histograms correspond to the “maximal” disks of 2,5, and 10 kpc accommodated by the surface brightness profiles of the CNELGs (Table 2).
For the “starbursting dwarfs” model that assumes CNELGs will fade maximally, Fig. 14a shows histograms of the LARGE, VCC 437-like, INTERMEDiate, and NGC 205-like classes of CNELGs (top to bottom). All but the LARGE class of dwarfs overlap dEs in the local universe. However, for many of the most luminous CNELGs, the required faded central is brighter than typical dwarfs in the local universe, especially if we assume no reddening correction (cyan histogram). These objects either (1) are all reddened, (2) do not fade as much as the maximal model suggests, or (3) fade to small galaxies that are more luminous than the dwarf population that is typically studied today. The LARGE class of galaxies overlaps only with the lower surface brightness small disks in this maximally-fading model.
For the “hidden disks” model that assumes CNELGs will fade minimally, stabilized by an older population in a surrounding disk, Fig. 14b shows histograms of the brightest 2, 5, and 10 kpc disks accommodated by the data. All but 4 CNELGs can harbor 2 kpc disks with parameters that overlap disks in the nearby universe. In contrast, most cannot harbor 5 kpc disks with typical parameters, and almost none can harbor 10 kpc disks. Thus, if CNELGs are starbursting centers embedded in typical galactic disks, their disks are small.
The four lowest-redshift objects, 111867, 111255, 208846, and 112259, are classified as NGC 205-like, suggesting that at redshifts below 0.3, the extremely compact size requirements for the original definition of CNELGs prohibit the selection of extended galaxies. As observed, they are already relatively low-luminosity, with . Their colors, luminosities, and redshifts suggest that within the errors they can fade to even M (§ 3.2), and their surface brightness profiles and colors suggest that they must fade to at least M Thus, the imaging data and the two models point to the same interpretation: these 4 galaxies are starbursting dwarfs at low redshift, observed at lookback times of Gyr.
Beyond , the classifications of CNELGs appear more mixed. Fig. 8 and Fig. 12 show the approximate maximum and minimum present-day luminosities of the CNELGs. To within the errors of Fig. 8b, all but one of the CNELGs can fade to M and 8/23 CNELGs at can fade to M; the other 15 cannot. In contrast, according to the disk model in § 3.2 (Fig. 12), the (approximate, mean) maximum final luminosities of all the galaxies with are brighter than M. Thus, all the CNELGs with could be more luminous than the Virgo dEs at the present epoch (based on the minimal-fading model). Eight of these galaxies could also fade to M in the maximal-fading model. The remaining 15 must be more luminous than M at the present epoch. A comparison of the fading limits derived in this study with those of Guzmán et al. (1998) show broad consistency with their results.
From a morphological perspective, the more extended (large) CNELGs are the most clear cut examples of luminous galaxies on the basis of their sizes, including 212668, which has an evident tidal tail in the -band image. Their colors allow a large range of possible fading, however, indicating that three of the four can fade to M and that all 4 must fade to the range . This LARGE sub-sample consists of only 4 of the 27 (14%) of the CNELGs. Moreover, we found in §2.1 that, on a statistical basis, 1-3 of the CNELGs in our study may be superposed on diffuse background galaxies.
The overlap between this study and the Kobulnicky & Zaritsky (1999) metallicity study includes only object, 206134, in the SA68 field, with and M, which we classify as VCC 437-like based on its surface brightness profile. Its metallicity, , lies directly on the luminosity-metallicity relation for nearby star-forming galaxies. The gas-phase abundance is high relative to the stellar metallicity of some of today’s dSph galaxies. However, other low-mass dwarfs such as the nucleated dE NGC 205 do have comparable metallicity, and indeed other spheroidals such as Sagittarius and Fornax lie significantly above the luminosity-metallicity relation. The model in Fig. 8 allows a “maximum” fading to a very faint M within the errors on the color, and the model in Fig. 12 yields an “average minimum” fading to M, where star-forming galaxies with its metallicity are quite typical in the local universe (Tremonti et al., 2004).
If many of the CNELGs really are progenitors to non-dwarf galaxies, the observations of the kinematics of CNELGs remain the most difficult to explain. Even some of the galaxies that are classified as large compared to dwarf galaxies have very narrow emission linewidths. These galaxies consistently exhibit narrow linewidths that are observed nearby only in dwarf galaxies or in some very low-luminosity ellipticals and bulges. However, several authors demonstrate that emission-line kinematics can be misleading (Kobulnicky & Gebhardt, 2000; Barton & van Zee, 2001; Pisano et al., 2001), and that optical emission linewidths are systematically low relative to 21 cm HI for galaxies with narrow optical emission linewidths (Pisano et al., 2001).
As discussed above, the linewidths observed in CNELGs are usually too narrow for even lower-luminosity elliptical galaxies, even if the emission-line flux is centrally concentrated (Im et al., 2001). However, if the emission-line flux originates from small central disk, the situation may be somewhat different. Small circumnuclear disks have been observed in both spiral and elliptical galaxies (Rubin, Kenney, & Young, 1997; Carollo et al., 1997, and references therein). They are often the sites of rapid star formation and, in spiral galaxies, may be associated with the formation of a pseudobulge (e.g., Kormendy & Kennicutt, 2004). These disks exhibit a range of kinematics, however (Rubin, Kenney, & Young, 1997). A lack of observed rotational shear in medium spectral-resolution longslit HST/STIS spectroscopy for 6/7 CNELGS argues against this picture (Bershady et al., 2005) – except in the unlikely event that the disks are truly face-on or the minor axis is consistently aligned with the slit. However, at medium spectral-resolutions of 7000-10000, even nearly face-on disks show rotational shear, e.g., as noted for the starburst NGC 7673 (Homeier & Gallagher, 1999), or normal spirals (Andersen & Bershady, 2003). Our understanding of how to interpret kinematical data will likely increase with future spectroscopic observations using high-resolution bi-dimensional spectroscopy.
5. Conclusions
The compact narrow emission line galaxies (CNELGs) are an extreme, rapidly evolving population of luminous galaxies observed at intermediate redshift (Koo et al., 1994). Their nature and ultimate role in the evolution of galaxies remains heavily debated. We present deep ground-based -band imaging in good seeing designed to detect low surface brightness features that may indicate CNELGs are starbursts embedded in more massive systems. We combine the new data with existing color and redshift information to draw our conclusions:
-
1.
We use circular-aperture surface photometry to set lower limits to their present-day spatial extents irrespective of luminosity, finding that 26% are consistent with tiny dwarfs like NGC 205 (or smaller, in some cases), 30% are consistent with intermediate-sized dEs, 30% are consistent with larger dwarfs or smaller disk galaxies, and 15% appear more spatially extended than dwarf galaxies.
-
2.
Given the limits of the data, some CNELGs may harbor extended structures such as galactic disks, although only 212668, with a clear tidal tail, shows definitive evidence for one. Our data indicate that if most CNELGs harbor disks the disks must be small ( a few kpc in many cases) or relatively low surface brightness.
-
3.
Models indicate that 4/27 (15%), the four lowest-redshift CNELGs, cannot harbor enough “hidden” disk material to stabilize them against fading to become dwarf galaxies (M). All of these galaxies are nearby () and as small as NGC 205. They are likely examples of bursting dwarfs.
-
4.
From an analysis of the maximum fading possible to CNELGs based on their colors, we find that 15/27 (56%) are not blue enough to fade to tiny dwarf galaxies (M), even accounting for reddening and errors. These galaxies remain intrinsically more luminous to the present day. 8/15 of these objects are classified as NGC 205-like or intermediate-sized dwarfs based on their surface brightness profiles.
-
5.
From the same analysis of the maximum fading possible to CNELGs based on their colors, we find that 26/27 (96%) are blue enough to fade to some type of dwarf galaxy (M), accounting for reddening and errors. However, four of these galaxies are too spatially extended to become dwarfs.
-
6.
From an analysis of the maximally bright disks accommodated by the measured surface brightness profiles of CNELGs, all but the four CNELGs can harbor small (2 kpc) disks consistent with small disks observed in the local universe. Most cannot harbor large disks, however. An analysis of the minimal fading allowed to CNELGs based on the potential disks they may harbor indicates that most CNELGs (85%) may fade by only a small amount to remain luminous (M) at the present epoch.
References
- Andersen & Bershady (2003) Andersen, D. R., & Bershady, M. A. 2003, ApJ, 599, 79
- Barazza, Binggeli, & Jerjen (2003) Barazza, F. D., Binggeli, B., & Jerjen, H. 2003, A&A, 407, 121
- Barton & van Zee (2001) Barton, E. J., & van Zee, L. 2001, ApJ, 550, L35
- Bershady, Trevese, & Kron (1998) Bershady, M. A., Trevese, D., Kron, R. G. 1998, ApJ, 496, 103
- Bershady et al. (2005) Bershady, M. A., Vils, M., Hoyos, C., Guzmán, R., Koo, D. C., in “Starbursts: From 30 Doradus to Lyman Break Galaxies,” 2005, eds. R. de Grijs and R. M. González Delgado, (Dordrecht: Springer), Astrophysics & Space Science Library, 329, 177
- Bertin & Arnouts (1996) Bertin, E., & Arnouts, S. 1996, A&AS, 117, 393
- Binney & Tremaine (1987) Binney, J., & Tremaine, S. 1987, Galactic Dynamics (Princeton: Princeton Univ. Press)
- Bruzual & Charlot (2003) Bruzual, G., & Charlot, S. 2003, MNRAS, 344, 1000
- Carollo et al. (1997) Carollo, C. M., Danziger, I. J., Rich, R. M., Chen, X. 1997, ApJ, 491, 545
- Carollo (1999) Carollo, C. M. 1999, ApJ, 523, 566
- Chabrier (2003) Chabrier, G. 2003, PASP, 115, 763
- Coleman, Wu, & Weedman (1980) Coleman, G. D., Wu, C.-C., & Weedman, D. W. 1980, ApJS, 43, 393
- Couch & Sharples (1987) Couch, W. J., & Sharples, R. M. 1987, MNRAS, 229, 423
- de Jong (1996) de Jong, R. S. 1996, A&AS, 118, 557
- Dressler & Gunn (1983) Dressler, A., & Gunn, J. E. 1983, ApJ, 270, 7
- Faber & Jackson (1976) Faber, S. M., & Jackson, R. E. 1976, ApJ, 204, 668
- Ferreras, Wyse, & Silk (2003) Ferreras, I., Wyse, R. F. G. & Silk, J. 2003, MNRAS, 345, 1381
- Franx, Illingworth, & Heckman (1989) Franx, M., Illingworth, G., & Heckman, T. 1989, ApJ, 344, 613
- Freeman (1970) Freeman, K. C. 1970, ApJ, 160, 811
- Geha, Guhathakurta, & van der Marel (2003) Geha, M., Guhathakurta, P., & van der Marel, R. P. 2003, AJ, 126, 1794
- González Delgado & Leitherer (1999) González Delgado, R. M., & Leitherer, C. 1999, ApJS, 125, 479
- González Delgado, Leitherer, & Heckman (1999) González Delgado, R. M., Leitherer, C., & Heckman, T. M. 1999, ApJS, 125, 489
- Guzmán et al. (1996) Guzmán, R., et al. 1996, ApJ, 460, 5
- Guzmán et al. (1997) Guzmán, R., et al. 1997, ApJ, 489, 559
- Guzmán et al. (1998) Guzmán, R., Jangren, A., Koo, D. C., Bershady, M. A., & Simard, L. 1998, ApJ, 495, L13
- Guzmán et al. (2003) Guzmán, R., , G., Kunth, D., Bershady, M. A., Koo, D. C., & Pahre, M. A. 2003, ApJ, 586, L45
- Halliday et al. (2001) Halliday, C., et al. 2001, MNRAS, 326, 473
- Hammer et al. (2001) Hammer, F., Gruel, N., Thuan, T., Flores, H., & Infante, L. 2001, ApJ, 550, 570
- Homeier & Gallagher (1999) Homeier, N. L., & Gallagher, J. S. 1999, A&A, 522, 199
- Homeier, Gallagher, & Pasquali (2002) Homeier, N., Gallagher, J. S., III, & Pasquali, A. 2002, A&A, 391, 857
- Hoyos et al. (2004) Hoyos, C., Guzmán, R., Bershady, M. A., Koo, D. C., & Díaz, A. I. 2004, AJ, 128, 1541
- Im et al. (2001) Im., M., et al. 2001, AJ, 122, 750
- Impey & Bothun (1989) Impey, C., Bothun, G. 1989, ApJ, 341, 89
- Kobulnicky & Gebhardt (2000) Kobulnicky, H. A., & Gebhardt, K. 2000, AJ, 119, 1608
- Kobulnicky & Zaritsky (1999) Kobulnicky, H. A, & Zaritsky, D. 1999, ApJ, 511, 118
- Koo (1986) Koo, D. C., 1986, ApJ, 311, 651
- Koo, Kron, & Cudworth (1986) Koo, D. C., Kron, R. G., & Cudworth, K. M. 1986, PASP, 98, 285
- Koo & Kron (1988) Koo, D. C., Kron, R. G. 1988, ApJ, 325, 92
- Koo et al. (1994) Koo, D. C., Bershady, M. A., Wirth, G. D., Stanford, A., & Majewski, S. R. 1994, ApJ, 427, L9
- Koo et al. (1995) Koo, D. C., et al. 1995, ApJ, 440, L49
- Kormendy & Kennicutt (2004) Kormendy, J., & Kennicutt, R. C., Jr. 2004, ARA&A, 42, 603
- Kron (1980) Kron, R. G. 1980, ApJS, 43, 305
- Jerjen, Binggeli, & Freeman (2000) Jerjen, H., Binggeli, B., & Freeman, K. C. 2000, AJ, 119, 593
- Magnier & Cuillandre (2004) Magnier, E. A.., & Cuillandre, J.-C. 2004, PASP, 116, 449
- Majewski (1992) Majewski, S. R. 1992, ApJS, 78, 87
- Majewski et al. (1994) Majewski, S. R., Kron, R. G., Koo, D. C.; Bershady, M. A. 1994, PASP, 106, 1258
- Martin et al. (2002) Martin, P., Savalle., Vermeulen, T., Shapiro, J. N. 2002, SPIE, 4844, 74
- Mateo (1998) Mateo, M. L. 1998, ARA&A, 36, 435
- Munn et al. (1997) Munn, J. A., et al. 1997, ApJS, 109, 45
- Newberry, Boroson, & Kirshner (1990) Newberry, M. V., Boroson, T. A., & Kirshner, R. P. 1990, ApJ, 350, 585
- Norton et al. (2001) Norton, S. A., Gebhardt, K., Zabludoff, A. I., & Zaritsky, D. 2001, ApJ, 557, 150
- Phillips et al. (1997) Phillips, A. C., et al. 1997, ApJ, 489, 543
- Quintero et al. (2004) Quintero, A. D., et al. 2004, ApJ, 602, 190
- Pisano et al. (2001) Pisano, D. J., Kobulnicky, H. A., Guzmán, R., Gallego, J., & Bershady, M. A. 2001, ApJ, 122, 1194
- Rubin, Kenney, & Young (1997) Rubin, V. C., Kenney, J. D. P., & Young, J. S. 1997, AJ, 113, 125
- Schweizer (1996) Schweizer, F. 1996, AJ, 111, 109
- Tremonti et al. (2004) Tremonti, C. A., et al. 2004, ApJ, 613, 898
- Trevese et al. (1989) Trevese, D., Pittella, G., Koo, D. C., Kron, R. G., & Bershady, M. A. 1989, AJ, 98, 108
- Trevese et al. (1994) Trevese, D., Kron, R. G., Majewski, S. R., Bershady, M. A., Koo, D. C. 1994, ApJ, 433, 494
- Vader et al. (1988) Vader, J. P., Vignoux, L., Lachièze-Rey, M., & Souviron, J. 1988, A&A, 203, 217
- van Zee, Barton, & Skillman (2004) van Zee, L., Barton, E. J., & Skillman, E. D. 2004, AJ, 128, 2797
- van Zee, Skillman, & Haynes (2004) van Zee, L., Skillman, E. D., & Haynes, M. P. 2004, AJ, 128, 121
- Yang et al. (2004) Yang, Y., Zabludoff, A. I., Zaritsky, D., Lauer, T. R., & Mihos, J. C. 2004, ApJ, 607, 258
- Zabludoff et al. (1996) Zabludoff, A. I., et al. 1996, ApJ, 466, 104
| Coordinates | Exposure | ||||||||||
|---|---|---|---|---|---|---|---|---|---|---|---|
| Field | ID | (2000) | Quality | mR | MB | (mag.) | (km s-1) | (ksec) | Notes | ||
| SA57 | 111867 | 13 07 14.0 29 25 28 | 0.160 | Q1 | 19.85 | -18.8 | 0.35 | 1.7(2.5) | 25.8 | NGC205 | |
| SA57 | 111255 | 13 07 28.3 29 24 40 | 0.180 | Q3 | 21.78 | -17.2 | 0.16 | 2.7(6.1) | 25.8 | NGC205 | |
| SA68 | 208846 | 00 16 31.1 15 52 20 | 0.242 | Q1 | 21.14 | -18.5 | 0.32 | 2.3(3.0) | 21.0 | NGC205 | |
| SA57 | 112259 | 13 07 15.0 29 26 03 | 0.252 | Q3 | 21.06 | -18.7 | 0.33 | 2.3(3.1) | 25.8 | NGC205 | |
| SA68 | 212668 | 00 18 04.9 15 58 17 | 0.260 | Q1 | 20.15 | -19.6 | 0.38 | 2.2(2.9) | 21.0 | LARGE | |
| SA68 | 217054 | 00 17 40.8 16 06 56 | 0.284 | Q1 | 20.65 | -19.3 | 0.41 | 2.1(2.9) | 21.0 | intermed | |
| SA68 | 206134 | 00 18 11.3 15 47 54 | 0.285 | Q1 | 20.29 | -19.8 | 0.27 | 2.6(3.6) | 41aaGuzman et al. (1996) | 21.0 | VCC437 |
| SA68 | 203307 | 00 16 55.0 15 43 06 | 0.297 | Q1 | 20.59 | -19.5 | 0.35 | 2.4(3.1) | 21.0 | intermed | |
| SA57 | 108954 | 13 09 35.7 29 21 16 | 0.319 | Q1 | 20.47 | -19.9 | 0.17 | 3.2(6.2) | 25.8 | VCC437 | |
| SA68 | 217255 | 00 17 22.9 16 07 26 | 0.348 | Q1 | 19.40 | -21.2 | 0.31 | 2.7(3.4) | 40aaGuzman et al. (1996) | 21.0 | LARGE |
| SA68 | 217169 | 00 16 56.2 16 07 11 | 0.354 | Q1 | 21.28 | -19.3 | 0.32 | 2.6(3.4) | 21.0 | NGC205 | |
| SA68 | 217779 | 00 16 49.1 16 08 47 | 0.377 | Q3 | 21.18 | -19.6 | 0.40 | 2.4(3.2) | 21.0 | intermed | |
| SA68 | 212916 | 00 16 28.9 15 58 46 | 0.418 | Q1 | 20.54 | -20.5 | 0.41 | 2.5(3.2) | 21.0 | VCC437 | |
| SA57 | 112536 | 13 09 06.8 29 26 32 | 0.420 | Q1 | 21.07 | -20.0 | 0.32 | 2.8(3.5) | 25.8 | intermed | |
| SA57 | 110601 | 13 08 47.7 29 23 41 | 0.438 | Q1 | 20.70 | -20.5 | 0.18 | 3.5(6.4) | 43bbKoo et al. (1995) | 25.2 | VCC437 |
| SA57 | 108956 | 13 09 48.2 29 21 15 | 0.439 | Q2 | 20.91 | -20.3 | 0.26 | 3.1(4.5) | 25.8 | LARGE | |
| SA57 | 105482 | 13 09 08.7 29 15 57 | 0.453 | Q1 | 20.43 | -20.8 | 0.36 | 2.7(3.5) | 60bbKoo et al. (1995) | 25.8 | intermed |
| SA68 | 206403 | 00 17 17.6 15 48 20 | 0.468 | Q1 | 20.55 | -20.8 | 0.40 | 2.6(3.4) | 21.0 | NGC205 | |
| SA68 | 215428 | 00 18 06.2 16 03 17 | 0.482 | Q2 | 20.60 | -20.9 | 0.42 | 2.5(3.3) | 21.0 | VCC437 | |
| SA68 | 216388 | 00 18 16.5 16 05 11 | 0.488 | Q1 | 20.31 | -21.2 | 0.43 | 2.5(3.2) | 21.0 | VCC437 | |
| SA57 | 117671 | 13 07 31.7 29 34 33 | 0.518 | Q2 | 21.07 | -20.6 | 0.44 | 2.5(3.1) | 25.8 | intermed | |
| SA57 | 107042 | 13 07 26.2 29 18 24 | 0.525 | Q1 | 21.41 | -20.3 | 0.36 | 2.8(3.6) | 116bbKoo et al. (1995) | 25.2 | VCC437 |
| SA68 | 217418 | 00 17 45.3 16 07 47 | 0.553 | Q1 | 21.20 | -20.7 | 0.30 | 3.0(3.8) | 21.0 | LARGE | |
| SA57 | 118170 | 13 07 38.8 29 35 26 | 0.586 | Q2 | 21.30 | -20.8 | 0.35 | 2.9(3.7) | 25.8 | intermed | |
| SA57 | 108945 | 13 08 37.8 29 21 15 | 0.608 | Q2 | 21.31 | -20.9 | 0.39 | 2.8(3.6) | 25.8 | intermed | |
| SA57 | 117731 | 13 08 38.2 29 34 48 | 0.663 | Q1 | 20.65 | -21.8 | 0.31 | 3.1(3.9) | 103bbKoo et al. (1995) | 25.8 | VCC437 |
| SA68 | 209640 | 00 17 55.3 15 53 30 | 0.728 | Q1 | 21.48 | -21.4 | 0.39 | 2.9(3.7) | 21.0 | NGC205 | |
| Compact Galaxies | |||||||||||
| SA68 | 205935 | 00 17 41.2 15 47 36 | 0.304 | Q1 | 20.45 | -19.8 | 0.27 | 2.7(3.6) | 21.0 | LARGE | |
| SA57 | 103605 | 13 07 53.0 29 12 53 | 0.392 | Q1 | 21.23 | -19.6 | 0.34 | 2.7(3.4) | 37bbKoo et al. (1995) | 25.2 | LARGE |
| SA57 | 104259 | 13 08 03.4 29 14 00 | 0.601 | Q1 | 21.01 | -21.2 | 0.38 | 2.8(3.6) | 52bbKoo et al. (1995) | 25.8 | LARGE |
Note. — Basic properties of the final sample of CNELGs and compact galaxies: (1) Field, (2) ID number from the original study, (3) J2000 coordinates, (4) redshift, (5) quality of redshift information: Q1: high-quality redshift,Q2: one-line identification, Q3: low-quality redshift, (6) measured -band apparent magnitude, (7) computed rest-frame -band absolute magnitude, (8) computed rest-frame color, (9) maximum fading in magnitudes of the CNELG to the present day corresponding to the color without (with) reddening correction and lookback time (see § 3.1.1), (10) emission-line velocity dispersion from the literature, (11) imaging exposure time in for this study, and (12) classification from § 3.1: NGC205 = like NGC 205, intermed = between NGC 205 and VCC 437, VCC437 = like VCC 437, and LARGE = larger than VCC 437 (disk galaxy-like).
| Field | ID | 2 kpc disk | 5 kpc disk | 10 kpc disk |
|---|---|---|---|---|
| SA57O | 111867 | 23.3 | 25.7 | 26.6 |
| SA57N | 111255 | 24.1 | 26.2 | 27.0 |
| SA68E | 208846 | 23.1 | 25.4 | 26.5 |
| SA57P | 112259 | 22.8 | 26.0 | 27.0 |
| SA68F | 212668 | 21.5 | 23.7 | 25.2 |
| SA68H | 217054 | 21.9 | 24.5 | 25.9 |
| SA68C | 206134 | 21.5 | 24.5 | 25.9 |
| SA68A | 203307 | 22.0 | 24.4 | 25.6 |
| SA57K | 108954 | 21.1 | 23.9 | 25.3 |
| SA68J | 217255 | 19.9 | 22.7 | 24.2 |
| SA68I | 217169 | 22.0 | 24.3 | 25.6 |
| SA68L | 217779 | 21.4 | 24.0 | 25.7 |
| SA68G | 212916 | 20.4 | 23.2 | 24.8 |
| SA57Q | 112536 | 21.3 | 23.6 | 24.9 |
| SA57G | 110601 | 20.2 | 23.0 | 24.7 |
| SA57L | 108956 | 21.0 | 23.4 | 24.7 |
| SA57D | 105482 | 20.2 | 22.8 | 24.3 |
| SA68D | 206403 | 20.2 | 23.2 | 24.8 |
| SA68N | 215428 | 20.1 | 23.4 | 25.3 |
| SA68O | 216388 | 19.9 | 22.8 | 24.6 |
| SA57R | 117671 | 20.3 | 23.0 | 24.5 |
| SA57F | 107042 | 20.8 | 23.1 | 24.7 |
| SA68K | 217418 | 20.2 | 22.4 | 23.9 |
| SA57S | 118170 | 19.7 | 22.3 | 24.0 |
| SA57J | 108945 | 19.7 | 22.7 | 24.4 |
| SA57H | 117731 | 19.1 | 21.5 | 22.9 |
| SA68M | 209640 | 19.2 | 22.0 | 23.6 |
| Compact Galaxies | ||||
| SA68B | 205935 | 21.2 | 23.8 | 25.3 |
| SA57B | 103605 | 20.7 | 23.6 | 25.0 |
| SA57C | 104259 | 19.3 | 22.0 | 23.6 |
Note. — The maximal central surface brightness of disks accomodated by our data: (1) Field, (2) ID number, and maximal -band surface brightness for a disk with an Sbc-type spectral energy distribution and a scale length of (3) 2 kpc, (4) 5 kpc, and (5) 10 kpc. We note that maximal central surface brightnesses become substantially less accurate at for 5 kpc disks and and at for 10 kpc disks.