0 [
] Photometry of the roAp star
HD 134214
C. Cameron1, J.M. Matthews1, J.F. Rowe1, R. Kuschnig1, D.B. Guenther2, A.F.J. Moffat3, S.M. Rucinski4, D. Sasselov5, G.A.H. Walker6, W.W. Weiss7
1Dept. of Physics and Astronomy, UBC, 6224 Agricultural Road,
Vancouver,
BC, V6T 1Z1, Canada
2Dept. of Astronomy and Physics, Saint Mary’s University,
Halifax, NS, B3H 3C3, Canada
3Dépt. de physique, Univ. de Montréal C.P. 6128, Succ. Centre-Ville,
Montréal, QC H3C 3J7, Canada; and Obs. du Mont Mégantic
4Dept. of Astronomy & Astrophysics, David Dunlap Obs., Univ. Toronto
P.O. Box 360, Richmond Hill, ON L4C 4Y6, Canada
5Harvard-Smithsonian Center for Astrophysics, 60 Garden Street,
Cambridge, MA 02138, USA
61234 Hewlett Place, Victoria, BC V8S 4P7, Canada
7Institut für Astronomie, Universität Wien Türkenschanzstrasse 17,
A–1180 Wien, Austria
Abstract
We present 10.27 of photometry of the roAp star HD 134214 obtained by the 111 (Microvariability and Oscillations of STars) is a Canadian Space Agency mission, operated jointly by Dynacon, Inc., and the Universities of Toronto and British Columbia, with assistance from the University of Vienna. satellite. The star is shown to be monoperiodic and oscillating at a frequency of 2948.970.55. This is consistent with earlier ground based photometric campaigns (e.g. Kreidl et al. 1994). We do not detect any of the additional frequencies identified in the recent spectroscopic study by Kurtz et al. (2006) down to an amplitude limit of 0.36 ( significance limit).
1 1. Introduction
The rapidly oscillating Ap stars (roAp) represent a unique subset of the chemically peculiar stars of the upper main sequence. In general, the Ap stars have globally organised magnetic fields of strengths of order kiloGauss, and spectral anomalies that are interpreted as vertical and horizontal chemical inhomogeneities in the stellar atmosphere. The roAp stars (among the coolest members of the Ap class) exhibit rapid oscillations in photometry and spectroscopy. These variations (first observed by Kurtz (1982)) have periods from about 5 to 20 minutes and low amplitudes (B 10 mmag). They are consistent with acoustic (p-mode) pulsations of low degree and high radial overtone. A thorough review of the roAp stars is provided by Kurtz & Martinez (2000).
HD 134214 is in many ways a typical Ap star. It has an effective temperature of 7500 K, is a moderately slow rotator with a km/s, and has a strong magnetic field with kG (parameters are derived in Shavrina et al. 2004). However, among the roAp stars, HD 134214 stands alone as the star with the shortest known period ( minutes). This high frequency oscillation is well above the estimated isothermal acoustic cutoff for a typical A-star model (see, e.g., Audard et al. 1998). There is also evidence that this oscillation frequency is variable at the level of a few tenths of over a time scale of approximately one year, even though the amplitude remained stable over many years (see Kreidl et al. 1994). Kurtz (1995) discuss the frequency variability observed in this and other roAp stars.
Recently, Kurtz et al. (2006) have shown that in some roAp stars the spectroscopic variability is dramatically different from that observed photometrically. Although HD 134214 is observed to be monoperiodic in photometry over many years (Kreidl et al. 1994), Kurtz et al. present evidence for up to 6 periodicities in their (admittedly short) spectroscopic time-series of this star.
In this paper we present (Microvariability & Oscillations of STars) spacebased photometry of HD 134214 and compare the observed oscillations to the results of Kurtz et al. (2006).
2 2. Photometry and Frequency Analysis
is a Canadian microsatellite that was launched into a 820-km Sun-synchronous polar orbit in June 2003. Its primary science objective is to obtain nearly continuous, ultra-precise photometric measurements of stars for the purposes of asteroseismology. The instrument is a 15-cm Rumak-Maksutov telescope that illuminates a CCD photometer through a custom broadband filter (350-700 nm). Detailed technical information on the instrument is contained in Walker, Matthews et al. (2003). The first science results for the mission were published by Matthews et al. (2004).
The roAp star HD 134214 was observed by as a trial Direct Imaging target on 1 May 2006. Direct Imaging is the observing mode where a defocused star image is projected onto an open area of the Science CCD (see Rowe et al. 2006; and references therein, in this issue for more details on different observing modes of ). The star was in one of two target fields observed during each satellite orbit (period = 101.413 min), so data are collected with a duty cycle of only 47%. Exposures are 1.5 sec long, obtained every 10 seconds. There were a total of 505 measurements collected during 10.27 hrs.
Photometric reductions for Direct Imaging targets are described by Rowe et al. (2006b). In addition to these procedures, the data are detrended using a running mean of approximately 15 mins to reduce any remaining low-frequency contributions to stray light from scattered Earthshine which is modulated with the satellite orbital period. This detrending does not influence the high-frequency domain of interest for roAp oscillations. The resulting changes in the mean level of the light curve are not large enough to affect the measured amplitude of the oscillation signal, within the uncertainty from the fit (see below).

The reduced photometry is presented in Figure 1. The light curve of HD 134214, shown in the top panel, has a standard deviation of mmag and a standard error of 0.2 mmag. Data subsets labelled A and B are shown in the lower two panels.
Frequency determinations are made using CAPER; see Walker et al. (2005) and Saio et al. (2006). CAPER is an iterative procedure that identifies periodicities in Fourier space and simultaneously fits a set of sinusoids in the time domain. This method of determining oscillation parameters from time-series data follows the philosophy of the popular software packages Period98 (Sperl 1998) and Period04 (Lenz & Breger 2005). Discrete Fourier Transforms (DFTs) are calculated and the fit is subtracted from the data successively, until there is no meaningful change in the fit residuals.
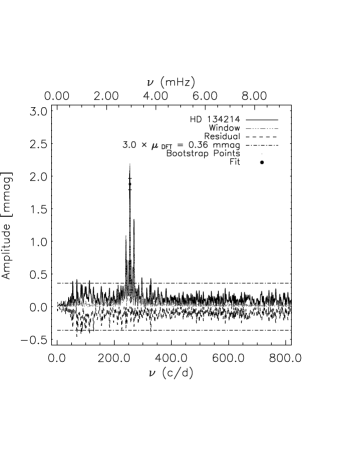
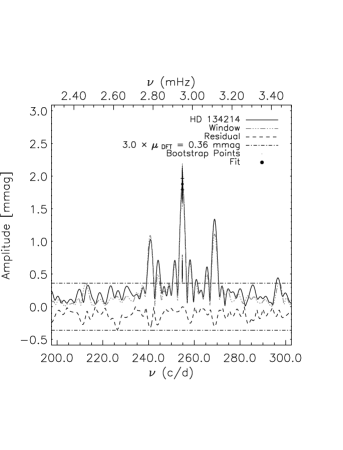
The DFT and spectral window function for the HD 134214 data are shown in Figure 2. There is one periodicity identified at 2948.970.55 with a signal-to-noise ratio of 15.4. The noise in the Fourier domain was estimated as the mean of the entire spectrum (0.12 mmag). We see no evidence for other periodicities at a detection threshold of about (or the noise; see Kuschnig et al. 1997). The fitted values of amplitude and phase are 1.880.09 mmag and 1.970.39 radians respectively. The uncertainties in the fit parameters are determined using a bootstrap technique (see below). The dark line in Figure 1 shows the fit of this single sinusoid plotted over the observations.

The uncertainties we calculate for time-series parameters derived from nonlinear least-squares methods depend on the noise of the data (which may be a combination of instrumental and random processes) and on the time sampling. It is also known that fitted phase and frequency parameters are correlated, leading to underestimated uncertainties in these parameters when calculated from a covariance matrix (see, e.g., Montgomery & O’Donoghue 1999).
The ”bootstrap” is an ideal way to assess the uncertainties in fitted parameters for a time-series analysis. The procedure is outlined in Wall & Jenkins (2003) and has recently been used in a number of applications (see, e.g., Rowe et al. 2006b and Saio et al. 2006). Clement et al. (1992) also used a bootstrap to estimate the uncertainties in Fourier parameters they derived for RR Lyrae stars.
In short, the bootstrap is a technique that allows a user to produce a distribution for each calculated parameter by constructing a large number of light curves from the original data. No assumptions need to be made about noise properties of the data and individual photometric errors are not needed. Each new light curve is assembled by randomly selecting N points from the original light curve (also containing N points) with the possibility of replacement. In this way, the new synthetic light curves preserve the noise properties of the original data. The fit procedure is repeated for each new light curve, eventually building distributions in each of the fit parameters. We then estimate the 1 error bars from the analytic expression for the standard deviation of each distribution under the assumption that they are normally distributed. Each distribution is checked to ensure this assumption is valid.
Figure 3 shows the bootstrap distributions for 10,000 realisations of the fit to our data. The phase is the most uncertain parameter. Amplitude and frequency distributions are normal in shape. Overplotted are Gaussians with the standard deviations derived from the distributions. The Gaussians are centred on the original fit parameters. It should be stressed that bootstrapping only estimates the uncertainties in parameters and does not refine them or assign significances to them.
3 3. Discussion
We determine that HD 134214 is monoperiodic and pulsating with a frequency of 2948.970.55. This is consistent with the earlier photometric observations of this star by Kreidl et al (1994). Those authors detected frequency changes which they interpreted as cyclic with a timescale of about 1 year. The frequency resolution of our short run is insufficient to rigorously test this assertion. However, we have considered the implications of pulsational frequency variability in HD 134214.
Heller & Kawaler (1988) have suggested that it may be possible to exploit the frequency variability of roAp stars to determine their evolutionary status. However, the one-year timescale of variability in the case of HD 134214 is too short to be associated with evolution. We have also modelled the amplitude of the frequency change over the main sequence life time of an A-type star. We estimate that a 20 year baseline of observations would show a frequency change on the order of . This is much smaller than the change of reported by Kreidl et al (1994). Cameron et al. (in preparation) have shown that taking magnetic perturbations to the oscillation frequencies into account does not improve the discrepancy between the observed and calculated frequency changes.
Recent results by Kurtz et al. (2006) suggest that HD 134214 is oscillating spectroscopically in up to 6 modes. Our observations can rule out additional photometric oscillations at a detection level of 0.36 mmag. Our estimated DFT noise level of 0.12 mmag for 10 hours of observations with is comparable to that obtained by Kreidl et al. (1994) based on about 56 hours of photometry from four observatories during about 4 months. The excitation and selection of pulsation modes in roAp stars is an open question. In the case of HD 134214, there are several avenues to be explored with respect to the additional modes seen spectroscopically: (1) Is it a case of radial velocities of certain elements and ionisation stages being more sensitive to degrees of higher ? (2) If the sensitivity of the photometry can be improved sufficiently, will these modes also appear? (3) Is the broadband photometry just averaging over too wide an extent of the pulsating atmosphere? or (4) Might there be new physics in the upper atmospheres of (some) roAp stars to account for the differences observed?
We estimate that even observations over only a few days with would (in addition to improving our frequency resolution enough to investigate cyclic variability) reduce our noise levels by approximately half. Even this modest improvement in noise would be valuable as a test of the Kurtz et al. (2006) theory that photometric observations are not sensitive to the new type of upper atmosphere pulsational variability they report.
Acknowledgements.
JMM, DBG, AFJM, SR, and GAHW are supported by funding from the Natural Sciences and Engineering Research Council (NSERC) Canada. RK is funded by the Canadian Space Agency. WWW received financial support from the Austrian Science Promotion Agency (FFG - MOST) and the Austrian Science Funds (FWF - P17580). ReferencesAudard, N., et al. 1998, A&A, 335, 954
Cameron, C. et al. (in preparation)
Clement, C. M., Jankulak, M., & Simon, N. R. 1992, ApJ, 395, 192
Heller, C. H., & Kawaler, S. D. 1988, ApJ, 329, L43
Kreidl, T. J., et al. 1994, MNRAS, 270, 115
Kurtz, D. W. 1982, MNRAS, 200, 807
Kurtz, D. W. 1995, ASP Conf. Ser. 76: GONG 1994. Helio- and Astro-Seismology from the Earth and Space, 76, 60
Kurtz, D. W., & Martinez, P. 2000, Baltic Astronomy, 9, 253
Kurtz, D. W., Elkin, V. G., & Mathys, G. 2006, MNRAS, 370, 1274
Kuschnig, R., et al. 1997,A&A,328, 544
Lenz, P., & Breger, M. 2005, Communications in Asteroseismology, 146, 53
Matthews, J. M., et al. 2004, Nature, 430, 51
Montgomery, M. H., & O’Donoghue, D. 1999, DSSN (Vienna), 13
Rowe, J. F., et al. 2006, CoAST (this issue)
Rowe, J. F., et al. 2006b, ApJ, 646, 1241
Saio, H., et al. 2006, ApJ, in press
Shavrina, A., et al. 2004, IAU Symposium, 224, 711
Sperl, M. 1998, Communications in Asteroseismology, 111, 1
Walker, G., et al. 2003, PASP, 115, 1023
Walker, G., et al. 2005, ApJ, 635, L77
Wall, J. V., & Jenkins, C. R. 2003, Practical Statistics for Astronomers,Cambridge,Cambridge University Press