XMM-Newton survey of the central region of M31. Spectral properties and variability of bright X-ray sources and source classification.
Abstract
We present the results of the systematic survey of X-ray sources in the central region of M31 using the data from XMM-Newton observations performed in the years 2000-2004. The spectral properties and variability of 123 bright X-ray sources with apparent luminosities between and ergs s-1 were studied in detail. The spectral properties of majority of sources in our sample have been found to be consistent with that of the low-mass X-ray binary systems. 20 sources in our sample coinside with globular clusters in M31, four sources are supernova remnant candidates and another six sources can be classified as background AGN candidates. The spectral distribution of M31 X-ray sources, based on the spectral fitting with a power law model is clearly bimodal with a main peak corresponding to a photon index and a shoulder at extending to the soft spectral region. The spectral distribution shows clear evolution with source luminosity, characterized by its narrowing and shift of its main peak to the harder spectral region for luminosities above ergs s-1. The spectral properties of the high-luminosity sources in our sample closely resemble those of the bright LMXB in nearby galaxies of different morphological type. The distribution of absorbing columns towards M31 sources derived from spectral analysis has a peak at N cm-2 extending up to cm-2, with an average value of cm-2. More than 80% of sources observed in two or more observations show significant variability on the time scales of days to years. The fraction of variable sources in our survey is much higher than previously reported from Chandra survey of M31, and is remarkably close to the fraction of variable sources found in the M31 globular cluster X-ray source population. Timing analysis of several of the brightest sources reveals significant aperiodic variability in the Hz frequency range, resembling the very-low frequency variability of the bright Galactic LMXB. About 50% of the sources in our sample are spectrally variable. The spectral evolution of a number of sources is correlated with the level of their X-ray flux, while some sources demonstrate complex patterns of evolution on the hardness-intensity diagram.
Based on the similarity of the properties of M31 X-ray sources and their Galactic counterparts, we expect most of the X-ray sources in our sample to be accreting binary systems with neutron star and black hole primaries. A total of 44 X-ray sources can be identified as probable X-ray binaries. We show that X-ray hardness-luminosity (spectral photon index vs. luminosity) diagrams can be an effective tool for characterising X-ray binary populations in external galaxies and classification of individual sources as neutron star and black hole candidates. Combining the results of X-ray analysis (detailed X-ray spectra, hardness-luminosity diagrams and variability) with available data at other wavelengths, we classify 7% and 24% of sources in our sample as, respectively, probable black hole and neutron star candidates.
Subject headings:
galaxies: individual (M31) — X-rays: binaries — X-rays: stars1. INTRODUCTION
X-ray surveys of external galaxies are important for understanding populations of X-ray binaries and supernova remnants in these galaxies and our own Milky Way. The statistical study of the spatial and spectral distribution of these sources can help us to distinguish between different physical classes of X-ray emitters. X-ray binaries and supernova remnants comprise a fossil record of the stellar population, and may be used as a probe of galactic dynamics and star formation history. A detailed study of spectral properties and variability of X-ray binaries, combined with results of observations at other wavelengths, can help to distinguish between systems with black hole and neutron star primaries, providing invaluable information on the binary stellar evolution.
The nearby, giant spiral M31 presents an excellent opportunity to study the global properties of a galaxy that is in many respects similar to our own. The proximity, well-established distance and favorable inclination of M31 galactic disk allow effective study and comparison of its X-ray source populations and their association with the bulge, spiral arms, or halo components. M31 has been observed extensively by Einstein, ROSAT, Chandra and XMM-Newton missions (Trinchieri & Fabbiano 1991; Primini et al. 1993; Supper et al. 2001; Shirey et al. 2001; Kong et al. 2002a; Williams et al. 2004a; Pietsch et al. 2005). Recent X-ray observations with Chandra and XMM-Newton has started to reveal important similarities and differences between X-ray source populations and hot interstellar medium in the bulge and disk of M31, and has allowed direct comparisons to the Milky Way galaxy (Shirey et al. 2001; Trudolyubov et al. 2002a; DiStefano & Kong 2003; Trudolyubov et al. 2005b). The advanced capabilities of XMM-Newton and Chandra have allowed a detailed study of the variability and spectral properties of a large number of individual sources belonging to different classes of X-ray emitting objects like globular cluster sources, supersoft sources and supernova remnants (DiStefano et al. 2002; Kong et al. 2002b; Trudolyubov & Priedhorsky 2004; Di Stefano et al. 2004). The spectral and timing analysis of individual bright M31 sources has allowed for the identification of some of them as accreting X-ray binaries and has revealed striking similarities between them and their Galactic counterparts. Timing studies of M31 X-ray sources led to discovery of X-ray pulsations (Osborne et al. 2001; Trudolyubov et al. 2005b), periodic dipping (Trudolyubov et al. 2002b; Mangano et al. 2004) and short bursts (Pietsch & Haberl 2005). The spectral properties and evolution of a number of M31 sources have led to their classification as probable black hole, neutron star or white dwarf systems. Regular monitoring observations of M31 have revealed several dozens of transient and recurrent X-ray sources ranging from black hole candidate X-ray novae to supersoft transient systems (Trudolyubov et al. 2001; Williams et al. 2006).
Observations of the central part of M31 provide a unique opportunity to study stellar populations of the bulge and inner disk of the galaxy. This resion contains a significant fraction of the stellar mass of M31 and is the most densely populated region in X-rays with nearly 300 individual sources detected to date (Kong et al. 2002a; Pietsch et al. 2005). In this work we present the results of our survey of spectral properties and variability of 123 brightest sources detected in the the central part of M31 ( radius), using data from XMM-Newton observations.
2. OBSERVATIONS AND DATA ANALYSIS
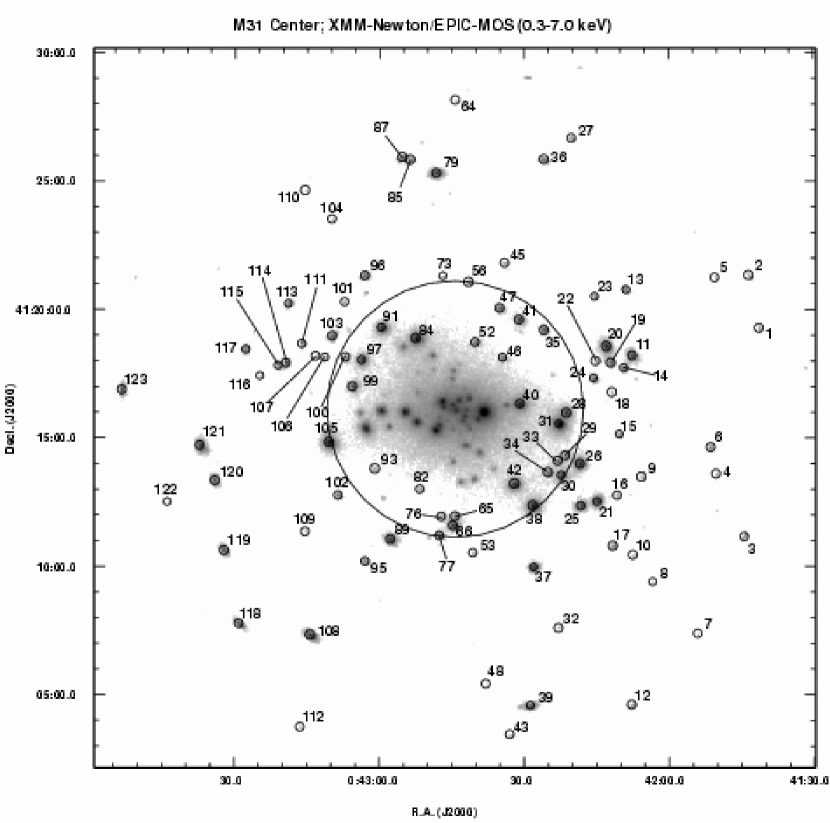
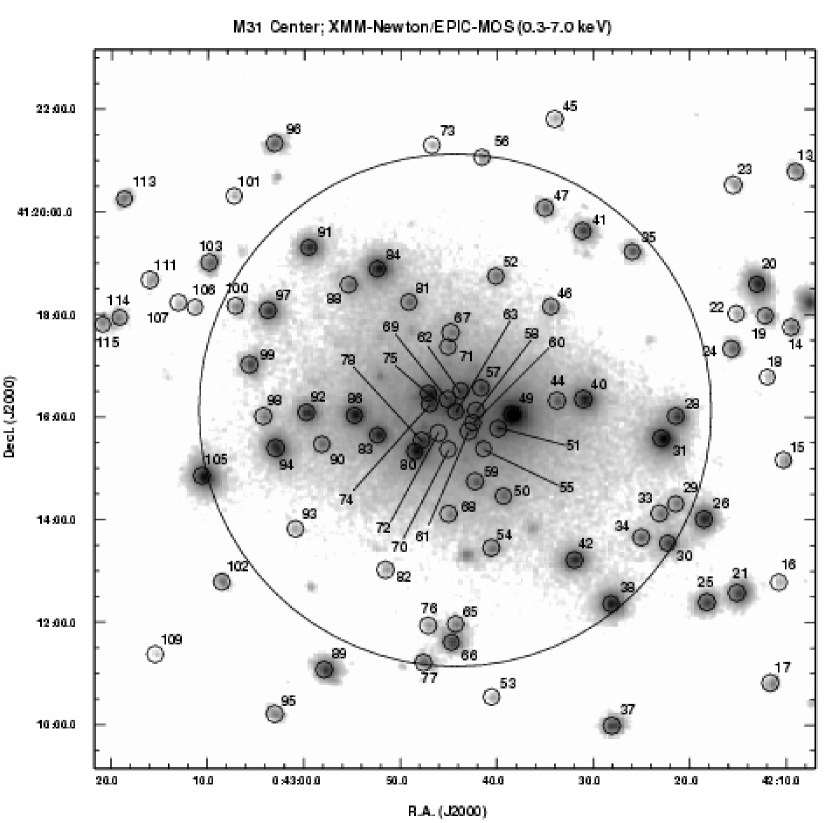
The central region of M31 was observed with XMM-Newton on 8 occasions in years 2000 – 2004 (Table 1; Fig. 1). In the following analysis we use the data from three European Photon Imaging Camera (EPIC) instruments: two EPIC MOS detectors Turner et al. (2001) and the EPIC-pn detector Strueder et al. (2001). In all observations EPIC instruments were operated in the full window mode ( FOV) with the medium and thin optical blocking filters.
We reduced EPIC data with the latest version of XMM-Newton Science Analysis System (SAS v 6.5.0)111See http://xmm.vilspa.esa.es/user. Each of the original event files were screened for periods of high background. The remaining exposure times for each observation are listed in Table 1. The 2004 July 17 observation is affected by high background, so we excluded it from the analysis.
We generated EPIC-pn and MOS images of the central region of M31 (Fig. 1) in the 0.3 – 7.0 keV energy band, and used the SAS standard maximum likelihood (ML) source detection script edetect_chain to detect and localize point sources. We used bright X-ray sources with known optical counterparts from USNO-B Monet et al. (2003) and 2MASS catalogs Cutri et al. (2003) to correct EPIC image astrometry. After applying the astrometric correction, we estimate residual systematic error in the source positions to be of the order .
To generate lightcurves and spectra of X-ray sources, we used elliptical extraction regions with semi-axes size of (depending on the distance of the source from the telescope axis) and subtracted as background the spectrum of adjacent source-free regions, with subsequent normalization by ratio of the detector areas. For spectral analysis, we used data in the keV energy band. For the sources with soft (SNR candidates) and supersoft X-ray spectra we considered only the and keV spectral ranges, since their flux was negligible above 3.0 and 1.5 keV respectively. We used spectral response files generated by XMM SAS tasks. Spectra were grouped to contain a minimum of 20 counts per spectral bin in order to allow statistics and fit to analytic models using the XSPEC v.11222http://heasarc.gsfc.nasa.gov/docs/xanadu/xspec/index.html fitting package Arnaud (1996). EPIC-pn, MOS1 and MOS2 data were fitted simultaneously, but with normalizations varying independently.
We performed timing studies of the sources in our sample, using standard XANADU/XRONOS v.5333http://heasarc.gsfc.nasa.gov/docs/xanadu/xronos/xronos.html tasks. We generated source and background X-ray lightcurves in the keV energy band with 5.2s time resolution using the data of individual EPIC detectors. For SNR candidates and supersoft sources the lightcurves in the keV energy range were extracted. To improve statistics, properly synchronized lightcurves from individual detectors were added to produce combined EPIC lightcurves for each source. To synchronize source and background lightcurves from individual detectors, we used the same time filtering criteria based on Mission Relative Time (MRT) (see also Barnard et al. 2006b). Fourier power density spectra (PDS) in the Hz frequency range were produced using both individual detector and combined EPIC background-subtracted lightcurves. The spectra were logarithmically rebinned when necessary to reduce scatter at higher frequencies and normalized such that the white noise level expected from the data errors corresponds to a power of 2 (Leahy-normalized)Leahy et al. (1983). In several cases, when significant aperiodic variability was detected, the PDS were also normalized to the square of fractional r.m.s. variability, with the expected white noise level subtracted.
In the following analysis we assume M31 distance of 760 kpc (van den Bergh 2000). All parameter errors quoted are 68% () confidence limits.
3. Source Identification
We study a sample of 123 X-ray sources in the central region of M31 selected on the basis of their brightness; each source was required to have more than 300 counts in the EPIC during at least one observation. The information on the positions, spectral properties and identifications of the X-ray sources is shown in Table 2. The combined EPIC-MOS image of the central region of M31 with source positions marked with circles is shown in Fig. 1.
We searched for the X-ray, optical, infrared and radio counterparts to the sources in our sample using the existing catalogs and images from the CTIO/KPNO Local Group Survey (LGS) Massey et al. (2001) and the Second Generation Digitized Sky Survey. We varied the search radius based on both the accuracy of the catalogs and localization errors of XMM sources. We used the following catalogs:
i) X-ray sources: the Einstein (Trinchieri & Fabbiano 1991), ROSAT/HRI (Primini, Forman & Jones 1993), Chandra/ACIS (Kong et al. 2002), Chandra/HRC (Williams et al. 2004; Kaaret 2002) and XMM-Newton (Pietsch et al. 2005) catalogs of X-ray sources in the field of M31.
ii) Globular cluster candidates: the Bologna catalog Battistini et al. (1987); Galleti et al. (2004), the catalog by Magnier (1993), and the HST globular cluster candidate catalog Barmby & Huchra (2001). The positions of 20 sources coinside with optically identified globular cluster candidates.
iii) Supernova remnant candidates: the lists by Braun & Walterbos (1993), Magnier et al. (1995) and Ford & Jacoby (1978).
iv) Stellar objects (Galactic foreground stars/background AGN): the catalogs of stellar objects: USNO-B Monet et al. (2003), 2MASS Cutri et al. (2003), catalogs by Magnier et al. (1992) and Haiman et al. (1994) and SIMBAD.
v) Radio sources: VLA All-sky Survey Catalog 444http://www.cv.nrao.edu/nvss/ Condon et al. (1998) and catalogs of radio sources in the field of M31 (Walterbos, Brinks, & Shane 1985; Braun 1990).
All but three new transient sources (#3, 104, 110) in our sample have been previously detected in X-rays. The positions of 20 sources coincide with optically identified globular cluster candidates. The X-ray source #29 has a bright optical counterpart, and has been proposed by Pietsch & Haberl (2005) as possible globular cluster candidate. Four sources (#70, 85, 117, 122) coincide with supernova remnant (SNR) candidates in M31. Six sources (#4, 6, 17, 27, 69, 103), not identified with SNR, have bright radio counterparts, and can be tentatively identified with background AGN. Two of these sources (#6 and 103) also have point-like optical counterparts listed in Magnier et al. (1992) (MLV92 242628 and MLV92 267602) and seen in LGS images. The remaining four sources with radio counterparts have very faint or no detectable optical counterparts.
4. Note on the Effect of Background Sources and Multiple Unresolved X-ray Sources
A notable fraction of the X-ray sources detected in the central region of M31 must be background objects. To estimate the expected contribution of the background sources in our sample, we used the results of the combined X-ray source counts from ROSAT, Chandra and XMM-Newton surveys Moretti et al. (2003). Taking into account spatial coverage of our survey, out of 87 sources with apparent luminosities above ergs s-1 (approximate completeness limit of our sample) should be background objects.
Ten sources in our sample are unresolved composites of the two or more Chandra sources (Table 2). In addition, the spatial resolution of both Chandra and XMM-Newton is not sufficient to resolve most possible multiple X-ray sources within globular clusters in M31 Di Stefano et al. (2002); Trudolyubov & Priedhorsky (2004). Therefore, the effects of spectral blending and superposition of variability may affect the properties of several sources in our sample, and complicate direct comparisons with Galactic X-ray sources.
5. Spectra
The spectra of M31 X-ray sources were fitted with a variety of spectral models using XSPEC v11. We first considered a simple one-component spectral model: an absorbed simple power law. The results of fitting this model to the source spectra are given in Table 2. The spectra of 115 sources in our sample (excluding SNR candidates and supersoft sources) can be generally described by an absorbed simple power law model with a photon index of and an equivalent absorbing column of cm-2. The apparent absorbed luminosities of the X-ray sources in our sample differ by nearly three orders of magnitude and fall between and ergs s-1 in the keV energy band, assuming a distance of 760 kpc.
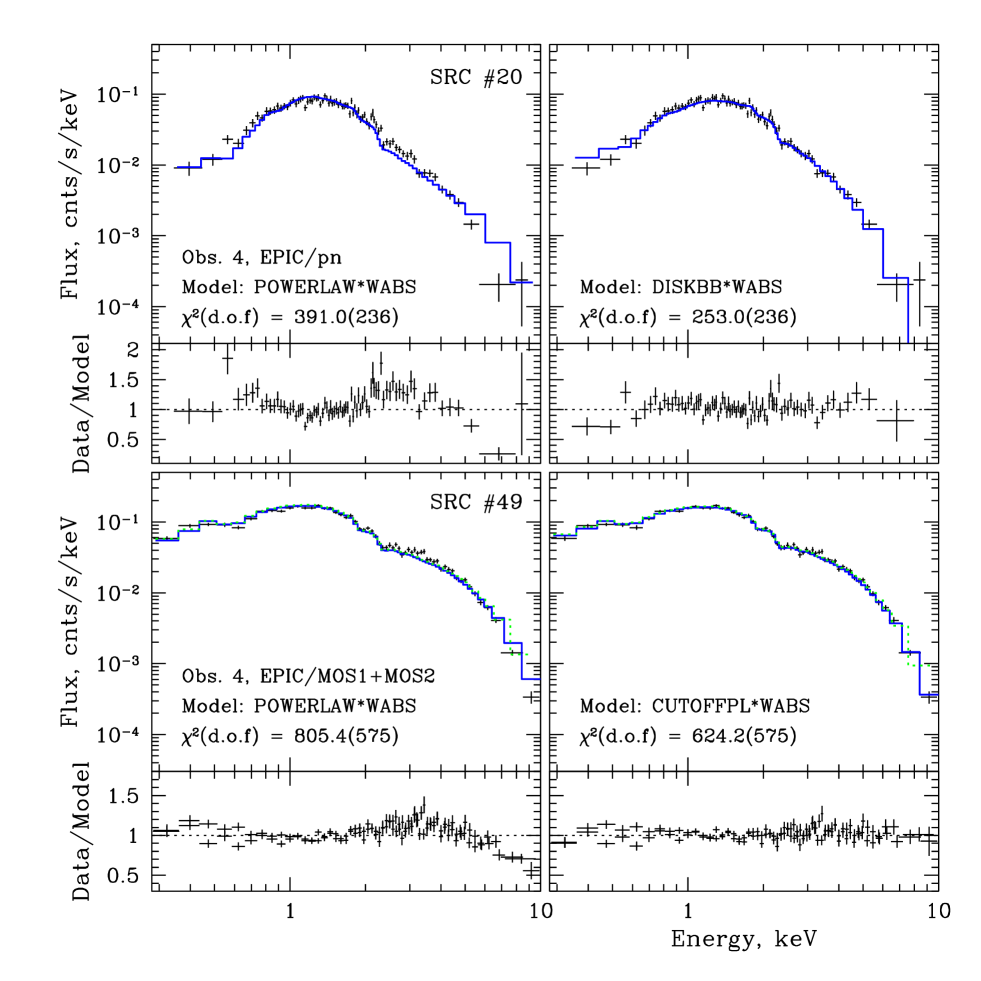
In most cases, we obtained acceptable fits using a power law spectral model. However, for many brighter sources, a complex spectral models are required. For several sources with high luminosities (Table 5,6,7), the models with quasi-exponential cut-off at keV or two-component models describe the energy spectra significantly better than a simple power law (Fig. 3). To approximate the spectra of these sources, we used an absorbed power law model with exponential cut-off (XSPEC CUTOFFPL model), a Comptonization model, a multicolor disk black body (DISKBB) model and a two types of two-component models described below.
For the Comptonization model approximation (Table 6), we used the XSPEC model COMPTT Sunyaev & Titarchuk (1980); Titarchuk (1994). This model includes a self-consistent calculation of the spectrum produced by the Comptonization of the soft photons in a hot plasma. It contains as free parameters the temperature of the Comptonizing electrons, , the plasma optical depth with respect to the electron scattering, and the temperature of the input Wien soft photon distribution, . In our spectral analysis a spherical geometry of the Comptonizing region was assumed.
The spectra of many luminous neutron star LMXB are well fit with a two-component model consisting of a soft black body-like component which might represent emission from an optically thick accretion disk or from the neutron star surface, together with hard component which may be interpreted as emission from a corona-like structure or a boundary layer between the disk and a neutron star (White, Stella & Parmar 1988). For the soft component we used a multicolor disk-blackbody (XSPEC DISKBB)Mitsuda et al. (1984) model. The hard spectral component can be adequately described by various phenomenological and physical models involving a break in the slope of the spectrum or quasi-exponential spectral cut-off at higher energies. For the sake of easier comparison with the results for the Galactic LMXB, we use a simple black body (BBODYRAD) in combination with DISKBB as a soft component to approximate the hard component in the spectra of several bright sources in our sample (probable neutron star candidates).
The other two-component model, used in our analysis of several bright M31 sources (Fig. 2; Table 7), is a combination of absorbed simple power law and DISKBB models, a standard model describing the spectra of Galactic black hole candidates McClintock & Remillard (2006).
5.1. Transient Sources
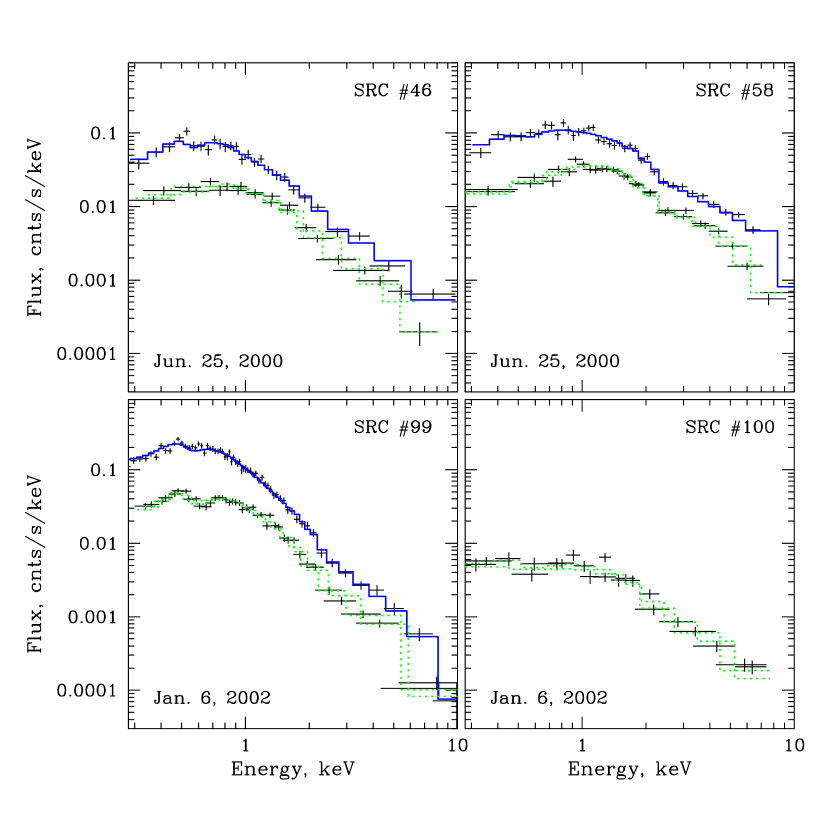
A total of 10 bright transient sources with 0.3 - 10 keV luminosities above ergs s-1 have been detected in seven XMM-Newton observations of the central part of M31 (Osborne et al. 2001; Trudolyubov, Borozdin & Priedhorsky 2001; Pietsch et al. 2005; Trudolyubov, Priedhorsky & Cordova 2006). All of them are included in our source sample (Table 2). Two XMM transients (#7 and 114) have supersoft spectra, five sources (#3, 57, 99, 104, 110) have soft spectra with spectral photon indices above 2.4, and three sources (#46, 58, 100) have harder spectra (Fig. 2; Table 7).
The energy spectra of the two supersoft transient sources (#7 and 114) obtained with XMM/EPIC MOS1 and MOS2 detectors are shown in Figure 2. The EPIC energy spectra of the supersoft transients can be satisfactorily described by the absorbed blackbody radiation models (Table 7). The characteristic spectral temperatures and luminosities of both sources are typical for a supersoft X-ray sources found in our Galaxy and M31 Osborne et al. (2001); Di Stefano et al. (2004).
The energy spectra of the two transient sources (#3 and 57) are soft, and show curvature around 0.6 and 1 keV. Due to the curvature in the source spectra, the DISKBB model provides a significantly better description to the data than a power law (Table 7). The observed spectra and luminosities of the sources bear clear resemblance to the Galactic black hole transients in the high/thermal-dominant state McClintock & Remillard (2006). Both sources have been proposed to be black hole candidates, based on their overall X-ray properties and additional constraints on the optical counterpart (Trudolyubov, Priedhorsky & Cordova 2006; Williams et al. 2005b).
The two-component model including absorbed low-temperature thermal component (DISKBB) and a hard power law tail gives the best description to the EPIC spectra of the transient sources #46 and #99 (Table 7). The X-ray spectra, long-term variability and luminosity of these sources are remarkably similar to the Galactic black hole transients in the low/hard state or during transition from the high/thermal-dominant to the low/hard state (Tomsick & Kaaret 2000; McClintock & Remillard 2006). Both objects have been previously classified as probable black hole candidates based on their X-ray properties and evolution observed with XMM-Newton and Chandra (Trudolyubov, Borozdin & Priedhorsky 2001; Williams et al. 2004a).
The EPIC spectra of the transient source #58 (Garcia et al. 2000, Trudolyubov, Borozdin & Priedhorsky 2001) are relatively hard and show evidence of a high-energy cutoff. The absorbed power law model with exponential cut-off at 4-6 keV provides a significantly better approximation than a simple power law model (Table 7).
The spectrum of the transient source #100 is hard and can be adequately fit by absorbed simple power law with photon index of (Table 7).
The energy spectra of the remaining two transient sources #104 and 110 are soft and can be fit with both steep power law or thermal models with characteristic temperatures of 0.3-0.4 keV (Table 7). The discussion of the detailed spectral analysis of these sources can be found in Trudolyubov, Priedhorsky & Cordova (2006).
5.2. Globular Cluster Sources
The positions of 20 bright X-ray sources are consistent with globular cluster (GC) candidates in M31 (Table 2). The results of the detailed analysis of the properties of 19 globular cluster candidates 555The recurrent X-ray source #77 associated with globular cluster (Primini, Forman & Jones 1993) candidate Bo 128 was not detected during the first four XMM observations in our sample detected in the first four XMM-Newton observations can be found in Trudolyubov & Priedhorsky (2004). In this work, we combine results of the previous study with results of the three subsequent 2004 XMM-Newton observations.
5.3. Supersoft Sources
Besides two transients, two other sources in our sample, #83 and #113 have supersoft spectra. The EPIC energy spectra of the supersoft transients can be generally described by the absorbed blackbody radiation models with characteristic temperature of 50-60 eV (Table 8). Both sources are variable in X-rays, with source #113 remaining below the EPIC detection threshold in some observations and flaring up to ergs s-1 luminosity level (Table 2,8).
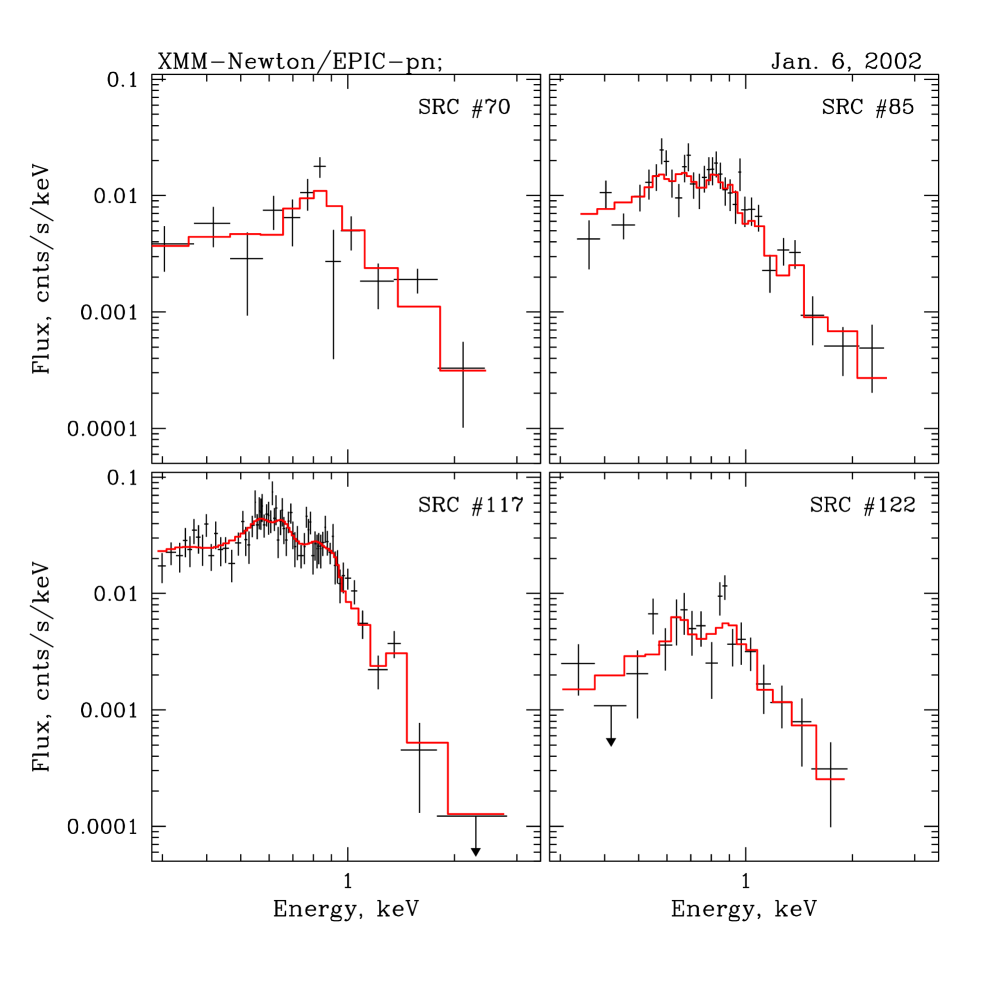
5.4. Supernova Remnants
The positions of three X-ray sources in our sample are consistent with supernova remnant (SNR) candidates from various optical and radio surveys (Baade & Arp 1964; Braun 1990; Braun & Walterbos 1993)(Table 2). In addition, the X-ray source #70 is coincident with planetary nebula candidate from Ford & Jacoby (1978) and has been classified as SNR candidate based on its spectrum and luminosity (Pietsch et al. 2005).The EPIC spectra of all SNR candidates are soft and show clear presence of the emission lines (Fig. 4).
We fitted the spectra of SNR candidates with XSPEC collisional equilibrium thermal plasma (MEKAL) (Mewe et al. 1985; Liedahl et al. 1995), and non-equilibrium ionization collisional plasma (NEI) models with interstellar absorption. The results of the analytical approximation of the XMM/EPIC data for SNR candidates are shown in Table 9.
SNR candidates #85(BA 521) and #117(BA 23). To improve statistical quality of data, we combined the data of three observations (Obs. 1,3,4) of these two SNR candidates. For the MEKAL and NEI models, we first fixed the abundances at solar values Anders & Grevesse (1989). This set of parameters, however, left bump-like residuals indicating that we had overestimated the contribution from O-K, Ne-K and Fe-L shell emission lines. Then we fixed the abundances based on the values determined from optical spectroscopy of the optical counterpart to the sources Blair et al. (1982) with Fe abundance fixed at solar value. Finally, we allowed the O, Ne and Fe abundances to be free parameters. In both cases the quality of the fit improved significantly compared to the same models with fixed solar abundances (Table 9).
The average absorbed keV luminosities of the sources #85 and #117 corresponding to the best-fit MEKAL and NEI models are and ergs s-1 (Table 9), which makes them two brightest thermal SNR candidates detected in M31 to date Trudolyubov & Priedhorsky 2005a ; Pietsch et al. (2005). The plasma temperatures inferred from the best-fit spectral models for the sources #85 and #117 were found to be typical for the SNR candidates in M31 (0.2-0.5 keV), in general agreement with previous results Kong et al. 2002b ; Williams et al. 2004b ; Trudolyubov & Priedhorsky 2005a ; Trudolyubov et al. 2005b .
In their recent paper, based on the XMM and Chandra observations of the source #117(BA 23), Williams et al. (2005d) report on the detection of the high-energy excess in the spectrum of the source, which they attribute to the contamination from nearby X-ray binary. Using the power law approximation, they estimate the contribution of the hard spectral component to be 26% of the total X-ray luminosity. The results of our analysis, based on the larger number of observations, do not confirm their findings. After careful background screening and subtraction, we were not able to detect any statistically significant high-energy excess in the spectra of the source #117 (Fig. 4). To estimate the possible contribution of the hard component, we fit source spectra from individual observations with a two-component model including MEKAL model with varying O, Ne and Fe abundances and a power law with two fixed values of the photon index ( and ). The resulting upper limit on the contribution of the hard component to the total unabsorbed X-ray luminosity is 7% for the power law model with photon index and 16% for .
SNR candidates #70 and 122. Because of the limited statistics, we used only the MEKAL model to approximate the spectra of the two fainter SNR candidates (sources #70 and 122). We first fixed the abundances at solar values, and then allowed the O, Ne and Fe abundances to be free parameters. The models with free O, Ne and Fe abundances give marginal improvement of the quality of the fit as compared to the fixed solar abundances (Table 9). The best-fit models give plasma temperatures of keV for the source #70 and keV for the source #122, typical for thermal SNR in M31 Trudolyubov & Priedhorsky 2005a ; Kong et al. 2002b , and an absorbed keV luminosities of and ergs s-1 respectively.
6. Spectral Distribution
To characterize the overall spectral properties of the bright M31 X-ray sources, we constructed a distribution of their spectral indices in the keV energy range using the model fits to XMM-Newton/EPIC data with an absorbed simple power law (Fig. 5). We chose this spectral model because it gives adequate representation to the spectra of most sources in our sample and allows easier comparison to the results of studies of X-ray binary populations in other galaxies (Irwin et al. 2003; Fabbiano & White 2006; Fabbiano 2006 and references therein). The sources with extremely soft spectra (supersoft sources and thermal supernova remnants) were excluded from the sample. For the sources with multiple spectral measurements, we used weighted average values of the photon index. The spectral hardness distribution including 115 sources spans a wide range of photon indices between and , and has an asymmetric shape with main concentration between and and additional groups of sources with soft and hard spectra (Fig. 5). The overall properties of the spectral distribution of the sources in our sample are generally consistent with results of earlier observations (Shirey et al. 2001). The main part of the distribution has a dominant peak at and an additional shoulder at . The model approximation with a sum of two Gaussian functions provides a significantly better fit to the main part of hardness distribution of M31 X-ray sources in the range when compared to a single Gaussian model fit. The model fit with a single Gaussian function is not adequate with reduced =9.4. The fit with sum of two Gaussians with centroids at and , and widths of and , accounting for and of the total number of sources, yields significantly lower =1.3. This is the first case in which we clearly see bimodality of the spectral distribution of X-ray sources in an external normal galaxy.
6.1. Evolution of Spectral Distribution with Source Luminosity
In order to study the dependence of the spectral hardness distribution on the source luminosity, we constructed three separate hardness distributions for sources with apparent luminosities below ergs s-1 (Fig. 6, lower panel)(low luminosity subsample), between and ergs s-1 (Fig. 6, middle panel) (intermediate luminosity subsample), and brighter than ergs s-1 (Fig. 6, upper panel) (high luminosity subsample). Each of the three distributions have a distinct central concentration and outlying parts representing soft and hard sources. Visual inspection of Fig. 6 suggests that the spectra of the most luminous sources (L ergs s-1) are generally harder than that of the fainter sources. This can be confirmed with a statistical analysis. We used a Kolmogorov-Smirnov (KS) test to determine whether three hardness distributions shown in Fig. 6 were drawn from the same distribution. The results for the low and intermediate luminosity subsamples are consistent with the same parent population. The hypotheses that the high luminosity distribution is extracted from the same parent distribution as the intermediate and low luminosity distributions can be rejected at the confidence levels of 98.9% and 99.2% respectively.
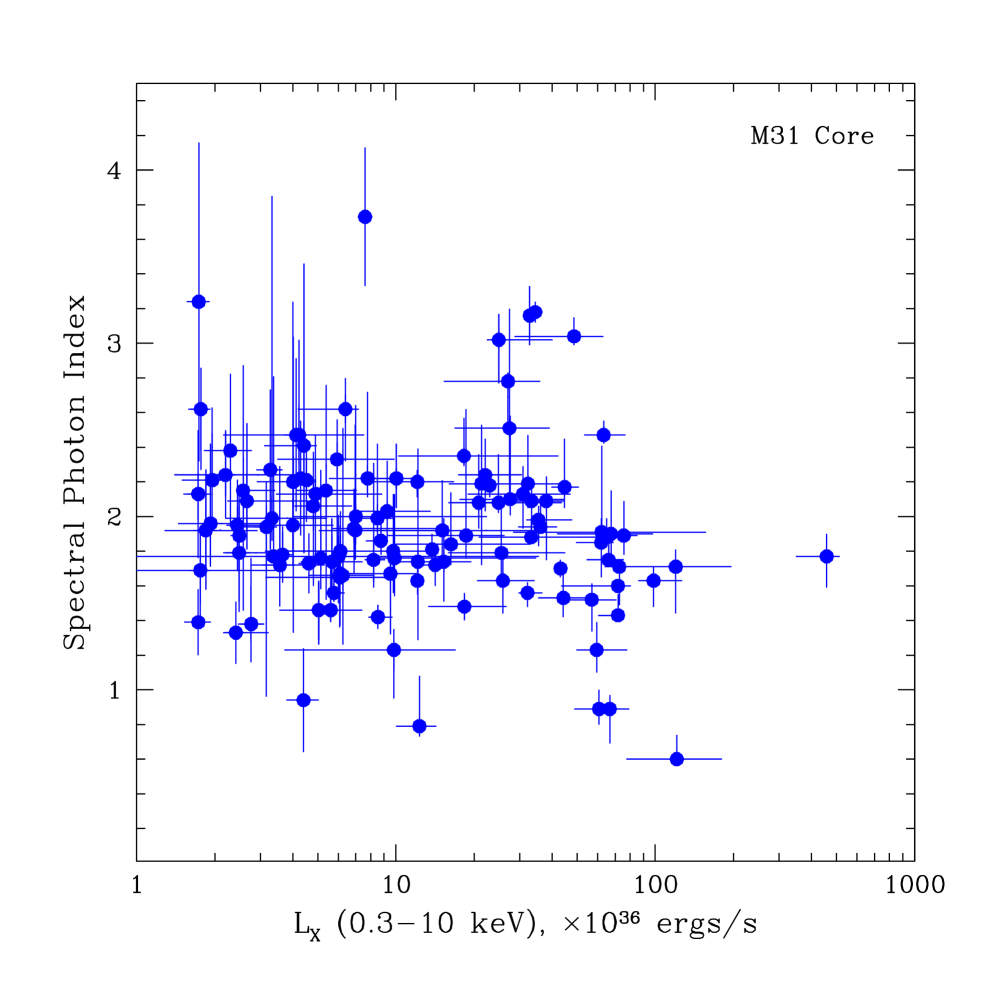
7. X-ray Hardness-Luminosity Diagram
We studied the relation between the hardness of the spectrum and luminosity of X-ray sources in our sample using the results of spectral model fitting. In Fig. 7 the hardness of the spectrum of X-ray sources expressed in terms of spectral photon index is shown as a function of their absorbed X-ray luminosity in the keV energy band calculated assuming the distance of 760 kpc. The sources with extremely soft spectra (supersoft sources and thermal supernova remnants) have been excluded from the sample and are not shown in this plot. The sources in the low-luminosity ( ergs s-1) part of the diagram show a wide scatter of photon indices (). At higher luminosities ( ergs s-1), one can identify tree main source concentrations/branches in the hardness-intensity diagram. The first densely populated group comprises sources with the spectral photon indices with the most luminous sources having narrower range of photon indices . The two other groups include sources with soft spectra () and sources with extremely hard spectra ().
8. Low-Energy Absorption
The X-ray absorption in the source spectra could provide information on their location and help to map the structure of ISM inside M31 Trudolyubov & Priedhorsky (2004). We estimated the value of equivalent hydrogen absorbing column, for each source in our sample from the best-fit model approximation of their spectra (Tables 2,5,6,7, 8)666It should be noted, that the amount of low-energy absorption derived from spectral fitting is usually sensitive to the type of continuum model used to approximate X-ray spectrum. The choice of a particular spectral model introduces additional uncertainty in the value of Trudolyubov & Priedhorsky (2004). For the sources with multiple spectral measurements, we used weighted average values of . The resulting distribution of absorbing columns towards X-ray sources in the central M31 field is shown in Fig. 8. For the majority of sources in our sample the derived value of is either in excess or consistent with Galactic hydrogen column cm-2 in the direction of M31 Dickey & Lockman (1990). The distribution of absorbing columns has a prominent peak centered at cm-2 and a tail structure extending to higher columns with most absorbed source having cm-2 (Fig. 8). The average value of derived from our source sample is cm-2 or approximately twice the Galactic foreground value. Given a considerably large size and completeness of our source sample, it can be used as a measure of the average level of X-ray absorption towards sources in M31.
9. Variability of M31 sources
9.1. Long-term flux variability
Combining the data of multiple XMM-Newton observations, we searched for long-term flux variability of sources in our sample. We found that more than 80% of sources observed in two or more observations show significant variability (at the level of and higher). Ten sources in our sample are transients with outburst-to-quiescent luminosity ratios of . Three other sources show recurrent outbursts on the time scales of years (Table 2). The fraction of variable sources in our survey is much higher than 50% reported from earlier Chandra/ACIS survey of the central region of M31 (Kong et al. 2002a). On the other hand, it is remarkably close to the fraction of variable sources () found in M31 GC X-ray source population Trudolyubov & Priedhorsky (2004) and in the smaller sample of bright M31 X-ray sources (90%)(Barnard et al. 2006a).
9.2. Short-term aperiodic variability
The XMM-Newton observations of the central part of M31 have led to the detection of a periodic variability of three sources included in our sample: X-ray pulsations in the supersoft transient source #115 (Osborne et al. 2001) and periodic dipping in the GC X-ray source #109 (Trudolyubov et al. 2002b) and in the source #103 (Mangano et al. 2004). A detection of strong aperiodic variability in a number of M31 sources has been also reported (Barnard et al. 2003a; Barnard et al. 2004; Williams et al. 2005a; Barnard et al. 2006a). The reported variability has been characterized by broken power law PDS with a break at Hz, and interpreted as a signature of the disk-accreting X-ray binaries. However, recently it has been discovered that this aperiodic variability has artificial origin, resulting from improper addition of lightcurves from individual EPIC detectors (Barnard et al. 2006b).
We re-examined the data of XMM-Newton observations in a search for short-term aperiodic variability of X-ray sources in our sample. For each observation, we constructed power density spectra of X-ray sources in the Hz frequency range using the lightcurves from individual and combined EPIC detectors. Because of the lack of statistics, none of the sources in our sample shows detectable aperiodic variability at frequencies above Hz. The PDS of majority of sources do not indicate significant source variability over the wide range of frequencies, being consistent with white noise expected from data errors. Typical examples of the Leahy-normalized broad-band power density spectra of M31 sources with no detectable variability are shown in Fig. 9. However, several brighter sources show signs of very-low frequency variability with two brightest sources, #31 and #49, being the most variable (Fig. 10).
The Leahy-normalized power density spectra of sources #31 and #49 measured in the Jan. 6, 2002 XMM observation clearly exceed the expected white noise level at frequencies below Hz (Fig 10, middle panels) with source fractional variability amplitudes of and in the Hz frequency band. The PDS of the sources #31 and #50 normalized to the square of fractional r.m.s. variability with expected white noise level subtracted are shown in lower panels of Fig. 10. Both PDS can be adequately approximated by power law models () with exponent (source #31) and (source #49).
The very-low frequency PDS of the M31 X-ray sources #31 and #49 resemble that of the bright Galactic low-mass X-ray binaries (LMXB) Gilfanov & Arefiev (2006). In their recent survey of the very-low frequency X-ray variability of the persistent Galactic LMXB, Gilfanov & Arefiev (2006) show that PDS of the sources can be generally approximated by broken power law which is nearly flat at frequencies below the break and has a slope of at higher frequencies. The break frequency is found to be correlated with binary orbital frequency for a broad range of binary periods. The observed very-low frequency variability of LMXB has been explained as a result of the slow variations in the mass accretion rate being generated in the outer parts of the accretion flow and propagated to the region of the main energy release on a viscous time scale of the accretion flow. The observed slopes of the PDS are in general agreement with the slope predicted from the model involving local fluctuations in the mass accretion rate in the viscous accretion disk (Lyubarskii 1997). The break in the PDS slope is a signature of the finite size of the accretion disk related to the viscous time on the outer boundary of the disk. If sources #31 and #49 are indeed accretion-powered X-ray binaries in M31, as suggested by their overall X-ray properties, they can be seen as further support for Lyubarskii’s model.
9.3. Long-term spectral variability
We searched for long-term spectral variability of M31 X-ray sources combining the data of multiple XMM-Newton observations. Since many of the sources in our sample have not enough counts for establishing spectral variability from model fits, we used their hardness ratios to search for spectral variability. These hardness ratios were calculated using the source counts in three energy bands of MOS and pn detectors: keV (soft band, S), keV (medium band, M) and keV (hard band, H), and defined as: HR1=(M-S)/(M+S) and HR2=(H-M)/(H+M). In order to study long-term spectral variability, we computed a set of two spectral variability parameters for each observation and each of the EPIC detectors following Kong et al. (2002a) :
| (1) |
| (2) |
where , and , are the minimum and maximum values of the source hardness ratios during the 4 years of observations and denote corresponding errors. We define the source to be spectrally variable if or exceeds level of 3 in both EPIC-MOS (combined MOS1 and MOS2) and pn detectors. Applying this criterion, we found that about of sources in our sample with multiple flux measurements available show significant spectral variability (Table 2). This estimate should be considered as a lower limit, since we have not enough sensitivity to detect possible small changes in the spectra of a number of fainter sources and because of the sparseness of XMM-Newton observations. We found the fraction of spectrally variable sources in our sample to be much higher than the 5% previously reported from Chandra survey (Kong et al. 2002a), which demonstrates a significant improvement in the sensitivity and temporal coverage in comparison to previous studies of X-ray sources in the center of M31.
A significant fraction of the sources in our sample provide sufficient number of counts in individual EPIC observations to permit a detailed study of their spectral variability using spectral model fits. In Fig. 11 the long-term evolution of the spectral hardness is shown for 9 brighter X-ray sources, showing the highest levels of spectral variability. In this figure the hardness of the X-ray spectrum, expressed in terms of the best-fit photon index, is shown as a function of the source luminosity. The majority of spectrally variable sources with luminosities above and below ergs s-1 demonstrate a correlation between the level of their X-ray flux and the hardness of their spectrum: as the source flux increases, the spectrum becomes harder (Fig. 11). The brightest sources with luminosities above ergs s-1 (sources #31 and #49 in Fig. 11) show a more complex relation between the spectral slope and flux. The spectral evolution of these brightest sources is generally consistent with that of the Galactic Z sources (Hasinger & van der Klis 1989).
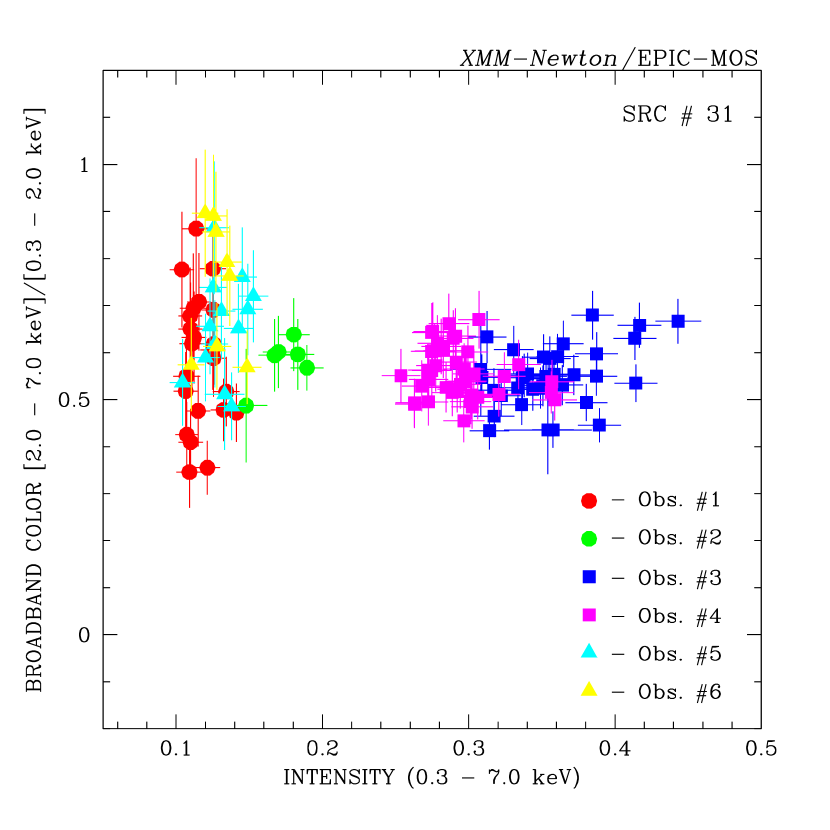
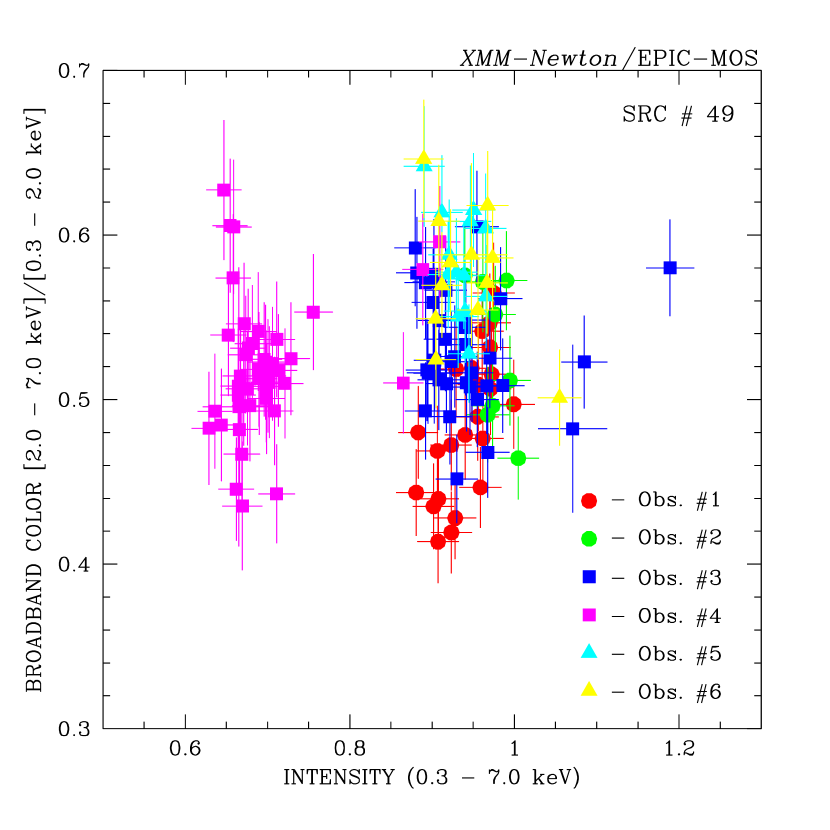
9.4. Short-term spectral variability
The unprecedented sensitivity of XMM-Newton provides a unique opportunity to study spectral evolution of the brightest X-ray sources in M31 on a time scale of hundreds and thousands of seconds. To study short-term spectral variability of the bright sources, we constructed their X-ray hardness-intensity diagrams using the data of XMM-Newton/EPIC observations. The X-ray hardness was defined as the ratio of the source intensities in the keV and keV energy bands with data integration times of s depending on the source intensity. Several sources show a complex patterns of evolution on the hardness-intensity diagram somewhat reminiscent of the Galactic Z and atoll sources (Hasinger & van der Klis 1989; Trudolyubov & Priedhorsky 2004). In Fig. 12 we show the hardness-intensity diagrams of two of these sources (sources #31 and #49) based on the EPIC-MOS data. The hardness-intensity diagrams of both sources clearly demonstrate hysteretic behavior with the same values of the broad-band color corresponding to the different levels of the source luminosity. The X-ray source #49 has been previously classified as a Z source candidate (Barnard et al. 2003b). The results of our analysis are generally consistent with Z source classification of this source. The X-ray source #31 has been previously proposed by Barnard et al. (2003a) as a stellar-mass black hole candidate in M31 mainly on the basis of its short-term aperiodic variability. Recently, it has been shown that the aperiodic variability of the source reported in Barnard et al. (2003a) has artificial origin (Barnard et al. 2006b), making its black hole classification questionable. Moreover, the spectrum, luminosity and the pattern of the short-term spectral variability of the source #31 (Fig. 12, upper panel) clearly resemble those of the high-luminosity neutron star systems rather than stellar-mass black hole candidates.
10. Source classification
10.1. Hardness-Luminosity diagrams
The results of recent XMM-Newton and Chandra observations of individual X-ray sources in M31 suggest close similarity to their Galactic counterparts (Trudolyubov, Borozdin & Priedhorsky 2001; DiStefano et al. 2002; Trudolyubov & Priedhorsky 2004; Williams et al. 2006). Based on their similarity to Galactic sources, the majority of sources in our sample should be accreting X-ray binaries with neutron star and black hole primaries. The problem of distinguishing between these two types of systems among M31 sources is of fundamental importance. It is critical for understanding the processes of binary evolution and star formation history of M31. The study of the short-term X-ray variability can provide a definitive answer on the nature of the source, if Type I X-ray bursts or X-ray pulsations are observed. Unfortunately, the observed source count rates for most M31 sources are too low to allow us to probe their fast ( s) variability and search for typical Type I X-ray bursts. Another attractive possibility is to try to classify M31 sources based on the comparisons of their spectral properties and variability with that of the canonical Galactic neutron star and black hole X-ray binary systems.
X-ray colors can be a sensitive discriminator of the source type, when applied to study of X-ray source populations in nearby galaxies (DiStefano & Kong 2003; Prestwich et al. 2003). Spectral analysis of the high-quality data has proven to be even more effective, because it can account for the low-energy absorption and describe detailed spectral shape (i.e two-component spectra, spectral lines). Nonetheless, this analysis often needs to be combined with information on X-ray variability and counterparts at other wavelengths for secure source classification.
The spectral hardness-luminosity diagrams can be very useful for classification of X-ray sources in nearby galaxies, because of the good source count statistics in XMM and a small relative uncertainty in the source distances. In this work we made use of the hardness (spectral photon index, )-luminosity diagram of M31 sources (Fig. 7) combined with detailed spectral model fits and spectral variability information to identify a number of sources as black-hole and neutron star binary candidates.
As a first step, we tried to define the regions in the hardness-luminosity diagram corresponding to the established spectral states of X-ray binaries, using spectral model fits and an extensive set of published spectral model parameters for a number of selected neutron star and black hole binaries with well established distances. In most cases, we used spectral data of ASCA, BeppoSAX and EXOSAT, because of their common energy range with XMM-Newton. We used standard models to fit the spectra of the established black hole and neutron star X-ray sources in a variety of spectral states (White, Stella & Parmar 1988; McClintock & Remillard 2006 and references therein). The resulting spectral model parameters were then used to simulate XMM-Newton spectra of these objects as if they were observed in M31. When simulating the spectra of Galactic binaries, an absorbing column cm-2, corresponding to the peak of the absorbing column distribution for M31 sources was assumed. The spectral photon indices and source luminosities were derived from fitting of the simulated spectra by the absorbed power law model in the keV energy band.
Typically, the energy spectrum of the stellar-mass black hole candidates in the high/soft state consists of the dominant thermal disk component with keV and a power law tail with a photon index . Some sources also show the very-high state characterized by dominant power law component with and a soft thermal component with temperature of up to keV. The intrinsic energy spectrum of black hole candidates in the hard/low state is usually described as a power law with a photon index and sometimes a low-temperature disk component with keV. The spectrum in the intermediate state corresponding to the transition between low and high/very high states bears resemblance to both low and high states. The estimated keV luminosities of the stellar-mass black hole candidates in the high/very high are usually well above ergs s-1, while in the low/hard state they tend to be below that level. The luminosities in the intermediate state fall in the range ergs s-1 The majority of simulated keV EPIC spectra of the black hole candidates in the high and very-high states, scaled to the M31 distance, can be described by simple power law models with photon index , with the exact value of depending on the parameters of the input spectrum: the temperature of the soft component, slope of the hard tail and relative normalization of the soft and hard components. The characteristic values of the photon index in the simulated low state spectra lie between and , while for the intermediate state they are close to that of the high state.
The energy spectra of the neutron star binaries at high luminosities ergs s-1 are usually well fit with a two-component models consisting of a soft black body-like component with characteristic temperature of keV, together with harder component with keV. The resulting simulated EPIC spectra of high-luminosity neutron star systems can be approximated by power law models with photon index , with gradual hardening and reduced scatter in photon index as luminosities approach and exceed ergs s-1. The simulated spectra of neutron stars at low and intermediate luminosities show wider scatter of the photon indices: .
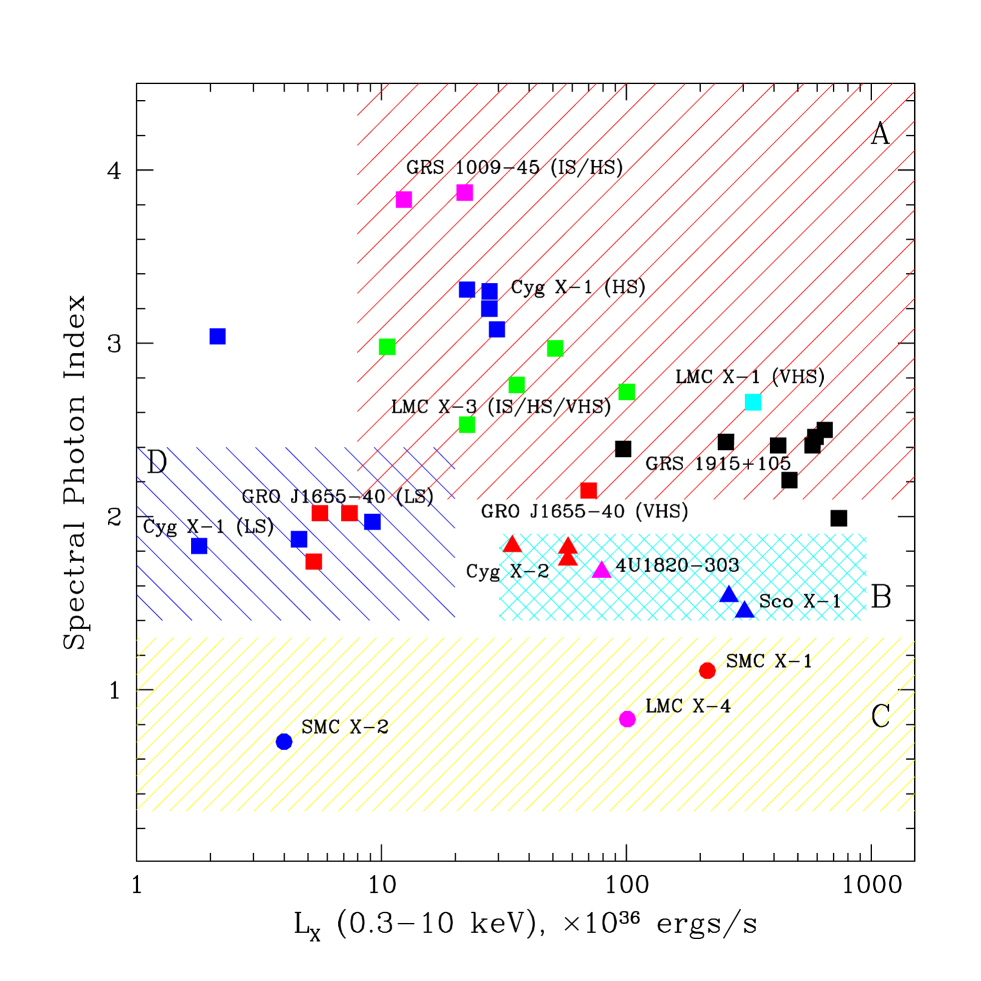
The spectral photon index vs. luminosity diagram of X-ray sources with shaded regions roughly representing the established states of neutron star and black hole binaries is shown in Fig. 13. The simulated data for several black hole candidates (Cyg X-1, GRS1915+105, GRO J1655-40, GRS 1009-45, LMC X-1, LMC X-3), neutron star binaries (Sco X-1, Cyg X-2 and globular cluster source X1820-303) and accretion-powered X-ray pulsars (SMC X-1, SMC X-2 and LMC X-4) are shown for comparison. The first region (A) with source luminosities above ergs s-1 and photon indices higher than 2.1 represents canonical intermediate high/soft (thermal-dominated) and very-high (steep power law) spectral states of stellar-mass black hole candidates. The second region (B) (L ergs s-1 and ) corresponds to high-luminosity states of neutron star systems. The third region (C) in the bottom of the figure () covers typical accretion-powered X-ray pulsars (Nagase 1989; Yokogawa et al. 2003) and some of the obscured X-ray binaries and high-inclination systems (dippers, eclipsing and coronal sources). The fourth region (D) in the diagram is occupied by a mix of black hole and neutron star binaries in low luminosity states.
As is clearly seen from Figure 13, a hardness-luminosity diagram based on the EPIC spectral data can be a very effective tool for distinguishing between luminous neutron star and stellar-mass black hole candidate systems. The spectral photon index vs. luminosity relation can be also used to identify high-inclination systems and accreting pulsar candidates. On the other hand, it is still impossible to make a distinction between neutron star and black hole systems in the low luminosity states based on this diagram alone.
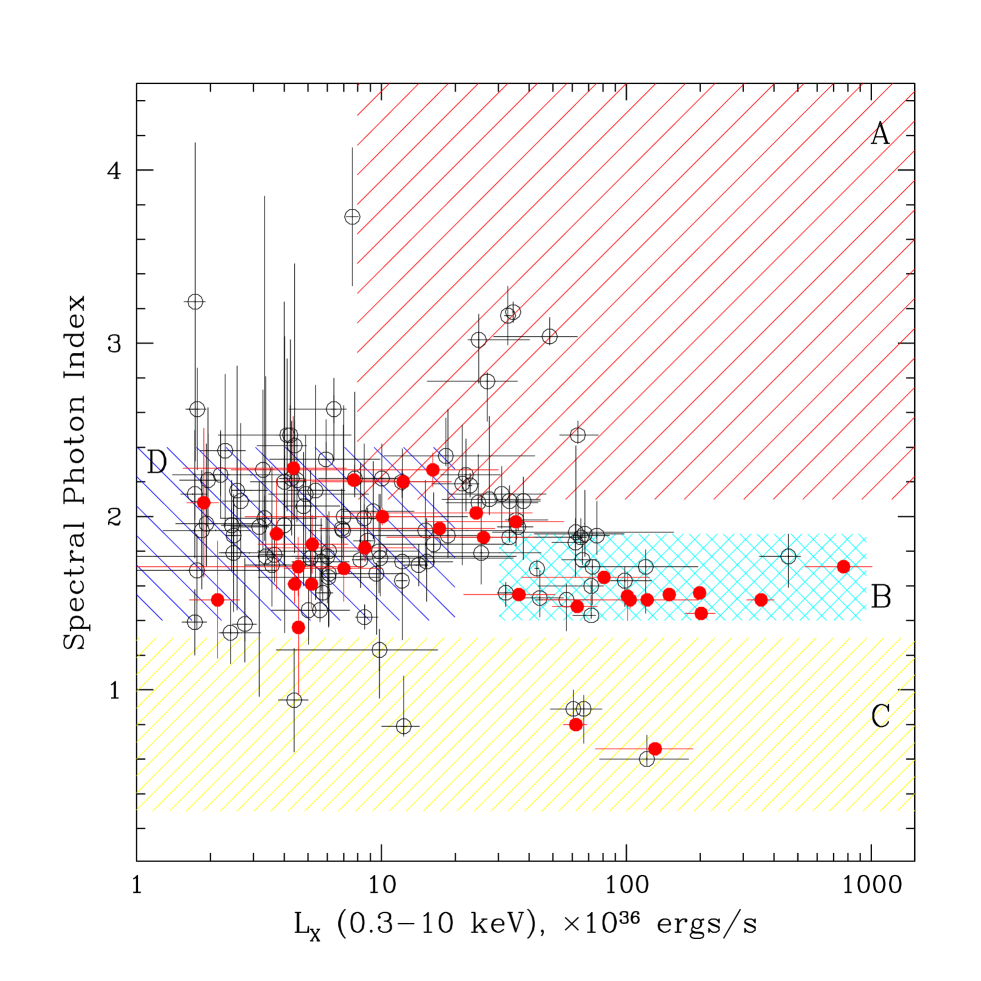
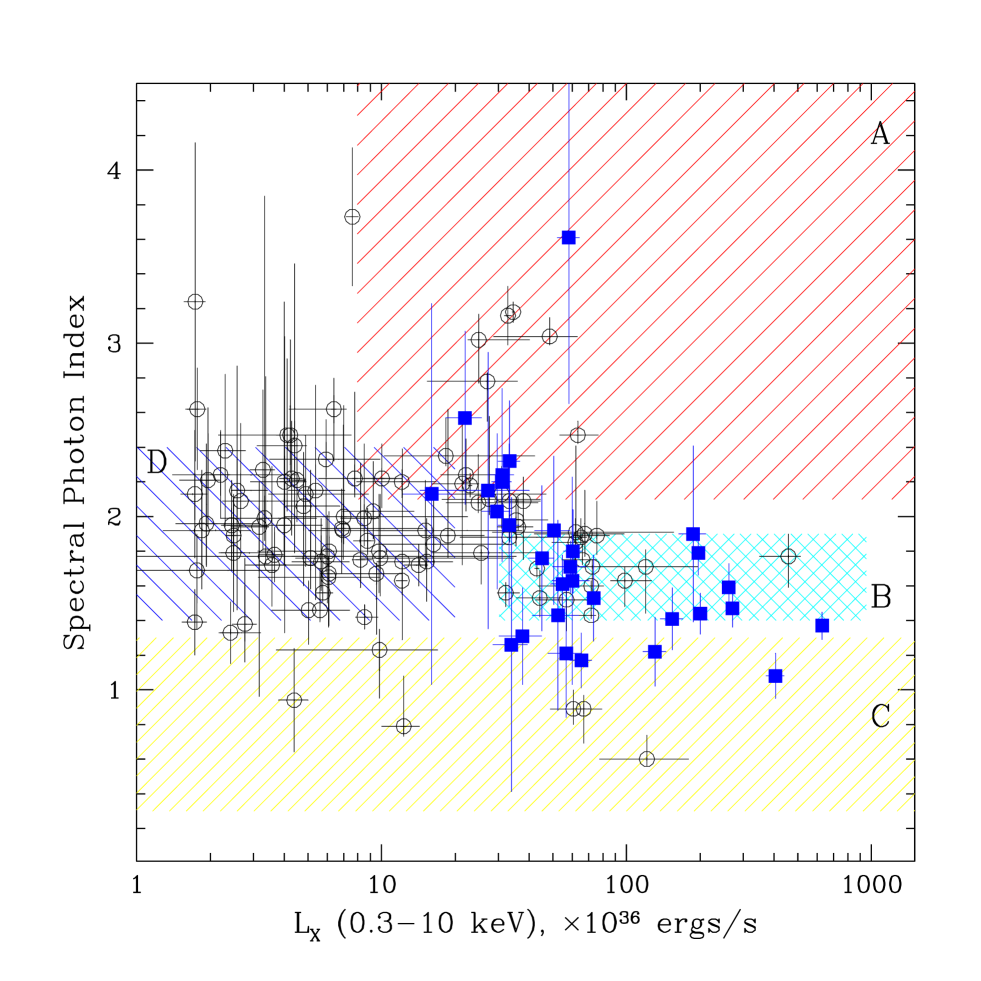
The spectral photon index vs. luminosity plot of M31 X-ray sources in our sample is shown in Figure 14. The XMM sources that are unresolved composites of two or more Chandra sources have been excluded from the plot. The hardness-luminosity distribution of M31 globular cluster sources from Trudolyubov & Priedhorsky (2004) is also shown for comparison. Approximately half of the sources in our sample have spectra and luminosities typical for both neutron star and black hole binaries in the low luminosity states (region D). A number of sources in the intermediate luminosity range ergs s-1 with photon indices between 1.8 and 2.2 can be either neutron stars or black hole systems in the transition between low and high spectral states. All sources with soft spectra and luminosities above ergs s-1 have properties consistent with high/very high states of stellar-mass black hole candidates. Fourteen sources with luminosities above ergs s-1 and photon indices between 1.4 and 1.9 fall into luminous neutron star region (region B). The remaining group of 6 hard sources with have spectra and luminosities characteristic of X-ray pulsars and high-inclination systems (region C) with two sources (#102 and 108) showing regular dips in their lightcurves Trudolyubov et al. 2002b ; Mangano et al. (2004).
It should be noted that energy spectra of the majority of background AGN resemble the spectra of neutron star and black hole systems in both low and high luminosity states. Therefore, some sources in our sample that are background objects can be misidentified as X-ray binary candidates in M31. We expect sources in our sample with apparent luminosities above ergs s-1 to be background objects. The expected number of background objects drops below 1 for source apparent luminosities above ergs s-1. Another type of source that can be mistaken for X-ray binary systems are Crab-like supernova remnants, which have spectral properties similar to that of the neutron star and black hole binaries in the low luminosity states. Since typical Crab-like SNR are often associated with emission line regions and do not show significant variability in X-rays, additional information on the X-ray variability and/or optical counterpart can be used to distinguish between them and X-ray binaries. A hypothetical accreting intermediate-mass black hole with mass above in the hard spectral state could fall into the region in the hardness-luminosity diagram usually occupied by bright neutron star binaries with luminosities above ergs s-1.
We now briefly describe the properties of the X-ray binary candidates in our sample identified using hardness-luminosity diagram and detailed spectral and timing analysis.
10.2. X-ray Binary Candidates
i) Stellar-Mass Black Hole Candidates. Based on the hardness-luminosity diagram, 7 sources in our sample can be classified as stellar-mass black hole candidates in the intermediate/high/very-high spectral state: sources #3, 20, 25, 57, 99, 110, 123. The energy spectra of all these sources are soft with and are best described by multicolor disk model or a two-component models including disk and power law tail (Tables 5,7), typical for canonical black hole systems (McClintock & Remillard 2006 and references therein). Four of these sources are transients and has been previously classified as black hole candidates (Trudolyubov, Borozdin & Priedhorsky 2001; Williams et al. 2006 and references therein; Trudolyubov, Priedhorsky & Cordova 2006), with X-ray source # 99 showing the whole range of spectral evolution of bright black hole X-ray nova. Three black hole candidates (# 20, 25, 123) are persistent sources showing significant variability on a time scales of years. There is a clear correlation between the spectral temperature derived in the DISKBB spectral fits to the spectra of these sources and their X-ray flux with temperature increasing with increase of the flux (Table 5). At the same time, the characteristic emitting radius, remains essentially constant, despite a significant change in the X-ray flux, which is the effect also observed in the Galactic black hole candidates in the high spectral state Tanaka Lewin (1995). The X-ray source #46 can be also tentatively classified as a black hole candidate, based on its transient behavior, two-component spectrum and luminosity (Trudolyubov, Borozdin & Priedhorsky 2001). That brings the total number of the proposed black hole candidates to 8, or 7% of the total number of sources in our sample. By analogy with Galactic X-ray binaries, we expect most of M31 black hole candidates to be transient systems. Therefore, the fraction of these objects is likely to become higher with more new transients detected in the future monitoring observations of the central part of M31.
ii) Neutron Star Candidates. 14 sources in our sample (sources #26, 31, 37, 38, 40, 49, 58, 77, 80, 84, 86, 92, 105, 121)(Fig. 14) have spectra, luminosities and variability similar to that of the bright (L ergs s-1) Galactic neutron star binaries. Seven of them coincide with M31 globular clusters (Trudolyubov & Priedhorsky 2004) and one source, #49 shows spectral variability characteristic of Galactic Z-sources (Barnard et al. 2003b). The remaining 13 sources associated with globular clusters can be also added to the neutron star candidates list, based on the similarities with their Galactic counterparts. The X-ray source # 29 has been previously classified as a neutron star candidate, based on a short burst detected in one of XMM-Newton observations, interpreted as radius-expansion Type I X-ray burst (Pietsch & Haberl 2005). Another X-ray source #102 (Mangano et al. 2004), which shows regular dipping with a period of 1.78 hours, has overall properties similar to the Galactic dipping sources with neutron star primaries. Therefore, 29 sources or of the total number of sources in our sample can be identified as probable neutron star X-ray binary candidates.
iii) White Dwarf Candidates. Four sources in our sample, # 7, 83, 113, 114 have supersoft spectra (not shown in hardness-luminosity diagram). Two sources are transients, and one source (# 113) shows recurrent outbursts. The properties of all four sources are similar to the Galactic supersoft sources, identified with white dwarfs, sustaining a thermonuclear burning of the accreted matter on their surface (Kahabka & van den Heuvel 2006). We can therefore propose these four sources as probable accreting white dwarf candidates.
The remaining 2 transient sources (#100 and 104) have observed properties consistent with both black hole or neutron star X-ray binary interpretation. Finally, adding these two objects to the X-ray binary candidates identified above, brings the total number of high-confidence X-ray binary candidates with black hole, neutron star and white dwarf primaries to 44 or of sources in our sample.
11. Comparison with X-ray Binary Source Populations in Globular Clusters and Normal Galaxies
The similarities between M31 and Milky Way GC X-ray sources suggest that M31 GC source population is likely to be dominated by LMXB with neutron star primaries, and in some sense can be regarded as a prototype LMXB population. Therefore, the results from the study of M31 GC sources provide an important benchmark for comparison with the results from study of galactic X-ray source populations of mixed nature, helping to constrain the neutron star X-ray binary contribution. Similarities between our XMM-Newton survey of the central region of M31 and a previous XMM-Newton/Chandra survey of its GC system Trudolyubov & Priedhorsky (2004)(overlapping observations with identical observational setup and data analysis techniques etc.) make comparison of their results straightforward.
The power law spectral index distributions and their dependence on the source luminosity in our source sample and in the M31 GC source sample are shown in Fig. 15. Although the total distributions (upper panels in Fig 15) appear to be qualitatively similar (both distributions have well-defined maxima corresponding to harder spectra and a shoulder in the softer spectral region), there are significant quantitative differences between them: the maximum of the GC distribution corresponds to harder spectra than that of the central region of M31, and it lacks soft sources with , while central region of M31 contains a significant number (17) of such sources. According to the results of K-S test, the hypothesis that these two distributions are drawn from the same parent distribution can be rejected at 99.6% confidence level. The hardness distributions of the sources in the central region of M31 and M31 GC sources differ at both high and low source luminosities. The main peak of the spectral distribution of the brightest GC sources with L ergs s-1 (middle panels in Fig. 15) appears to be narrower and shifted towards harder spectra than that of the central region of M31. For lower luminosities (lower panels in Fig. 15), the hardness distribution of sources in our sample tends to be more peaked in the hard spectral region and extends further into soft spectral region, when compared to the GC source distribution.
The spectral photon index-luminosity diagram (Fig. 14) is another useful tool for an effective comparison between the sources in the central part of M31 and M31 GC sources. The hardness-intensity data for M31 GC sources fits into the regions of the diagram, covering spectral states of neutron star X-ray binaries. This is consistent with similarities between M31 GC sources and their Galactic counterparts, all of which are confirmed neutron star systems. The X-ray sources in the central region of M31 follow essentially the same pattern in the hardness-luminosity diagram, except for the prominent group of spectrally soft sources with luminosities above ergs s-1, most of them classified as black hole candidates. Therefore, it is natural to assume that majority of bright X-ray sources in the bulge and inner disk of M31 represents a mix of X-ray binaries with neutron star and black hole primaries, dominated by neutron star LMXBs, similar to our Milky Way galaxy Liu et al. (2001). The luminosity dependence of the spectral distribution of M31 sources (Fig. 6,15) can be generally understood as a result of mixing a neutron star and black hole LMXB populations. For high luminosities (L ergs s-1), the spectra of neutron star systems in the keV energy band tend to be hard with typical photon indices of , while most of the stellar-mass black hole systems are found in the high/very-high state with softer spectra (). The resulting hardness distribution with the majority of sources being neutron star systems should have the main peak in the hard spectral region () and a shoulder extending to the soft spectral region (). The relative normalization of the main peak and the shoulder depends on the ratio of the number of neutron star and black hole systems. The overall form and centroid position of the main peak will be determined mainly by luminosity distribution of the neutron star systems in that source sample. For luminosities between and ergs s-1, the spectra of neutron star systems have wider range of photon index (), and most of the stellar-mass black hole systems are still in the intermediate/high/very-high state. The luminosities below ergs s-1 correspond to the low states of both neutron star and black hole candidates with typical range of spectral photon indices . The resulting spectral hardness distributions at intermediate and low luminosities should be broader and softer than that of the high luminosity group. As seen from Fig. 6, 14, 15, the hardness-luminosity data for both M31 core and GC sources seem to support this picture.
More than 80% of the sources in our sample show significant variability on the time scales of months to years, which is very close to the fraction of variable objects among the M31 GC X-ray sources found in the XMM-Newton/Chandra survey of comparable sensitivity Trudolyubov & Priedhorsky (2004). The similarity of the fraction of variable sources may suggest that in general, there is no significant difference between the long-term variability of the field LMXB and their counterparts in globular clusters.
The luminosity distribution of the bright X-ray sources in the central region of M31 deviates from that of the M31 GC sources Trudolyubov & Priedhorsky (2004). The fraction of the bright sources with luminosities above ergs s-1 is much higher for the GC population (30%) than for the bulge (, depending on the background source contribution). Moreover, the difference in the fraction of the sources with luminosities above ergs s-1 is even higher, with 6 out of 43 GC sources steadily exceeding and 3 three more sources occasionally exceeding this limit ( of the total number) and only 3 sources in the bulge and inner disk of M31 being persistently and 2 sources occasionally brighter than ergs s-1 ( of the total number). A total of 20 sources in our sample are associated with globular clusters (Table 2). GC sources make a significant contribution to the bright source counts in the central region of M31: on average, of the sources with apparent luminosities above ergs s-1 reside in the globular clusters, with GC source contribution rising to at luminosities above ergs s-1. The fraction of bright GC sources in the central region of M31 appears to be much higher than observed in our own Galaxy, and stands closer to the fraction of GC sources found in early-type galaxies (Angelini, Lowenstein & Mushotzky 2001; Kundu, Maccarone & Zepf 2002; Fabbiano 2006 and references therein).
The central region of M31 covers most of the bulge and inner disk, containing a significant fraction of X-ray sources detected in M31, and is suitable for direct comparison with LMXB populations in other galaxies. In the recent study of a large sample of nearby early-type galaxies Irwin, Athey & Bregman (2003) performed a spectroscopic survey of their X-ray binary populations. They found that the spectrum of the sum of the sources with luminosities below ergs s-1 in a given galaxy is similar from galaxy to galaxy, and can be approximated with simple power law models with photon index . The combined spectrum of LMXB in the sample of Irwin et al. (2003) can be fit with a simple power law model with photon index of . Since the low luminosity limit of their sample for most galaxies is well above ergs s-1 and sometimes exceeds ergs s-1, it is suitable for the comparison with high-luminosity subsample of M31 sources. The formal weighted average photon index for the high-luminosity M31 sources is consistent with photon index derived for the combined bright X-ray sources in early-type galaxies. The similarity between these two is not surprising since both populations are probably dominated by bright persistent LMXB with neutron star primaries. The weighted average spectral photon index of 115 sources in our sample also appears to be in good agreement with the photon index () of the composite spectrum of M31 bulge sources measured with Chandra (Irwin, Athey & Bregman 2003).
The study of detailed spectral properties and variability of individual sources in most large nearby galaxies is usually confined to a few brightest objects. However, recent deep Chandra and XMM-Newton observations of some of them allow us to obtain spectra of larger number of sources with apparent luminosities above ergs s-1. The observations of the spiral galaxy M81 with Chandra allowed for a study of the spectra of 30 X-ray sources with estimated unabsorbed luminosities above ergs s-1 (Swartz et al. 2003). In order to make a direct comparison of the spectral distributions of sources in M81 and M31, we used spectral fit parameters of bright M81 sources from Table 3 of Swartz et al. (2003) (spectral indices and unabsorbed luminosities in the 0.3–8 keV energy range) to calculate their absorbed luminosities in the 0.3–10 keV energy band, assuming an absorbing column of cm-2, typical for M31 sources. The resulting hardness-luminosity distribution (spectral photon index vs. luminosity diagram) of bright M81 X-ray sources (Fig. 16) is similar to the distribution of the brighter sources in the center of M31 galaxy. The spectra and luminosities of the majority of M81 sources are close to those of the neutron star systems in the high luminosity states and during transitions between high and low luminosities. In addition, the properties of two M81 sources with steeper spectra () can be consistent with black hole candidate interpretation. The similarity between spectral properties and luminosities of M31 and M81 X-ray sources provides another evidence for common spectral formation mechanism in X-ray binaries. It also demonstrates that hardness-luminosity diagrams can be an effective tool for characterising X-ray binary populations and classification of individual sources in external galaxies.
12. Summary and Conclusions
We performed a detailed survey of spectral properties and variability of 123 bright X-ray sources detected in the central part of M31 (within radius from the galactic nucleus) using the data of four years of observations with XMM-Newton. The observed luminosities of the sources, scaled to the M31 distance of 760 kpc, range from to ergs s-1 with luminosity of ergs s-1 corresponding to a completeness limit of our sample. Based on the background source statistics, we expect a relatively small fraction () of sources with luminosities above the completeness limit to be background objects. 20 sources in our sample are associated with optically-identified globular clusters, and 4 sources coincide with supernova remnant candidates in M31. The X-ray properties and radio/optical counterparts of 6 sources have been found to be consistent with that of the background AGN.
A large number of sources with a wide range of apparent luminosities allowed us to study a rich spectrum of states of different classes of X-ray emitting objects. The majority of sources in our sample have X-ray properties reminiscent of Galactic low-mass X-ray binaries, consistent with the older stellar population of the bulge. We fitted the energy spectra of individual sources with a variety of spectral models ranging from simple power law and blackbody radiation models to two-component models including soft and hard spectral components. In most cases, we obtained acceptable fits using an absorbed power law spectral model, but for many brighter sources a more complex spectral model is required. For these sources, a models with quasi-exponential cut-off at keV or two-component models describe the energy spectra significantly better than simple power law. Four sources have supersoft spectra that can be approximated with blackbody radiation models with temperatures of eV. Another four sources in our sample are SNR candidates with soft thermal spectra showing presence of spectral lines, that can be approximated by thermal plasma models with characteristic temperatures of keV.
Using the results of spectral analysis, we studied a distribution of X-ray absorption towards M31 sources. The distribution of absorbing columns peaks at N cm-2, and extends up to cm-2. The average value of the absorbing column derived from our sample is cm-2, or nearly twice the Galactic foreground value.
The spectral photon index distribution of the sources in the central part of M31 has a main peak at and a broad shoulder at extending to the softer spectral region. The main part of the photon index distribution can be adequately described by sum of two Gaussian functions with centroids at and , accounting for and of the total number of sources. The spectral distribution shows clear evolution with source luminosity, characterized by narrowing and shift of its main peak to the harder spectral region for luminosities above ergs s-1. The spectral properties of the brighter sources in our sample clearly resemble those of the bright LMXB observed in other nearby normal galaxies of different morphological type. The spectral distribution of the sources in the central region of M31 shows an apparent excess of soft sources when compared to the distribution of M31 globular cluster sources. This fact can be probably explained by the presence of black hole binaries in the intermediate/high/very-high state among the field sources in the central region of M31, and their absence among the globular cluster sources.
We found that more than 80% of sources in our sample with two or more flux measurements available show significant variability on a time scales of days to years. Ten sources are transients with outburst-to-quiescent flux ratios of , and three other sources show recurrent outbursts on a time scale of years. The fraction of variable sources in our survey is much higher than previously reported from Chandra surveys of the central region of M31. At the same time, it is very close to the fraction of variable sources among GC sources in M31.
Timing analysis of XMM-Newton/EPIC data allowed us to study short-term aperiodic variability of M31 sources in the Hz frequency range. Because of the lack of statistics, for most sources in our sample it was not possible to detect any significant aperiodic variability. However, several of the brightest sources showed characteristic very-low frequency variability at frequencies below 0.01 Hz, resembling the noise variability seen in the bright Galactic LMXB.
About 50% of the sources in our sample show spectral variability between individual XMM-Newton observations. The spectral evolution of a number of sources is correlated with level of X-ray flux: the spectrum becomes harder as the flux increases. Several bright sources demonstrate complex patterns of evolution on the hardness-intensity diagram, somewhat reminiscent of the Galactic Z and atoll sources.
The main features of the hardness-luminosity diagram of M31 sources can be interpreted as resulting from a mixed population dominated by neutron star and black hole X-ray binaries. Based on observational data, one can identify four main regions in the hardness-luminosity diagram of M31 sources, with properties corresponding to distinct spectral states of X-ray binaries. Combining the position in the hardness-luminosity diagram with detailed spectral and variability information, we classify of sources in our sample as probable black hole candidates in the intermediate/high/very-high spectral state and sources as neutron star binary systems. The properties of four sources with very soft thermal spectra are close to that of the Galactic supersoft sources, and can be classified as probable white dwarf candidates. In summary, a total of 44 X-ray sources in our sample can be identified as probable X-ray binary candidates, based on their spectral properties and variability.
The central region of M31 is one of the best places to study X-ray binary populations, and provides an important benchmark for comparison with our own Galaxy and other external galaxies. The observed similarities between the properties of bright X-ray sources in the central region of M31, its GC component, and other normal galaxies of different morphological type, help to identify universal properties of extragalactic LMXB populations. A complete X-ray survey of M31 and new high-sensitivity observations of nearby galaxies should allow a more detailed comparison of their X-ray emitting populations, putting better constraints on the fraction of black hole and neutron star binaries and ultimately help to improve our understanding of fundamental processes of binary evolution and star formation history.
13. Acknowledgments
Support for this work was provided through NASA Grant NAG5-12390. Part of this work was initiated during a 2005 summer workshop “Revealing Black Holes” at the Aspen Center for Physics, S. T. is grateful to the Center for their hospitality. XMM-Newton is an ESA Science Mission with instruments and contributions directly funded by ESA Member states and the USA (NASA). This research has made use of data obtained through the High Energy Astrophysics Science Archive Research Center Online Service, provided by the NASA/Goddard Space Flight Center.
References
- Anders & Grevesse (1989) Anders, E., & Grevesse, N. 1989, Geochim. Cosmochim. Acta, 53, 197
- Angelini, Lowenstein & Mushotzky (2001) Angelini, L., Lowenstein, M., & Mushotzky, R. 2001, ApJ, 557, L35
- Arnaud (1996) Arnaud, K. 1996, in Astronomical Data Analysis Software and Systems V, ASP Conference Series 101, ed. G. Jacoby & J. Barnes (San Francisco: ASP) 17
- Baade & Arp (1964) Baade, W., & Arp, H. 1964, ApJ, 139, 1027
- Barmby & Huchra (2001) Barmby, P., & Huchra, J.P. 2001, ApJ, 122, 2458
- (6) Barnard, R., Osborne, J. P., Kolb, U., & Borozdin. K. N. 2003a, A&A, 405, 505
- (7) Barnard, R., Kolb, U., & Osborne, J. P. 2003b, A&A, 411, 553
- Barnard et al. (2004) —, 2004, A&A, 423, 147
- (9) —, 2006a, A&A, withdrawn from publication (astro-ph/0508284)
- (10) Barnard, R., Trudolyubov, S., Kolb, U. C., Haswell, C. A., Osborne, J. P., & Priedhorsky, W. C. 2006b, A&A, submitted
- Battistini et al. (1987) Battistini, P., et al., 1987, A&AS, 67, 447
- Blair et al. (1982) Blair, W. P., Kirshner, R. P., & Chevalier, R. A. 1982, ApJ, 254, 50
- Braun (1990) Braun, R. 1990, A&AS, 72, 761
- Braun & Walterbos (1993) Braun, R., & Walterbos, R. A. M. 1993, A&AS, 98, 327
- Christian & Swank (1997) Christian, D. J., & Swank, J. H. 1997, ApJS, 109, 177
- Condon et al. (1998) Condon, J.J., Cotton, W.D., Greisen, E.W., Yin, Q.F., Perley, R.A., Taylor, G.B., & Broderick J.J. 1998, AJ, 115, 1693
- Cutri et al. (2003) Cutri R.M., et al. 2003, in University of Massachusetts and Infrared Processing and Analysis Center (IPAC/California Institute of Technology)
- Dickey & Lockman (1990) Dickey, J. M., & Lockman F. J. 1990, ARA&A, 28, 215
- Di Stefano et al. (2002) Di Stefano, R., Kong, A. K. H., Garcia, M. R., Barmby, P., Greiner, J., Murray, S. S., & Primini, F. A. 2002, ApJ, 570, 618
- Di Stefano & Kong (2003) Di Stefano, R., Kong, A. K. H. 2003, ApJ, 592, 884
- Di Stefano et al. (2004) Di Stefano, R., Kong, A. K. H., Greiner, J., Primini, F. A., Garcia, M. R., Barmby, P., Massey, P., Hodge, P. W., Williams, B. F., Murray, S. S., Curry, S., & Russo, T. A. 2004, ApJ, 610, 247
- Fabbiano & White (2006) Fabbiano, G., & White, N. E. 2006, in Compact Stellar X-ray Sources, ed. W. H. G. Lewin & M. van der Klis (Cambridge: Cambridge Univ. Press)
- Fabbiano (2006) Fabbiano, G. 2006, ARA&A, 44, 323
- Ford & Jacoby (1978) Ford, H. C., & Jacoby, G. 1978, ApJ, 219, 437
- Galleti et al. (2004) Galleti, S., Federici, L., Bellazzini, M., Fusi Pecci, F., Macrina, S. 2004, A&A, 416, 917
- Garcia et al. (2000) Garcia, M. R., Murray, S. S., Primini, F. A., Forman, W., McClintock, J., & Jones, C., 2000, ApJ, 537, L23
- Gilfanov & Arefiev (2006) Gilfanov, M., & Arefiev, V. 2006, MNRAS, submitted (astro-ph/0501215)
- Haiman et al. (1994) Haiman, Z., Magnier, E. A., Lester, R. R., Lewin, W. H. G., van Paradijs, J., Hasinger, G., Pietsch, W., & Truemper, J. 1994, A&A, 286, 725
- Hasinger & van der Klis (1989) Hasinger, G., & van der Klis, M. 1989, A&A, 225, 79
- Irwin, Athey & Bregman (2003) Irwin, J. A., Athey, A. E., & Bregman, J. N. 2003, ApJ, 587, 356
- Kaaret (2002) Kaaret, P. 2002, ApJ, 578, 114
- Kahabka & van den Heuvel (2006) Kahabka, P., & van den Heuvel, E. P. J. 2006, in Compact Stellar X-ray Sources, ed. W. H. G. Lewin & M. van der Klis (Cambridge: Cambridge Univ. Press)
- (33) Kong, A. K. H., Garcia, M. R., Primini, F. A., Murray, S. S., Di Stefano, R., & McClintock, J. E. 2002, ApJ, 577, 738
- (34) Kong, A. K. H., Garcia, M. R., Primini, F. A., Murray, S. S. 2002, ApJ, 580, L125
- Kundu, Maccarone & Zepf (2002) Kundu, A., Maccarone, T. J., & Zepf, S. E. 2002, ApJ, 574, L5
- Leahy et al. (1983) Leahy, D. A., Darbro, W., Elsner, R. F., Weisskopf, M. C., Kahn, S., Sutherland, P. G., & Grindlay, J. E. 1983, ApJ, 266, 160
- Lewin et al. (1995) Lewin, W. H. G., van Paradijs, J., & Taam, R. E. 1995, in X-ray Binaries, ed. W. H. G. Lewin, J. Van Paradijs, & E. P. J. van den Heuvel (Cambridge: Cambridge Univ. Press), 126
- Liedahl, Osterheld, & Goldstein (1995) Liedahl, D. A., Osterheld, A. L., & Goldstein, W. H. 1995, ApJ, 438, L115
- Liu et al. (2001) Liu, Q. Z., van Paradijs, J., van den Heuvel, E. P. J. 2001, A&A, 368, 1021
- Lyubarskii (1997) Lyubarskii, Y. E. 1997, MNRAS, 292, 679
- Magnier et al. (1992) Magnier, E. A., Lewin, W. H. G., van Paradijs, J., Hasinger, G., Jain, A., Pietsch, W., & Truemper, J. 1992, A&AS, 96, 379
- Magnier (1993) Magnier, E. A. 1993, Ph.D. thesis, MIT
- Magnier et al. (1995) Magnier, E. A., Prins, S., van Paradijs, J., Lewin, W. H. G., Supper, R., Hasinger, G., Pietsch, W., Truemper, J. 1995, A&AS, 114, 215
- Mangano et al. (2004) Mangano, V., Israel, G. L., & Stella, L. 2004, A&A, 419, 1045
- Massey et al. (2001) Massey, P., Hodge, P. W., Holmes, S., Jacoby, G., King, N. L., Olsen, K., Saha, A., & Smith, C. 2001, in American Astronomical Society Meeting, 199, 1305
- McClintock & Remillard (2006) McClintock, J. E., & Remillard, R. A. 2006, in Compact Stellar X-ray Sources, ed. W. H. G. Lewin & M. van der Klis (Cambridge: Cambridge Univ. Press), 157 (astro-ph/0306213)
- Mewe, Gronenschild, & van den Oord (1985) Mewe, R., Gronenschild, E., & van den Oord, G. H. J. 1985, A&AS, 62, 197
- Mitsuda et al. (1984) Mitsuda, K. et al. 1984, PASJ, 36, 741
- Monet et al. (2003) Monet, D.G., et al. 2003, AJ, 125, 984
- Moretti et al. (2003) Moretti, A., Campana, S., Lazzati, D., & Tagliaferri, G. 2003, ApJ, 588, 696
- Nagase (1989) Nagase, F. 1989, PASJ, 41, 1
- Osborne et al. (2001) Osborne, J. P., et al. 2001, A&A, 378, 800
- Pietsch et al. (2005) Pietsch, W., Freyberg, M., & Haberl, F. 2005, A&A, 434, 483
- Pietsch & Haberl (2005) Pietsch, W., & Haberl, F. 2005, A&A, 430, L45
- Prestwich et al. (2003) Prestwich, A. H., Irwin, J. A., Kilgard, R. E., Krauss, M. I., Zezas, A., Primini, F., Kaaret, P., & Boroson, B. 2003, ApJ, 595, 719
- Primini, Forman & Jones (1993) Primini, F. A., Forman, W., & Jones, C., 1993, ApJ, 410, 615
- Shirey et al. (2001) Shirey, R., et al. 2001, A&A, 365, L195
- Strohmayer & Bildsten (2005) Strohmayer, T., & Bildsten, L. 2005, in Compact Stellar X-ray Sources, ed. W. H. G. Lewin & M. van der Klis (Cambridge: Cambridge Univ. Press), (astro-ph/0301544)
- Strueder et al. (2001) Strueder, L. et al., 2001, A&A, L18
- Sunyaev & Titarchuk (1980) Sunyaev, R. A., & Titarchuk, L. G. 1980, A&A, 86, 121
- Supper et al. (2001) Supper, R., Hasinger, G., Lewin, W. H. G., Magnier, E. A., van Paradijs, J., Pietsch, W., Read, A. M., & Truemper, J. 2001, A&A, 373, 63
- Swartz et al. (2003) Swartz, D. A., Ghosh, K. K., McCollough, M. L., Pannuti, T. G., Tennant, A. F., & Wu, K. 2003, ApJSS, 144, 213
- Tanaka Lewin (1995) Tanaka, Y., & Lewin, W. H. G. 1995, in X-ray Binaries, ed. W. H. G. Lewin, J. Van Paradijs, & E. P. J. van den Heuvel (Cambridge: Cambridge Univ. Press), 126
- Titarchuk (1994) Titarchuk, L. 1994, ApJ, 434, 570
- Tomsick & Kaaret (2000) Tomsick, J. A., & Kaaret, P. 2000, ApJ, 537, 448
- Trinchieri & Fabbiano (1991) Trinchieri, G., & Fabbiano, G., 1991, ApJ, 382, 82
- Trudolyubov, Borozdin & Priedhorsky (2001) Trudolyubov, S. P., Borozdin, K. N., & Priedhorsky, W. C. 2001, ApJ, 563, L119
- (68) Trudolyubov, S., Borozdin, K., Priedhorsky, W., Mason, K., & Cordova, F. 2002a, ApJ, 571, L17
- (69) Trudolyubov, S., Borozdin, K., Priedhorsky, W., Osborne, J., Watson, M., Mason, K., & Cordova, F. 2002b, ApJ, 581, L27
- Trudolyubov & Priedhorsky (2004) Trudolyubov, S., & Priedhorsky, W. 2004, ApJ, 616, 821
- (71) Trudolyubov, S., & Priedhorsky, W. 2005a, in X-ray and Radio Connections, eds. Sjouwerman, L. O., & Dyer, K. K., published electronically at http://www.aoc.nrao.edu/events/xraydio (astro-ph/0404586)
- (72) Trudolyubov, S., Kotov, O., Priedhorsky, W., Cordova, F., & Mason, K. 2005b, ApJ, 634, 314
- Trudolyubov, Priedhorsky & Cordova (2006) Trudolyubov, S., Priedhorsky, W., & Cordova, F. 2006, ApJ, 645, 277
- Turner et al. (2001) Turner, M. et al., 2001, A&A, 365, L27
- van den Bergh (2000) van den Bergh, S. 2000, The Galaxies of the Local Group, (Cambridge: Cambrdge Univ. Press)
- Walterbos, Brinks, & Shane (1985) Walterbos, R. A. M., Brinks, E., & Shane, W. W. 1985, A&AS, 61, 451
- White, Stella & Parmar (1988) White, N. E., Stella, L., & Parmar, A. N. 1988, ApJ, 324, 363
- (78) Williams, B. F., Garcia, M. R., Kong, A. K. H., Primini, F. A., King, A. R., & Murray, S. S. 2004a, ApJ, 609, 735
- (79) Williams, B. F., Sjouwerman, L. O., Kong, A. K. H., Gelfand, J., Garcia, M. R., & Murray, S. S. 2004b, ApJ, 615, 720
- (80) Williams, B. F., Barnard, R., Garcia, M. R., Kolb, U., Osborne, J. P., & Kong, A. K. H. 2005a, ApJ, 634, 365
- (81) Williams, B. F., Garcia, M. R., McClintock, J. E., Primini, F. A., & Murray, S. S. 2005b, ApJ, 637, 479
- Williams et al. (2006) Williams, B. F., Naik, S., Garcia, M. R., & Callanan, P. 2006, ApJ, 643, 356
- Yokogawa et al. (2003) Yokogawa, J., Imanishi, K., Tsujimoto, M., Koyama, K., & Nishiuchi, M. 2003, PASJ, 55, 161
| Obs. | Date, UT | Obs. ID | RA (J2000)a | Dec (J2000)a | Exp.(mos)b | Exp.(pn)b |
|---|---|---|---|---|---|---|
| (h:m:s) | (d:m:s) | (ks) | (ks) | |||
| 2000 Jun 25 | 0112570401 | 00:42:43.00 | 41:15:46.1 | 28.9 | 24.9 | |
| 2000 Dec 28 | 0112570601 | 00:42:43.00 | 41:15:46.1 | 12.1 | 9.4 | |
| 2001 Jun 29 | 0109270101 | 00:42:43.00 | 41:15:46.1 | 29.0 | 24.9 | |
| 2002 Jan 06 | 0112570101 | 00:42:43.00 | 41:15:46.1 | 63.0 | 49.9 | |
| 2004 Jul 16 | 0202230201 | 00:42:42.12 | 41:16:57.1 | 19.6 | 16.4 | |
| 2004 Jul 18 | 0202230401 | 00:42:42.26 | 41:16:58.2 | 17.6 | 13.1 | |
| 2004 Jul 19 | 0202230501 | 00:42:42.23 | 41:16:57.6 | 9.6 | 6.5 |
-
a
– coordinates of the center of the field of view
-
b
– instrument exposure used in the analysis
| Source | R.A. | Decl. | Photon | Fluxb | Classd | Optical/Radio/X-ray | |
|---|---|---|---|---|---|---|---|
| ID | Indexa | IDe,f | |||||
| 1 | 00 41 41.32 | 41 19 17.7 | (1.52-2.76) | SV | P165 | ||
| 2 | 00 41 43.48 | 41 21 20.9 | (0.95-1.28) | P169 | |||
| 3 | 00 41 44.70 | 41 11 10.0 | (2.74-3.36) | TR,BHC,SV | |||
| 4 | 00 41 50.27 | 41 13 36.8 | (1.71-2.04) | R,BKG | B90 34,r3-110,P176 | ||
| 5 | 00 41 50.51 | 41 21 15.5 | (0.96-2.06) | r3-109,P178 | |||
| 6 | 00 41 51.59 | 41 14 39.0 | (1.50-2.01) | R,BKG | B90 35,5C3.099,r3-81,P181 | ||
| 7 | 00 41 54.12 | 41 07 23.9 | TR,SSS | P191 | |||
| 8 | 00 42 03.84 | 41 09 27.6 | P200 | ||||
| 9 | 00 42 05.72 | 41 13 30.3 | (1.70-1.79) | REC | PFJ3,P202 | ||
| 10 | 00 42 07.52 | 41 10 28.0 | (1.75-2.04) | r3-94,P211 | |||
| 11 | 00 42 07.73 | 41 18 15.2 | (1.75-2.23) | TF12,PFJ4,r3-61,P212 | |||
| 12 | 00 42 07.77 | 41 04 37.8 | (1.75-2.53) | P213 | |||
| 13 | 00 42 09.08 | 41 20 48.6 | (1.56-2.13) | SV | r3-60,P218 | ||
| 14 | 00 42 09.48 | 41 17 45.4 | (2.11-2.72) | GCS,SV | MIT140,PFJ5,r3-59,TP8,P221 | ||
| 15 | 00 42 10.28 | 41 15 10.0 | (1.33-3.04) | PFJ6,r3-58,P223 | |||
| 16 | 00 42 10.98 | 41 12 48.3 | (2.27-2.63) | SV | r3-57,P226 | ||
| 17 | 00 42 11.66 | 41 10 49.3 | (1.59-2.31) | R,BKG | B90 56,PFJ7,r3-56,P227 | ||
| 18 | 00 42 11.93 | 41 16 49.5 | (1.72-3.24) | r3-55,P228 | |||
| 19 | 00 42 12.16 | 41 17 58.7 | (1.84-2.64) | GCS,SV | Bo78,PFJ8,r3-54,TP9,P230 | ||
| 20 | 00 42 13.12 | 41 18 36.8 | (2.99-3.15) | BHC,SV | TF14,PFJ9,r3-52,P233 | ||
| 21 | 00 42 15.11 | 41 12 34.8 | (2.01-2.58) | SV | PFJ10,r3-50,P235 | ||
| 22 | 00 42 15.26 | 41 18 01.3 | (2.12-2.50) | SV | r3-49,P236 | ||
| 23 | 00 42 15.45 | 41 20 31.9 | (1.93-3.85) | SV | PFJ11,r3-48,P237 | ||
| 24 | 00 42 15.67 | 41 17 21.3 | (1.29-2.39) | SV | PFJ12,r3-47,P238 | ||
| 25 | 00 42 18.33 | 41 12 24.0 | (2.77-3.17) | BHC,SV | TF19,PFJ14,r3-45,P244 | ||
| 26 | 00 42 18.62 | 41 14 02.1 | (1.34-1.61) | GCS,SV | Bo86,TF20,PFJ15,r3-44,TP11,P246 | ||
| 27 | 00 42 20.47 | 41 26 42.0 | (2.13-2.34) | R,BKG | B90 64,PFJ16,K22,P251 | ||
| 28 | 00 42 21.43 | 41 16 01.5 | (1.92-2.18) | TF21,PFJ17,r3-42,P252 | |||
| 29 | 00 42 21.55 | 41 14 20.1 | (2.25-3.02) | SV,Burst | r3-41,P253 | ||
| 30 | 00 42 22.40 | 41 13 34.3 | (1.76-2.62) | TF22,PFJ18,r3-40,P255 | |||
| 31 | 00 42 22.93 | 41 15 35.5 | (1.44-1.81) | SV | TF23,PFJ20,r3-39,P257 | ||
| 32 | 00 42 22.95 | 41 07 39.5 | (1.98-2.25) | r3-73,P258 | |||
| 33 | 00 42 23.12 | 41 14 07.8 | (1.60-2.37) | TF24,PFJ21,r3-38,P259 | |||
| 34 | 00 42 25.12 | 41 13 40.9 | (1.68-2.56) | SV | PFJ22,r2-45,P262 | ||
| 35 | 00 42 26.04 | 41 19 14.8 | (1.87-2.32) | GCS,SV | Bo96,TF26,PFJ23,r2-36,TP14,P263 | ||
| 36 | 00 42 26.16 | 41 25 52.6 | (1.51-1.99) | SV | PFJ24,r3-87,P264 | ||
| 37 | 00 42 28.18 | 41 10 00.8 | (1.48-1.62) | r3-36,P269 | |||
| 38 | 00 42 28.26 | 41 12 23.4 | (1.49-1.75) | SV | TF27,PFJ25,r2-35,P270 | ||
| 39 | 00 42 28.98 | 41 04 36.4 | (2.29-2.57) | SV | TF28,PFJ26,r3-111,P271 | ||
| 40 | 00 42 31.14 | 41 16 21.6 | (1.72-1.84) | SV | TF32,PFJ27,r2-34,P275 | ||
| 41 | 00 42 31.24 | 41 19 39.0 | (1.70-2.21) | GCS,SV | Bo107,TF33,PFJ28,r2-33,TP16,P277 | ||
| 42 | 00 42 32.06 | 41 13 14.6 | (1.10-1.39) | SV | TF34,PFJ29,r2-32,P280 | ||
| 43 | 00 42 33.03 | 41 03 28.5 | (1.69-2.27) | GCS,SV | Bo110,PFJ30,TP17,P282 | ||
| 44 | 00 42 33.87 | 41 16 19.8 | (1.83-2.42) | TF36,PFJ32,r2-30,P285 | |||
| 45 | 00 42 34.11 | 41 21 50.2 | (1.26-1.62) | r3-35,P286 | |||
| 46 | 00 42 34.41 | 41 18 09.7 | TR,BHC | r2-29,P287 | |||
| 47 | 00 42 35.23 | 41 20 06.3 | (1.54-2.13) | PFJ34,r2-27,P290 | |||
| 48 | 00 42 37.98 | 41 05 26.9 | (1.51-2.06) | r3-100,P296 | |||
| 49 | 00 42 38.56 | 41 16 03.8 | (1.59-1.90) | Z,SV | TF41,PFJ35,r2-26,P297 | ||
| 50 | 00 42 39.53 | 41 14 29.2 | (2.32-2.80) | SV | PFJ36,r2-25,P298 |
| Source | R.A. | Decl. | Photon | Fluxb | Classd | Optical/Radio/X-ray | |
|---|---|---|---|---|---|---|---|
| ID | Indexa | IDe,f | |||||
| 51 | 00 42 39.98 | 41 15 48.0 | (1.93-2.29) | SV | TF44,PFJ37,r1-15,P299 | ||
| 52 | 00 42 40.22 | 41 18 45.2 | (1.32-1.73) | r2-24,P301 | |||
| 53 | 00 42 40.65 | 41 10 33.2 | (1.35-1.90) | GCS | MIT212,r3-34,P303 | ||
| 54 | 00 42 40.68 | 41 13 27.6 | (1.37-1.95) | SV | PFJ38,r2-22,P302 | ||
| 55 | 00 42 41.48 | 41 15 24.3 | GCS | MIT213,r1-32,TP20,P307 | |||
| 56 | 00 42 41.66 | 41 21 05.5 | (1.74-1.91) | r3-31,P308 | |||
| 57 | 00 42 41.81 | 41 16 35.9 | (2.33-2.55) | TR,REC,BHC,SV | TF47 | ||
| 58 | 00 42 42.16 | 41 16 08.1 | (1.56-1.60) | TR | r1-5,P310 | ||
| 59 | 00 42 42.31 | 41 14 45.8 | (2.05-2.42) | SV | TF48,PFJ39,r2-21,P311 | ||
| 60 | 00 42 42.48 | 41 15 53.9 | (1.44-1.77) | SV | TF49,PFJ41,r1-14,P314 | ||
| 61 | 00 42 42.91 | 41 15 43.7 | (1.40-1.56) | TF52,PFJ42,r1-13,P317 | |||
| 62 | 00 42 43.75 | 41 16 31.5 | (1.93-2.36) | SV | TF55,PFJ43,r1-12,r1-29,r1-11,P319 | ||
| 63 | 00 42 44.33 | 41 16 08.4 | (2.07-3.20) | TF56,PFJ44,r1-10,r1-21,r1-9,P321 | |||
| 64 | 00 42 44.33 | 41 28 10.8 | P322 | ||||
| 65 | 00 42 44.38 | 41 11 58.3 | (1.71-2.47) | SV | r3-30,P323 | ||
| 66 | 00 42 44.80 | 41 11 38.1 | (1.72-2.53) | SV | TF58,PFJ45,r3-29,P326 | ||
| 67 | 00 42 44.90 | 41 17 40.0 | (1.40-1.70) | r2-18,P324 | |||
| 68 | 00 42 45.01 | 41 14 07.3 | (1.57-1.99) | PFJ46,r2-17,P328 | |||
| 69 | 00 42 45.05 | 41 16 21.4 | (2.05-2.47) | SV | 37W135,TF57,PFJ47,r1-4,P325 | ||
| 70 | 00 42 45.11 | 41 15 25.0 | PN,SNR | Ford21,r1-26,P327 | |||
| 71 | 00 42 45.22 | 41 17 22.1 | (1.67-2.16) | REC,SV | r2-16,P329 | ||
| 72 | 00 42 46.17 | 41 15 44.0 | PFJ48,r1-18,P332 | ||||
| 73 | 00 42 46.87 | 41 21 19.7 | (1.28-1.76) | r3-28,P333 | |||
| 74 | 00 42 46.97 | 41 16 15.7 | (1.87-1.99) | SV | TF59,PFJ49,r1-3,P334 | ||
| 75 | 00 42 47.16 | 41 16 28.5 | (1.85-2.41) | SV | TF60,PFJ50,r1-2,P335 | ||
| 76 | 00 42 47.22 | 41 11 57.7 | (1.81-2.54) | r3-27,P337 | |||
| 77 | 00 42 47.89 | 41 11 14.0 | GCS,REC | Bo 128,PFJ51 | |||
| 78 | 00 42 47.91 | 41 15 33.1 | (2.02-2.36) | SV | TF61,PFJ52,r1-6,P338 | ||
| 79 | 00 42 48.48 | 41 25 22.5 | (1.65-1.99) | SV | TF62,PFJ53,r3-25,P340 | ||
| 80 | 00 42 48.51 | 41 15 21.4 | (1.78-2.09) | SV | TF63,PFJ54,r1-1,P341 | ||
| 81 | 00 42 49.24 | 41 18 16.1 | (1.38-1.49) | SV | TF64,PFJ55,r2-14,P343 | ||
| 82 | 00 42 51.66 | 41 13 03.1 | (1.72-2.42) | SV | r2-39,P350 | ||
| 83 | 00 42 52.52 | 41 15 40.2 | SSS | TF69,PFJ58,r2-12,P352 | |||
| 84 | 00 42 52.54 | 41 18 54.8 | (1.77-2.15) | SV | TF68,PFJ57,r2-13,P353 | ||
| 85 | 00 42 53.67 | 41 25 51.8 | SNR | BA 521,B90 106,PFJ59,r3-69,P354 | |||
| 86 | 00 42 54.90 | 41 16 03.4 | (1.84-1.99) | SV | TF71,PFJ60,r2-11,P357 | ||
| 87 | 00 42 55.33 | 41 25 57.6 | (1.72-2.14) | SV | TF70,PFJ61,r3-23,P358 | ||
| 88 | 00 42 55.41 | 41 18 35.1 | (1.81-2.05) | GCS | Bo138,PFJ62,r2-10/r2-10,TP23,P360 | ||
| 89 | 00 42 57.90 | 41 11 05.0 | (1.83-2.06) | SV | TF73,PFJ64,r3-22,P364 | ||
| 90 | 00 42 58.28 | 41 15 29.6 | (1.26-2.51) | SV | TF74,PFJ65,r2-7,P365 | ||
| 91 | 00 42 59.67 | 41 19 19.6 | (1.92-2.11) | GCS,SV | Bo143,TF76,PFJ66,r2-6,TP24,P372 | ||
| 92 | 00 42 59.87 | 41 16 05.9 | (1.42-1.69) | GCS,SV | Bo144,TF77,PFJ67,r2-5,TP25,P373 | ||
| 93 | 00 43 01.10 | 41 13 50.8 | (1.39-1.43) | PFJ68,r2-37,P376 | |||
| 94 | 00 43 03.06 | 41 15 25.1 | (2.05-2.45) | GCS,SV | Bo146,TF79,PFJ70,r2-3/r2-4,P384 | ||
| 95 | 00 43 03.12 | 41 10 15.5 | (1.51-1.77) | PFJ71,r3-20,P383 | |||
| 96 | 00 43 03.31 | 41 21 21.6 | (2.11-2.27) | GCS | Bo147,PFJ72,r3-19,TP28,P385 | ||
| 97 | 00 43 03.88 | 41 18 05.2 | (1.61-2.12) | GCS,SV | Bo148,TF80,PFJ73,r2-2,TP29,P386 | ||
| 98 | 00 43 04.23 | 41 16 01.3 | (1.73-2.03) | r2-1,P388 | |||
| 99 | 00 43 05.68 | 41 17 02.8 | TR,BHC | K124,P390 | |||
| 100 | 00 43 07.13 | 41 18 10.3 | TR | K125,P395 |
| Source | R.A. | Decl. | Photon | Fluxb | Classd | Optical/Radio/X-ray | |
|---|---|---|---|---|---|---|---|
| ID | Indexa | IDe,f | |||||
| 101 | 00 43 07.51 | 41 20 20.1 | (1.46-2.87) | GCS | Bo150,MIT246,r3-18,TP30,P396 | ||
| 102 | 00 43 08.62 | 41 12 48.7 | (0.73-1.08) | DIP,SV | PFJ74,r3-17,P403 | ||
| 103 | 00 43 09.87 | 41 19 01.1 | (1.77-2.81) | R,SV,BKG | B90 125,TF82,PFJ75,r3-16,P405 | ||
| 104 | 00 43 09.94 | 41 23 32.5 | TR | ||||
| 105 | 00 43 10.62 | 41 14 51.5 | (1.48-1.71) | GCS,SV | Bo153,MIT251,TF83,PFJ76,r3-15,TP31,P408 | ||
| 106 | 00 43 11.35 | 41 18 09.8 | (1.68-2.29) | TF84,r3-14,P410 | |||
| 107 | 00 43 13.30 | 41 18 12.8 | (1.58-2.27) | r3-13,P412 | |||
| 108 | 00 43 14.37 | 41 07 21.2 | (0.56-0.74) | GCS,DIP,SV | Bo158,TF85,PFJ77,K132,TP32,P414 | ||
| 109 | 00 43 15.42 | 41 11 25.0 | (2.17-2.63) | GCS | Bo161,MIT260,PFJ78,r3-10,TP34,P419 | ||
| 110 | 00 43 15.51 | 41 24 40.0 | TR,BHC | ||||
| 111 | 00 43 16.15 | 41 18 41.7 | (1.36-1.71) | r3-9,P420 | |||
| 112 | 00 43 16.20 | 41 03 48.5 | P422 | ||||
| 113 | 00 43 18.95 | 41 20 17.5 | REC,SSS | TF87,r3-8,P430 | |||
| 114 | 00 43 19.47 | 41 17 56.9 | TR,SSS | P431 | |||
| 115 | 00 43 21.07 | 41 17 50.8 | (1.79-3.46) | SV | PFJ79,r3-7,P437 | ||
| 116 | 00 43 24.82 | 41 17 26.6 | (1.32-1.35) | P443 | |||
| 117 | 00 43 27.95 | 41 18 30.5 | SNR | BA 23,B90 142,TF89,PFJ80,r3-63,P454 | |||
| 118 | 00 43 29.13 | 41 07 47.7 | (0.69-0.97) | PFJ81,P457 | |||
| 119 | 00 43 32.41 | 41 10 40.8 | (0.80-1.00) | r3-3,P463 | |||
| 120 | 00 43 34.32 | 41 13 23.9 | (2.03-2.45) | SV | TF91,PFJ82,r3-2,P467 | ||
| 121 | 00 43 37.28 | 41 14 43.5 | (1.41-1.55) | GCS,SV | Bo185,MIT299,TF92,PFJ83,r3-1,TP37,P471 | ||
| 122 | 00 43 43.98 | 41 12 31.4 | SNR | B90 166,PFJ84,P486 | |||
| 123 | 00 43 53.70 | 41 16 56.0 | (2.55-2.83) | BHC,SV | TF94,PFJ86,K143,P503 |
-
a – weighted average value and the observed range of the power law model photon index.
-
b – absorbed source power law model flux in the 0.3 - 10 keV energy range in units of erg s-1 cm-2
-
c – estimated absorbed source luminosity in the 0.3 - 10 keV energy band in units of ergs s-1, assuming the distance of 760 kpc.
-
d – source classification: SV – spectrally variable, TR – transient, REC – recurrent, SSS – supersoft source, SNR – supernova remnant, BHC – black hole candidate, Z – Z-source candidate, GCS – globular cluster source, R – radio source, BKG – background AGN.
-
e – source identifications beginning with Bo refer to Globular Cluster candidates listed in Table IV of Battistini et al. (1987), MIT – in Magnier (1993). Source identifications beginning with BA refer to the SNR candidates listed in Baade & Arp (1964). “Ford21” refers to planetary nebula candidate from Ford & Jacoby (1978). Radio source identifications beginning with 37W and B90 refer to the source lists in Walterbos, Brinks & Shane (1985) and Braun (1990).
-
f – source identifications beginning with TF refer to M31 Einstein X-ray source catalog entries from Trinchieri & Fabbiano (1991). Identifications beginning with PFJ refer to X-ray sources from Primini, Forman and Jones (1993). Identifications beginning with r and K refer to the lists of M31 X-ray sources in Kong et al. (2002) and Kaaret (2002). Identifications beginning with TP refer to the list of globular cluster X-ray sources in Trudolyubov & Priedhorsky (2004). Identifications starting with P refer to sources from Pietsch et al. (2005).
| Obs. | Model | NH | kT/Ecut | Photon | Fluxb | Fluxc | Instrument | |||
| # | ( cm-2) | (keV) | (km) | Index | (d.o.f) | |||||
| SRC # 20 | ||||||||||
| 1 … | PL | … | … | 54.4 | pn | |||||
| DISKBB | … | 52.2 | … | |||||||
| 2 … | PL | … | … | 52.3 | pn | |||||
| DISKBB | … | 48.5 | … | |||||||
| 3 … | PL | … | … | 63.3 | pn | |||||
| DISKBB | … | 61.4 | … | |||||||
| 4 … | PL | … | … | 49.5 | pn+M1+M2 | |||||
| DISKBB | … | 46.8 | … | |||||||
| 7 … | PL | … | … | 28.7 | pn | |||||
| DISKBB | … | 26.8 | … | |||||||
| SRC # 25 | ||||||||||
| 1 … | PL | … | … | 32.6 | M2 | |||||
| DISKBB | … | 29.0 | … | |||||||
| 2 … | PL | … | … | 34.3 | pn | |||||
| DISKBB | … | 31.3 | … | |||||||
| 3 … | PL | … | … | 15.8 | pn | |||||
| DISKBB | … | 14.3 | … | |||||||
| 4 … | PL | … | … | 22.5 | pn | |||||
| DISKBB | … | 21.1 | … | |||||||
| 5 … | PL | … | … | 31.8 | pn | |||||
| DISKBB | … | 30.1 | … | |||||||
| 7 … | PL | … | … | 40.2 | pn | |||||
| DISKBB | … | 30.1 | … | |||||||
| SRC # 49 | ||||||||||
| 1 … | PL | … | … | 483.4 | pn | |||||
| CUTOFFPL | … | 478.6 | … | |||||||
| 2 … | PL | … | … | 515.4 | M1+M2 | |||||
| CUTOFFPL | … | 479.6 | … | |||||||
| 3 … | PL | … | … | 497.9 | pn | |||||
| CUTOFFPL | … | 490.9 | … | |||||||
| 4 … | PL | … | … | 358.3 | M1+M2 | |||||
| CUTOFFPL | … | 337.7 | … | |||||||
| 7 … | PL | … | … | 487.6 | pn | |||||
| CUTOFFPL | … | 486.7 | … | |||||||
| SRC # 80 | ||||||||||
| 1 … | PL | … | … | 95.2 | M1+M2 | |||||
| CUTOFFPL | … | 90.6 | … | |||||||
| 2 … | PL | … | … | 71.5 | pn | |||||
| CUTOFFPL | … | 68.2 | … | |||||||
| 3 … | PL | … | … | 82.7 | M1+M2 | |||||
| CUTOFFPL | … | 81.1 | … | |||||||
| 4 … | PL | … | … | 85.5 | pn+M1+M2 | |||||
| CUTOFFPL | … | 83.3 | … | |||||||
| SRC # 118 | ||||||||||
| 1 … | PL | … | … | 68.5 | M1+M2 | |||||
| CUTOFFPL | … | 59.3 | … | |||||||
| 3 … | PL | … | … | 79.9 | pn | |||||
| CUTOFFPL | … | 69.0 | … | |||||||
| 4 … | PL | … | … | 60.8 | pn+M2 | |||||
| CUTOFFPL | … | 53.0 | … | |||||||
| 5 … | PL | … | … | 77.4 | pn | |||||
| CUTOFFPL | … | 68.0 | … | |||||||
| SRC # 123 | ||||||||||
| 1 … | PL | … | … | 36.8 | M1+M2 | |||||
| DISKBB | … | 33.3 | … | |||||||
| 2 … | PL | … | … | 15.4 | pn | |||||
| DISKBB | … | 11.9 | … | |||||||
| 3 … | PL | … | … | 34.2 | M1+M2 | |||||
| DISKBB | … | 30.4 | … | |||||||
| 4 … | PL | … | … | 27.4 | pn+M1+M2 | |||||
| DISKBB | … | 24.4 | … | |||||||
-
a – color radius
-
b – absorbed model flux in the keV energy range in units of erg s-1 cm-2
-
c – unabsorbed model flux in the keV energy range in units of erg s-1 cm-2
-
d – absorbed luminosity in the keV energy range in units of erg s-1, assuming the distance of 760 kpc
| Model: (BBODYRAD+DISKBB)*WABS | ||||||||||
| Obs. | Fluxa | Fluxb | Instrument | |||||||
| ( cm-2) | (keV) | (km) | (keV) | (km) | (dof) | |||||
| SRC | ||||||||||
| 1 … | 67.7 | pn | ||||||||
| 3 … | 191.0 | pn | ||||||||
| 4 … | 161.5 | pn+M1+M2 | ||||||||
| SRC | ||||||||||
| 1 … | 474.1 | pn | ||||||||
| 2 … | 457.1 | M1+M2 | ||||||||
| 3 … | 483.0 | pn | ||||||||
| 4 … | 330.8 | M1+M2 | ||||||||
| 7 … | 481.9 | pn | ||||||||
| SRC | ||||||||||
| 1 … | 87.3 | pn | ||||||||
| 3 … | 80.2 | pn | ||||||||
| 4 … | 81.9 | pn | ||||||||
| Model: Absorbed Comptonization Model (COMPTT*WABS) | ||||||||||
| Fluxa | Fluxb | Instrument | ||||||||
| ( cm-2) | (keV) | (keV) | (dof) | |||||||
| SRC | ||||||||||
| 1 … | 68.8 | pn | ||||||||
| 3 … | 193.9 | pn | ||||||||
| 4 … | 163.9 | pn+M1+M2 | ||||||||
| SRC | ||||||||||
| 1 … | 476.7 | pn | ||||||||
| 2 … | 463.4 | M1+M2 | ||||||||
| 3 … | 486.6 | pn | ||||||||
| 4 … | 329.5 | M1+M2 | ||||||||
| 7 … | 484.8 | pn | ||||||||
-
a – Absorbed model flux in the keV energy range in units of erg s-1 cm-2
-
b – unabsorbed model flux in the keV energy range in units of erg s-1 cm-2
-
c – Absorbed isotropic source luminosity in the keV energy range in units of erg s-1 assuming the distance of 760 kpc
| Obs. | Model | NH | kT/Ecut | Photon | Fluxb | Fluxc | Instrument | |||
| ( cm-2) | (keV) | (km) | Index | (d.o.f) | ||||||
| SRC | ||||||||||
| 5 … | PL | … | … | 32.6 | pn+M1+M2 | |||||
| DISKBB | … | 30.3 | … | |||||||
| 6 … | PL | … | … | 26.5 | pn+M1+M2 | |||||
| DISKBB | … | 23.1 | … | |||||||
| 7 … | PL | … | … | 27.7 | pn+M2 | |||||
| DISKBB | … | 25.2 | … | |||||||
| SRC | ||||||||||
| 4 … | BB | … | 3.72 | M1+M2 | ||||||
| SRC | ||||||||||
| 1 … | PL | … | … | 23.0 | pn+M1+M2 | |||||
| DISKBB+PL | 25.1 | … | ||||||||
| SRC | ||||||||||
| 5 … | PL | … | … | 54.3 | pn+M1+M2 | |||||
| DISKBB | … | 49.1 | … | |||||||
| 6 … | PL | … | … | 64.3 | pn+M1+M2 | |||||
| DISKBB | … | 59.1 | … | |||||||
| 7 … | PL | … | … | 74.2 | pn+M1+M2 | |||||
| DISKBB | … | 67.7 | … | |||||||
| SRC | ||||||||||
| 1 … | PL | … | … | 86.3 | M1+M2 | |||||
| CUTOFFPL | … | 80.7 | … | |||||||
| 2 … | PL | … | … | 43.5 | pn | |||||
| CUTOFFPL | … | 42.2 | … | |||||||
| SRC | ||||||||||
| 4 … | PL | … | … | 34.1 | pn+M1+M2 | |||||
| DISKBB+PL | 37.5 | … | ||||||||
| SRC | ||||||||||
| 4 … | PL | … | … | 12.69 | M1+M2 | |||||
| SRC | ||||||||||
| 5 … | PL | … | … | 2.57 | pn | |||||
| DISKBB | … | 1.91 | … | |||||||
| 6 … | PL | … | … | 3.04 | pn | |||||
| DISKBB | … | 2.97 | … | |||||||
| SRC | ||||||||||
| 5 … | PL | … | … | 7.62 | pn | |||||
| DISKBB | … | 6.86 | … | |||||||
| SRC | ||||||||||
| 1 … | BB | … | 26.6 | pn+M1+M2 | ||||||
-
a – color radius
-
b – absorbed model flux in the keV energy range in units of erg s-1 cm-2
-
c – unabsorbed model flux in the keV energy range in units of erg s-1 cm-2
-
d – absorbed luminosity in the keV energy range in units of erg s-1, assuming the distance of 760 kpc
| Obs. | NH | kTbb | Fluxb | Fluxc | Instrument | |||
| ( cm-2) | (eV) | (km) | (d.o.f) | |||||
| SRC | ||||||||
| 1 | 182.4(150) | 39.1 | pn+M1+M2 | |||||
| 2 | 42.5(41) | 28.4 | pn | |||||
| 3 | 104.5(85) | 36.6 | pn | |||||
| 5 | 100.0(87) | 28.8 | pn | |||||
| SRC | ||||||||
| 1 | 62.7(38) | 11.7 | M1+M2 | |||||
| 3 | 38.3(33) | 0.8 | pn | |||||
-
a – color radius
-
b – absorbed model flux in the keV energy range in units of erg s-1 cm-2
-
c – unabsorbed model flux in the keV energy range in units of erg s-1 cm-2
-
d – absorbed luminosity in the keV energy range in units of erg s-1, assuming the distance of 760 kpc
| Model | log | Abundancea | N | Fluxc | /(dof) | |||||
| (keV) | N | O | Ne | S | Fe | |||||
| Source 85 = SNR BA 521, EPIC-pn, Obs. 1,3,4 | ||||||||||
| MEKAL | … | 1 | 1 | 1 | 1 | 1 | 111.4(60) | |||
| … | 1 | 109.8(60) | ||||||||
| … | 73.4(57) | |||||||||
| NEI | 1 | 1 | 1 | 1 | 1 | 133.9(59) | ||||
| 1 | 64.0(59) | |||||||||
| 63.3(56) | ||||||||||
| Source 117 = SNR BA 23, EPIC-pn, Obs. 1,3,4 | ||||||||||
| MEKAL | … | 1 | 1 | 1 | 1 | 1 | 199.8(156) | |||
| … | 1 | 169.4(156) | ||||||||
| … | 141.7(153) | |||||||||
| NEI | 1 | 1 | 1 | 1 | 1 | 171.1(155) | ||||
| 1 | 158.2(155) | |||||||||
| 133.5(152) | ||||||||||
| Source 70, EPIC-pn, Obs. 4 | ||||||||||
| MEKAL | … | 1 | 1 | 1 | 1 | 1 | 36.4(20) | |||
| … | 1 | 1 | 26.3(17) | |||||||
| Source 122 = B90 166, EPIC-pn, Obs. 3,4 | ||||||||||
| MEKAL | … | 1 | 1 | 1 | 1 | 1 | 23.8(23) | |||
| … | 18.8(20) | |||||||||
-
a – Relative to the solar abundance.
-
b – An equivalent hydrogen column density in units of cm-2.
-
c – Absorbed model flux in the keV energy range in units of erg s-1 cm-2.
-
d – Fixed at optical value Blair et al. (1982).