95.55.Kacosmology-observations \PACSit98.70.Rz-ray sources; -ray bursts
Can we use GRB to probe high redshift star-formation?
Abstract
We present a detailed analysis of the selection effects that plague GRB observations. We find that these effects may partially explain the different redshift distributions between BeppoSax/HETE2 and Swift bursts. It is mandatory to consider these effects to determine the redshift evolution of GRBs.
1 Introduction
Gamma Ray Bursts (GRBs) are one of the great wonders of Universe. They combine several of the hottest topics of 21st century astrophysics. On one side they are privileged laboratories for fundamental physics, including relativistic physics, acceleration processes and radiation mechanisms. On the other side, being GRBs associated to the death of massive stars, they can be used as cosmological tools to investigate star-formation and metal enrichment at the epochs of galaxy birth, formation and growth. There are two main research areas to the latter purpose. The first one uses the GRB as a background beacon for spectroscopy of UV lines, to characterize the physical and chemical status of the matter along the line of sight. The second includes statistical studies of the GRB redshift distributions [1] to infer information on the histories of the GRB- and star- formation rates and of the metal enrichment in the Universe (e.g. [2]).
Although the techniques adopted, and therefore the reference communities, are somewhat different, these research areas are interconnected. As an example, on one hand spectroscopy of UV lines can be used to determine the metal content of the absorption systems. On the other hand, it is well known that galaxy scale properties like metalicity, star-formation rate and mass are correlated. Then, metalicity determinations obtained through GRB spectroscopy could be, at least in principle, plugged in the GRB population studies, to obtain a better constraint on the models.
Unfortunately, both research areas are plagued by large uncertainties.
(1) Absorption line spectroscopy is certainly a powerful tool. Spectroscopy of galaxies and QSOs is routinely used to study both the galaxy Inter-Stellar-Matter (ISM) and the Inter-Galactic-Matter (IGM) along the line of sight. However, star-formation regions and the ISM in general, are highly complex systems. It is then not clear whether single lines of sight can provide information truly representative of such systems as a whole.
(2) Population studies are also very powerful tools. Galaxy and AGN counts and luminosity functions have been used to successfully measure the evolution of the star-formation rate, of the galaxy and black hole mass densities up to z=3-4 and beyond. Thanks to first BeppoSAX and then to HETE2 and Swift we start to have sizable samples of reliable GRB redshifts (about 70 up to now), and a similar number will likely be produced by Swift in the next few years. This opens up the possibility to compute relatively well constrained GRB luminosity functions in a few redshift bins, and therefore measure the cosmic evolution of the GRB rate. However, the fraction of Swift GRBs with a reliable redshift is today about one third of the total. It is expected that this fraction will improve in future, but it will hardly approach to the majority of the GRBs. This means that the biggest problem we have to face to use GRBs as cosmological tools is to understand and account for large selection effects.
In the next sections we address the second problems while the first is discussed in a companion paper [3].
2 GRB population studies
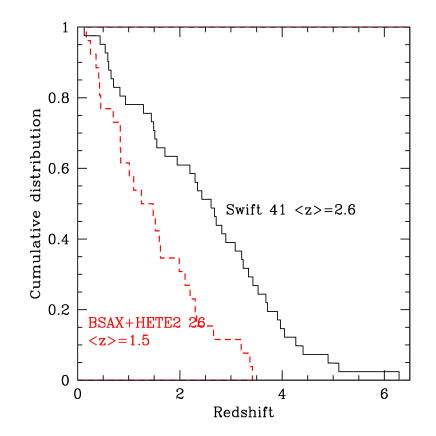
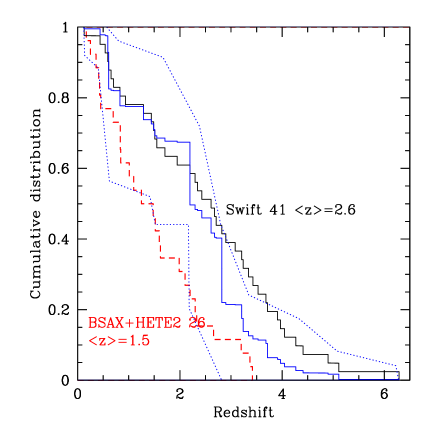
The importance of large selection effects shaping the population of GRBs with a measured redshift is evident when comparing the redshift distribution of Swift GRBs with that of BeppoSAX and HETE2 GRBs (figure 1). The median redshifts of the two distributions are 2.6 and 1.5 respectively. This discrepancy can not be simply explained as due to a different detector sensitivity (Guetta & Piran in preparation). To gain more information on this issue we study three well defined sample of GRBs detected by these three satellites. We select GRBs outside the Galactic plane, to limit Galactic extinction along their line of sight and to avoid fields too crowded, which can complicate the discovery of optical/NIR afterglows, so hampering redshift determinations. To this purpose we limit our study to regions with Galactic column density along the line of sight cm-2. We also select GRBs with good (arcmin) localization. For BeppoSAX and HETE2 GRBs we require that the ray burst is detected by the high energy GRBM and Fregate instruments and is localized by the WFC, WXC or SXC instruments. For Swift we consider all GRBs up to September 10 2006. We consider only reliable spectroscopic redshift. Table 1 gives more information on the selected samples.
| Sat. | Tot. GRB | O.A. | O. decay | Tot. z spec. | z from host gal. |
|---|---|---|---|---|---|
| Swift | 122 | 62 | 44 | 41 | 6 |
| HETE2 | 44 | 17 | 15 | 14 | 2 |
| BeppoSAX | 39 | 18 | 16 | 12 | 3 |
There are two large groups of selection effects that must be considered at least: (1) GRB detection and localization and (2) redshift determination through spectroscopy of the optical/NIR afterglow or of the GRB host galaxy. We discuss these two issues in the next sections.
2.1 GRB detection and localization
The sensitivity of BeppoSAX, HETE2 and Swift instruments as a function of the GRB spectral shape has been studied in detail by [4, 5].[5] also studied the sensitivity of the BAT instrument as a function of the combined GRB temporal and spectral properties. We refer to these papers for more details on these topics.
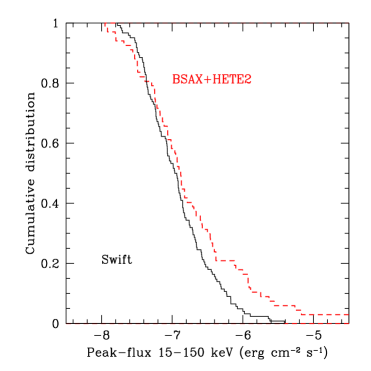
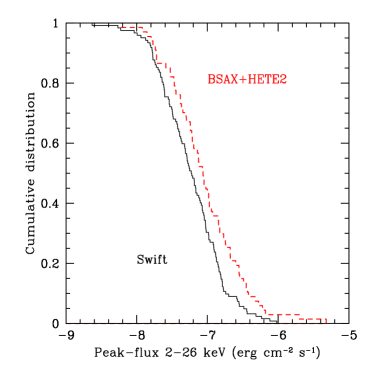
Figure 2 compares the peak-flux cumulative distributions of the Swift GRBs with that of BeppoSAX and HETE2. The comparison is done in two energy bands: 15-150 keV, which is the band where BAT detects and localizes GRBs, and 2-26 keV, which is the band where the BeppoSAX WFC and the HETE2 WXC and SXC localize GRBs. To produce figure 2a) GRBM and Fregate peak fluxes were converted to the 15-150 keV BAT band using a power law model with an average energy index of 0.5 for the BeppoSAX burts and the best fit model in [6] for the HETE2 bursts. BAT peak-fluxes and spectral parameters are taken from the Swift GRB Information page111 http://swift.gsfc.nasa.gov/docs/swift/archive/grb_table.html. To produce figure 2b) we used WFC and WXC peak-fluxes and converted BAT 15-150 keV peak fluxes in the 2-26 keV band using the best fit models and parameters and the best fit observed column densities along the line of sight to the GRBs. To assess the robustness of our analysis we produced peak-flux cumulative distributions using different, but reasonable, values of the spectral parameters adopted for the conversion from one band to the other. We always found results qualitatively similar to those in figure 2.
Figure 2a) shows that Swift is finding, on average, GRBs slightly fainter than BeppoSAX and HETE2 in the 15-150 keV band. The BeppoSAX and HETE2 samples contain a higher fraction of bright GRBs. The median log(peak-flux) and its interquartile range are -6.93, 0.33 for the Swift sample and -6.88, 0.42 for the joined BeppoSAX+HETE2 sample. This is expected because of the better sensitivity of the BAT instrument with respect to the BeppoSAX GRBM and HETE2 Fregate instruments ([b2003]). The median 2-26 keV log(peak-flux) is -7.22, 0.32 for the Swift sample and -7.06, 0.38 for the joined BeppoSAX+HETE2 sample. The two 2-26 keV distributions differ more than the 15-150 keV peak-flux distributions. This is probably due to the fact that Swift GRBs are localized at energies higher than 10-15 keV, while BeppoSAX and HETE2 GRBs are localized at energies keV. This implies that Swift localizes, on average, GRBs harder and/or less affected by photoelectric absorption than BeppoSAX and HETE2. In particular, the latter GRB samples would be biased against flat spectrum GRBs and also against large obscuration. A column density of N cm-2 at z=1 would reduce the observed 2-10 keV flux by 12-15% (depending on the spectral index), thus reducing the probability of a detecting such highly obscured GRBs with BeppoSAX WFC and HETE2 WXC. Conversely, they would certainly be present in the Swift sample.
|
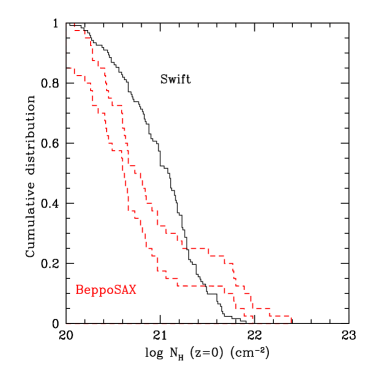
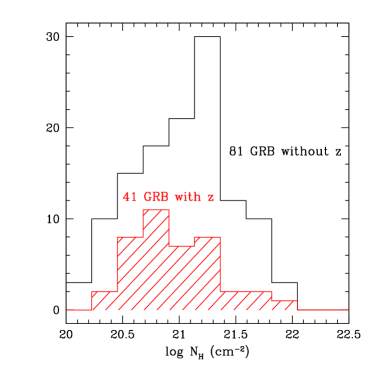
Figure 3a) compares the observer frame best fit column density NH for the samples of Swift and BeppoSAX GRBs. The uncertainties on the X-ray spectral parameters, and therefore on NH, are much bigger for the BeppoSAX GRBs than for the Swift GRBs. Indeed, the typical uncertainty on Swift column densities is cm-2 (see e.g. [7]), while that on BeppoSAX column densities is times higher (see [8, 9, 10]). For this reason we plot 2 curves for the BeppoSAX GRBs. The leftmost curve assumes NH=N for the GRBs with a best fit intrinsic NH consistent with zero. The rightmost curve assumes for these GRBs the 90% upper limit. The real BeppoSAX NH distribution is probabily between the two curves. Both BeppoSAX curves in figure 3a) are significantly lower than the Swift curve (probability and 1.7 % respectively, using the Kolmogorov-Smirnov test), thus confirming that Swift samples are less biased against obscuration than the BeppoSAX sample. Since the observer frame column density scales as the rest frame column density times (1+z)-2.5, the BeppoSAX sample would probably be biased against low-z, highly obscured GRBs. Conversely, these GRBs must be present in the Swift sample. However the determination of their redshift may be complicated by dust extinction, which makes fainter the optical afterglow, if dust is associated to the X-ray absorbing gas. Indeed, the NH distribution of the Swift GRB with a redshift is shifted toward lower NH values than the distribution of GRB without redshifts (figure 3b). This introduces the next important group of selection effects, those concerning the determination of the redshift of a GRB through spectroscopy of the optical/NIR afterglow or of its host galaxy.
|
2.2 Redshift determination
In determining the redshift of a GRB the identification of the optical afterglow plays a major role. Only 6 redshift of the Swift GRB sample considered here have been found through spectroscopy of the host galaxy (5 for the BeppoSAX and HETE2 joined sample).
Optical afterglows have been discovered for 50% of the Swift GRB sample, a fraction only slightly greater than that of the joined BeppoSAX and HETE2 sample (42%). This result is somewhat surprising, because the prompt Swift localization (minutes) and the large international effort on Swift GRB follow-up, which can exploit an impressive number of facilities, from dedicated robotic telescopes to 8m class telescopes like the VLT, Gemini and Keck, was thought to produce a much larger fraction of optical/NIR afterglow identifications than BeppoSAX and HETE2.
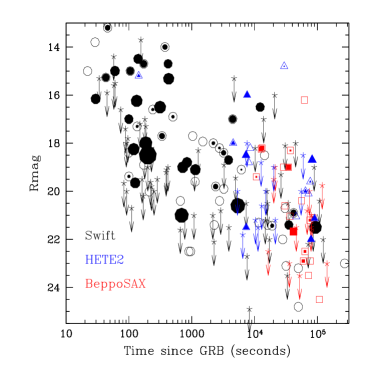
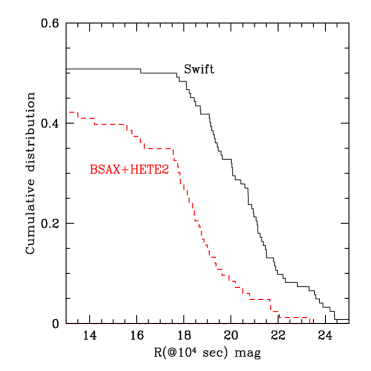
Figure 4a) shows the R magnitude of the optical afterglow at the time of its discovery as a function of this time for the Swift GRBs and the BeppoSAX and HETE2 GRBs. As expected redshifts are preferably found for bright afterglows. The figure also suggests that on average and at each given time from the GRB even the Swift optical afterglows are fainter than the BeppoSAX and HETE2 afterglows. We then computed the magnitude of the Swift, BeppoSAX and HETE2 afterglows at a fixed time using the best fit decay indices found for each GRB afterglow, if available. In the rest of the cases we used a decay index of -1. We chose a fixed time of 10 ksec after the burst (observer frame). Figure 4b) compares the Swift distribution of the R magnitude @ 10 ksec with that of the BeppoSAX and HETE2. As we can see from this figure Swift detect much fainter bursts in the optical band.
|
3 Selection effects at works
To understand how the different selection effects (peak-flux limit, X-ray obscuration and magnitude of the optical afterglow) can modify the redshift distribution we extracted from the Swift GRB sample a subsample having the same peak-flux, NH and Rmag(@10ksec) distributions of the joined BeppoSAX+HETE2 samples (the simulated redshift distribution hereafter). Figure 5 compares the redshift distrubution of this subsample with the full Swift and BeppoSAX+HETE2 GRBs. To evaluate the uncertainty on the simulated redshift distribution we ran the random extraction 100 times. We see that the average simulated redshift distribution is consistent, within the statistical uncertainties, with the real BeppoSAX+HETE2 redshift distribution at all redshifts but z=1.5-2. In particular, the shallower peak-flux limit and brighter magnitudes of the optical afterglow of the BeppoSAX+HETE2 GRBs explain why only few high redshift GRBs are found in this sample. On the other hand, the smaller number of low-z GRBs can be explained by the lower absorbing column densities of the BeppoSAX GRBs. It remains to understand the deficit of z=1.5-2 GRBs in the BeppoSAX+HETE2 sample. This can hardly be explained by the three quantities considered in our analysis. A possible explanation for this deficit can be related to the lack of strong absorption features in the 3800-8000 Å range covered by optical spectrometers for this redshift interval, coupled with worse quality spectroscopy available at least at the time of the BeppoSAX measurements. In fact, the Lyman enters the above range only at z, while the MgII doublet goes in a region strongly affected by telluric features at z. It is however difficult to make more quantitative this issue.
In conclusion, in order to safely use GRBs as cosmological tools and derive their redshift evolution from statistical analysis of the present GRB samples selection effects on GRB detection, GRB localization and GRB redshift determination must be taken into account properly (Guetta et al. 2006 in preparation).
Acknowledgements.
We thank Eli Waxman for his useful comments. We acknowledge support from contracts ASI/I/R/039/04 and ASI/I/R/023/05/0.References
- [1] \BYGuetta D., Piran T. \atqueWaxman E. \INAstroph. J.6192005412
- [2] \BYPorciani C. \atqueMadau P. \INAstroph. J.5482001522;
- [3] \BYD’Elia V., Piranomonte, S., Fiore, F. et al. \TITLEThe Multicoloured Landscape of Compact Objects and their Explosive Origins, in \TITLEAIP, edited by \NAMEBurderi L et al. 2007 in press
- [4] \BYBand D.L. \INAstroph. J.5882003945;
- [5] \BYBand D.L. \INAstroph. J.6442006378;
- [6] \BYSakamoto T, Lamb D.Q, Kawai N et al. \INAstroph. J.6292005311;
- [7] \BYCampana S, Romano P., Covino S. et al. \INAstron. Astroph.449200661;
- [8] \BYStratta G., Fiore F., Antonelli L.A., Piro L., De Pasquale M. \INAstroph. J.6082004846;
- [9] \BYDe Pasquale M., Piro L., Gendre. et al. \INAstron Astroph.4552006813;
- [10] \BYPiro L., De Pasquale M., Soffitta P. et al. \INAstroph. J.6232005314;