The 400 square degrees ROSAT PSPC galaxy cluster survey:
Catalog and statistical calibration
Abstract
We present a catalog of galaxy clusters detected in a new ROSAT PSPC survey. The survey is optimized to sample, at high redshifts, the mass range corresponding to keV clusters at . Technically, our survey is the extension of the 160 square degrees survey (160d, Vikhlinin et al., 1998a; Mullis et al., 2003). We use the same detection algorithm, thus preserving high quality of the resulting sample; the main difference is a significant increase in sky coverage. The new survey covers 397 square degrees and is based on 1610 high Galactic latitude ROSAT PSPC pointings, virtually all pointed ROSAT data suitable for the detection of distant clusters. The search volume for X-ray luminous clusters within exceeds that of the entire local Universe (). We detected 287 extended X-ray sources with fluxes erg scm-2 in the 0.5–2 keV energy band, of which 266 (93%) are optically confirmed as galaxy clusters, groups or individual elliptical galaxies. This paper provides a description of the input data, the statistical calibration of the survey via Monte-Carlo simulations, and the catalog of detected clusters. We also compare the basic results to those from previous, smaller area surveys and find good agreement for the – distribution and the local X-ray luminosity function. Our sample clearly shows a decrease in the number density for the most luminous clusters at . The comparison of our ROSAT-derived fluxes with the accurate Chandra measurements for a subset of high-redshift clusters demonstrates the validity of the 400 square degree survey’s statistical calibration.
Subject headings:
catalogs — galaxies: clusters: general — surveys — X-rays: galaxies1. Introduction
Observations of galaxy clusters over a range of redshifts is an attractive way to probe fundamental cosmological parameters. Cluster data have been extensively used in the past for this purpose (e.g., Evrard, 1989; White et al., 1993; Oukbir & Blanchard, 1992; Viana & Liddle, 1996, 1999; Eke et al., 1998; Henry, 1997, 2000; Viana et al., 2003; Vikhlinin et al., 2003; Voevodkin & Vikhlinin, 2004; Schuecker et al., 2003), primarily to constrain the cosmological density parameter. Clusters also can be used as an independent and complementary Dark Energy probe (Starobinsky, 1998; Wang & Steinhardt, 1998; Huterer & Turner, 2001; Haiman et al., 2001; Battye & Weller, 2003; Molnar et al., 2004; Hu & Cohn, 2006).
These cosmological applications rely on the existence of large, unbiased, and statistically complete cluster samples. Using the X-ray emission of the hot intracluster medium (ICM) is one of the best methods of finding distant clusters (Gioia et al., 1990a; Rosati et al., 1995; Vikhlinin et al., 1998a). A comparison of the efficiency of detecting clusters in X-rays versus other methods can be found, for example, in Rosati et al. (2002). The presently available X-ray selected samples are those from the Einstein Extended Medium Sensitivity Survey (EMSS; Gioia et al., 1990b; Stocke et al., 1991) and various samples derived from the ROSAT PSPC observations — the 160d survey (Vikhlinin et al., 1998a; Mullis et al., 2003), Bright SHARC (Romer et al., 2000), WARPS (Scharf et al., 1997; Perlman et al., 2002), SHARC South (Burke et al., 2003), NEP (Henry et al., 2001; Gioia et al., 2003), and RDCS (Rosati et al., 1998). There is an ongoing survey based on ROSAT HRI data (BMW, Moretti et al., 2004), and also a survey sampling very X-ray luminous clusters using the data from the ROSAT All-Sky Survey (Ebeling et al., 2001a, MACS).
The largest sample published to date comes from the 160d survey. In that survey, clusters were serendipitously selected as extended X-ray sources in the inner region of the ROSAT PSPC field of view where the angular resolution is sufficient to spatially resolve clusters even at high redshifts. The 160d catalog includes 203 clusters, 43 of them at . MACS is expected to find a similar number of distant clusters, all with much higher X-ray luminosities.
None of the previous ROSAT surveys based on pointed observations made use of all data suitable for finding distant clusters. Our new survey does exactly that. It is obtained by applying the 160d cluster detection algorithm to virtually all suitable ROSAT PSPC fields (1610 in total), resulting in a sky coverage of 397 deg2. Hereafter, we call it the 400d survey. The 400d sample includes only objects with an observed X-ray flux above erg s-1 cm-2 in the 0.5–2 keV band. This flux limit corresponds to an X-ray luminosity of erg s-1 at 111We compute all distance-dependent quantities assuming , , . The luminosities are in the 0.5–2 keV band (source rest frame). or temperature keV through the relation (Markevitch, 1998). Because of the relatively high flux threshold, our catalog does not include low-luminosity systems at , nor any clusters at very high redshifts (). Instead, it provides a representative snapshot of the population of “typical” clusters at . In this Paper, we present the 400d cluster catalog and describe the calibration of the survey’s effective area and volume through extensive Monte-Carlo simulations. We also provide updated measurements of the cluster – relation and the X-ray luminosity function.
2. X-Ray Data and Source Detection
The 400d survey is based on the ROSAT PSPC pointed observations selected from the archive by the following criteria: 1) Galactic latitude , 2) Galactic absorption cm-2, 3) total clean exposure s, and 4) targeted at least away from LMC and SMC. Several pointings were discarded because of the large optical extent of the ROSAT targets. Compared to the 160d survey, we used pointings at lower Galactic latitudes and also with shorter exposures and higher . We also included pointed observations of extended targets such as star clusters, normal galaxies, and galaxy clusters at moderate and high redshifts, if the target emission did not affect more than 50% of the area in the inner 17.5′ region; no such pointings were used in the 160d survey. The overall sample quality is not degraded by these additional data because the final catalog uses a relatively high flux threshold, erg s-1 cm-2.
S. Snowden’s software (Snowden et al., 1994) was used to clean the PSPC data from high background intervals and to generate exposure maps. Cluster detection is performed in the hard energy band, 0.6–2 keV (justified in Vikhlinin et al., 1998a). Images from multiple observations of the same target were merged, and fields with a total merged exposure time of s were discarded. The detection threshold for clusters in the s fields is erg s-1 cm-2.
The final set contains 1610 fields, including all data from the 160d survey (646 fields222The only exception is the pointing towards Arcturus which was included in the 160d survey (it contains the extended source 14151906) but discarded here because of the target’s optical brightness.) plus 964 additional fields. The exposure time distribution in the 400d and 160d surveys is shown in Fig. 1. The field center coordinates and exposure times are listed in Table 1. For each field, we defined a region affected by either X-ray or optical emission from the target (also given in Table 1) and thus unsuitable for serendipitous cluster detection. These target regions are typically 1′ circles for on-axis, point-like targets. Larger regions were used for extended targets. No such regions were defined for pointings without a declared target — those classified under “extragalactic survey” or used to complete the All-Sky Survey (ROSAT sequences rp190xxx).
Extended X-ray sources in the central 17.5′ of the field of view were detected with the 160d analysis pipeline. This algorithm (fully described in Vikhlinin et al., 1998a) is a three-step procedure which includes identification of the candidate sources through the wavelet transform, Maximum Likelihood fitting of the selected sources, and final selection based mainly on the significances of source existence and extent. The only modification we made to the 160d pipeline is to drop the requirement that the cluster core-radius exceeds of the PSF FWHM. A closer examination showed that this selection significantly decreased the detection efficiency for clusters with small angular size while most of the associated false detections can be easily identified optically. For the 160d fields, the effect of removing this criterion is to add three clusters (02095116, 13383851, 15143636) and three false detections (05223628, 10073502, 14280106).
We detected 287 extended X-ray sources with fluxes above erg s-1 cm-2, compared to 116 such sources in the 160d sample. For each source we measure its location and total X-ray flux, and also derive uncertainties on these quantities as described in Vikhlinin et al. (1998a).
| , | Target regionaaDefined by offsets from the field center and radius. | ||
|---|---|---|---|
| (J2000) | ks | , , | |
| 00 00 07.2 | 29 57 01 | 3.5 | |
| 00 02 28.8 | 31 28 47 | 14.1 | |
| 00 03 19.2 | 35 57 00 | 8.7 | 115″, 80″, 355″ |
| 00 03 21.5 | 26 03 36 | 38.2 | 30″, 15″, 50″ |
| 00 05 19.2 | 05 23 59 | 7.4 | 15″, 15″, 80″ |
Note. — The complete version of this table is in the electronic edition of the Journal. The printed edition contains only a sample.

3. Optical observations
The X-ray analysis was followed by an extensive optical program whose purpose was to confirm the cluster identifications of our extended X-ray sources, and to measure redshifts of previously unknown clusters. The identification was based on an examination of the optical images of the X-ray candidates. The images were obtained mainly with the Russian-Turkish 1.5-m telescope in the North and with the Danish 1.54-m telescope in the South. The images obtained were sufficiently deep to detect cluster member galaxies out to . We considered the X-ray source to be confirmed as a cluster if 1) there was an obvious associated excess in the galaxy number density, or 2) there was a bright elliptical galaxy at the X-ray centroid, even if it was seemingly isolated (this is a signature of so-called fossil groups, see Ponman et al., 1994; Vikhlinin et al., 1999b; Jones et al., 2003). Our cluster identifications are sufficiently reliable even though they do not use spectroscopic redshifts, because extended X-ray emission is by itself a strong indication of a cluster. The cluster identification had to be later revised only for one object (see below). We identified 266 of 287 X-ray candidates as galaxy clusters, groups, or X-ray luminous isolated ellipticals. An additional 5 objects are legitimate extended X-ray sources (e.g., nearby spiral galaxies). Only 16 objects (5% of the sample) remained unidentified; they are most likely false detections (see below). All clusters from the 160d survey with fluxes above our flux limit (116 objects) were re-confirmed in our catalog.
Spectroscopic redshifts for a significant fraction of the 400d clusters were previously known (Table 2). Redshifts for 88 clusters were measured in the 160d survey and an additional 27 clusters had known redshifts from other ROSAT and Einstein surveys: EMSS (Stocke et al., 1991, 8 objects), WARPS (Perlman et al., 2002; Ebeling et al., 2001b, 6 objects), Bright SHARC (Romer et al., 2000, 8 objects), SHARC South (Burke et al., 2003, 1 object), NEP (Gioia et al., 2003, 2 objects), and NORAS (Böhringer et al., 2000, 2 objects). The redshifts for 62 low- clusters were available from the literature and various public catalogs. The redshifts of the remaining 89 clusters were measured by us with the Keck II, ESO 3.6-m, NTT, Magellan, FLWO 1.5-m, Nordic Optical Telescope, and Danish 1.54-m telescopes (Hornstrup et al., in preparation).
| Description | Objects |
|---|---|
| Detected extended X-ray sources | 287 |
| Confirmed clusters, groups, and galaxies | 266 |
| Other extended X-ray sources | 5 |
| False detections | 16 |
| Clusters at target | 24 |
| Clusters in main sample | 242 |
| Previously known redshifts | 177 |
| Objects present in other catalogs | |
| 160d | 116 |
| EMSS | 13 |
| WARPS | 15 |
| Bright SHARC | 22 |
| SHARC South | 12 |
| NEP | 4 |
| Abell clusters | 43 |
| NGC galaxies | 10 |

The redshift distribution of the 400d sample is shown in Fig. 2. The median redshift is relatively low, , as expected, since all X-ray flux limited samples are dominated by low-luminosity systems at low redshifts. Clusters with higher X-ray luminosities are at higher redshifts on average. For example, the median redshift of clusters with erg s-1, is (dashed histogram in Fig. 2). The most distant 400d cluster is ClJ12263332 at , a system previously discovered in the WARPS survey (Ebeling et al., 2001b).
Sixteen extended X-ray sources did not have any obvious counterparts in the deep optical images. In principle, we cannot exclude that these are very distant clusters (). However, we note that a similar number of false detections is expected in our sample because of point source confusion (§ 6.3) and so the unidentified sources are most likely not clusters. To be conservative, however, one should use an upper redshift boundary of for the 400d catalog within which our sample should be essentially complete and clean.
4. The catalog
The 400d object catalog is presented in Tables 4–7. The main cluster list is given in Table 4. The clusters within of the ROSAT target redshift are listed separately in Table 5 because they are not entirely serendipitous. Extended non-cluster sources and likely false X-ray detections are listed in Tables 6 and 7, respectively. For each source we provide the coordinates of the X-ray centroid (columns 2–3; a typical positional uncertainty is 10″ – 30″), the total unabsorbed flux in the 0.5–2 keV band (column 4), the redshift (column 5) with reference (column 6), the total X-ray luminosity in the 0.5–2 keV band (column 7), and notes on the optical IDs (column 8). The X-ray luminosity was computed as described in Appendix B.
4.1. Notes on Individual Objects
01063209 — This source was detected in the EMSS and identified as a QSO at . However, this identification is ambiguous (Stocke et al., 1984) because the QSO is projected on a foreground elliptical galaxy. ROSAT PSPC data clearly show that the X-ray source is extended, and that a point source at its center cannot contribute more than 10–30% of the total flux. Therefore we identify this object as a galaxy group, a conclusion that is confirmed by a Chandra observation of this field (Hardcastle et al., 2002).
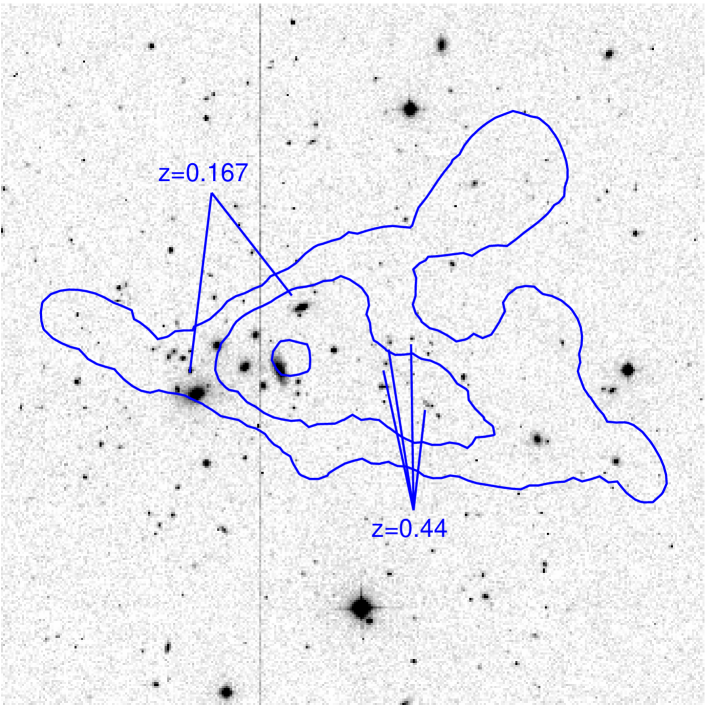
01413034 — A cluster near the X-ray centroid is projected on the galaxy group AM 0139–305 (). Each object is associated with a separate X-ray peak (Fig. 3). The fluxes of these systems cannot be deblended using the ROSAT data. We estimate that the foreground group can contribute up to 30% of the total X-ray flux.
03503801 — The aspect solution for this ROSAT observation (sequence rp190505n00) was incorrect (systematically shifted to the South–West). We reconstructed the aspect solution by cross-correlating locations of bright X-ray sources in this field with their locations in the overlapping pointings. After this correction, the extended X-ray source is unambiguously identified as a galaxy cluster at .
08092811 — This object was detected in the EMSS (MS 0806.6+2820) and classified as an AGN at . The optical AGN is located 0.6′ from the ROSAT centroid. The source is significantly extended in the ROSAT PSPC image, and there is no point source near the AGN location. We instead identify this source as a cluster at .
10026858 — This object was identified as a QSO in the EMSS (MS 0958.4+6913, ). In the ROSAT data, we detect both the point source associated with the QSO and extended X-ray emission centered 0.9′ off the QSO. This object is therefore classified as a cluster. The QSO flux was correctly subtracted by our automatic detection software.
11421027 — We revise the Bright SHARC identification of this object as A 1356 (Romer et al., 2000). A 1356 is not detected in the ROSAT image. Instead, the extended X-ray source is associated with a more distant galaxy group.
13383851 — The galaxy near the center of this source is a radio source, 3C 288. The X-ray source extent is significant but we cannot exclude the possibility of considerable contamination by AGN emission.
15002244 — This object is a false detection, based on a recent Chandra observation.
5. Comparison with other X-ray surveys
The 400d fields overlap with those covered by several earlier surveys. A comparison of our catalog with those from these previous studies, provided below, helps to assess any systematic errors in the X-ray cluster selection, optical identifications, and X-ray flux measurements.
EMSS
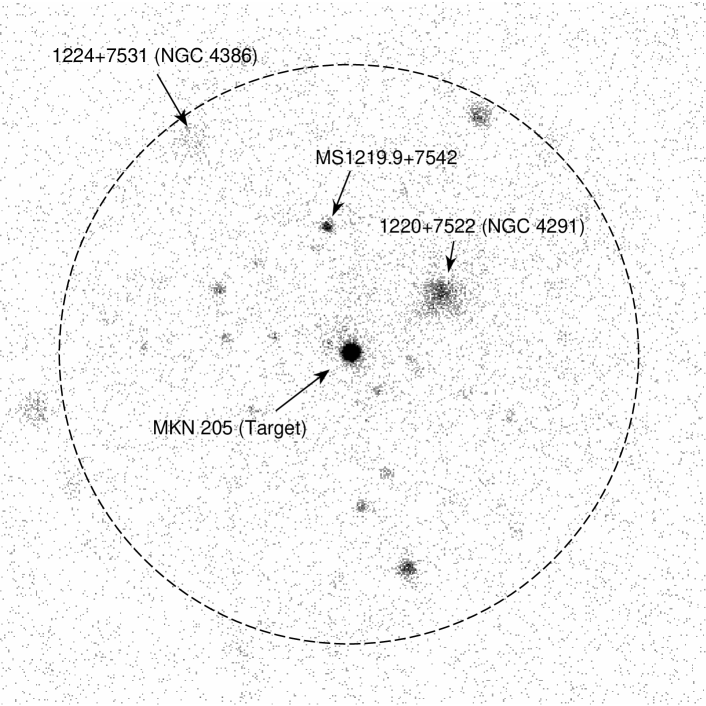
The angular resolution of the Einstein IPC is (Giacconi et al., 1979), which is larger than the angular core-radius of most of the distant clusters. The inability to rely on the X-ray source extent sometimes leads to incorrect identifications. ROSAT data clearly show that, of 16 clusters in common between the 400d and EMSS samples, 3 were incorrectly identified with AGNs (01063209, 08092811, and 10026858, see § 4.1), and the fossil group 11595531 (Vikhlinin et al., 1999b) was classified as a galaxy with weak emission lines. The area covered by the 400d survey contains 13 EMSS clusters, of which we detect 10. MS1019.0+5139, MS1209.0+3917, and MS1219.9+7542 are not included in our catalog because these sources were not recognized as extended. Examination of the ROSAT data confirms that their fluxes are dominated by emission from point X-ray sources (see, e.g., Fig. 4 for MS1219.9+7542).
WARPS
The detection algorithm used in the WARPS survey (Scharf et al., 1997) essentially selects X-ray candidates by peak surface brightness, with only a weak reliance on the angular extent. This detection algorithm is very different from ours and therefore the comparison with WARPS is particularly useful for assessing the systematics of the X-ray selection. Our survey includes 74 of 80 ROSAT PSPC fields used in WARPS. In this area, the WARPS catalog includes 14 clusters and one normal galaxy above our flux limit. We detected all these objects. For two objects, we measure a lower X-ray flux ( erg s-1 cm-2) so they are not included in our main catalog. All 15 of our clusters in the overlapping area were also detected by WARPS. We conclude that there is no difference in the source lists and possibly a small difference in the flux measurements, which are not statistical since virtually the same data were used, as is the case also with Bright SHARC and SHARC South.
Bright SHARC
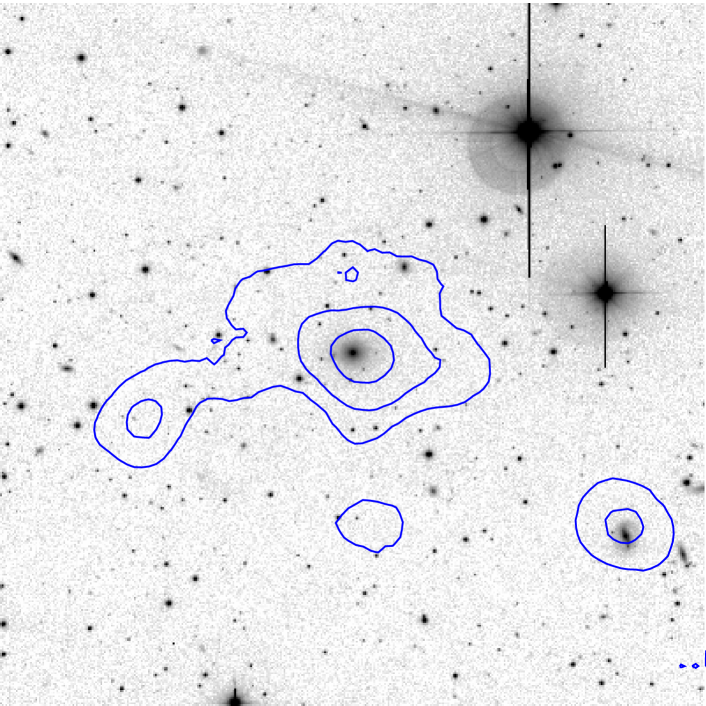
The detection algorithm used in the Bright SHARC survey (Romer et al., 2000) is based on the wavelet analysis at a single angular scale. The Bright SHARC catalog contains 32 clusters in the area covered by 400d, all above our flux limit. Our catalog includes 26 of these objects. Of the remaining 6 objects, RXJ0209.41008, RXJ0415.75535, RXJ0416.15546, RXJ1250.42530, and RXJ1349.20712 were in fact the observation targets, and RXJ1222.17526 (MS1219.9+7542) is not extended (Fig. 4). The 400d catalog contains 78 clusters in the overlapping area, of which only 26 are listed in Bright SHARC. The 400d cluster 13133250 was detected (RXJ1313.63250) but classified as a “blend”. ROSAT and optical images, however, support our cluster identification (Fig. 5). Obviously, there are large differences between the Bright SHARC and 400d samples in the overlapping data. We attribute this mostly to the X-ray detection algorithm used in Bright SHARC. This is well illustrated by the comparison of the distributions of cluster fluxes and core-radii in the two surveys (Fig. 6). Obviously, Bright SHARC tends to miss clusters with either large () or small () angular extent.

SHARC South
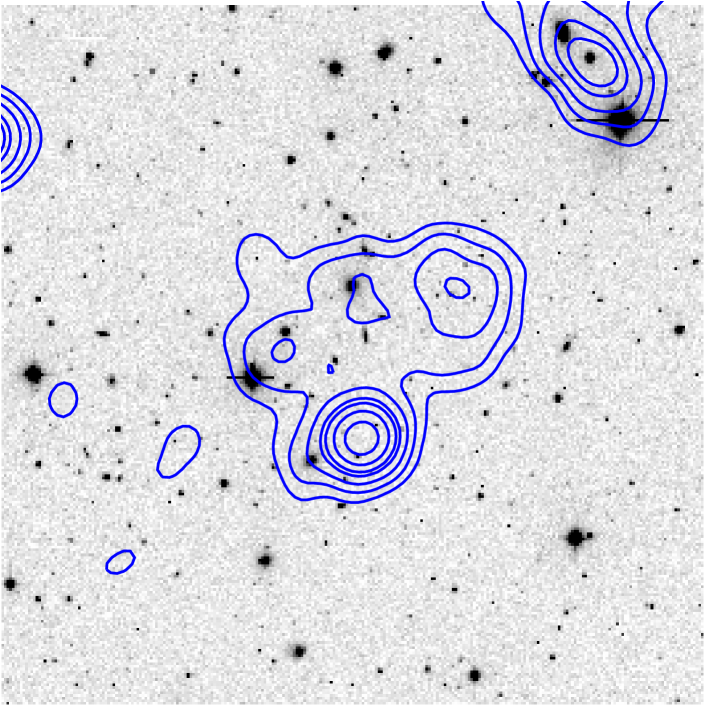
Our survey used 61 of 66 ROSAT pointings used in the SHARC South survey (Burke et al., 2003). In these fields, we detect 15 clusters with off-axis angles (the inner radius used by Burke et al.). All 15 objects were detected in SHARC South but 3 were not optically identified as clusters: 12522920 and 23053545 were listed as unidentified, and third object, 05062840, was listed as “multiple point sources”. Inspection of the ROSAT image (Fig. 7) shows that there is both a point source (correctly detected in 400d) and an extended X-ray source, clearly associated with a galaxy group. All of the SHARC South clusters above our flux limit are included in the 400d sample. To summarize, SHARC South and our survey have nearly identical X-ray source lists and the difference is in the optical identifications.
NEP
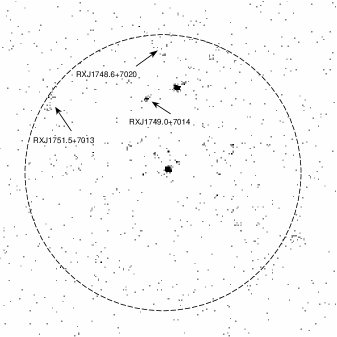
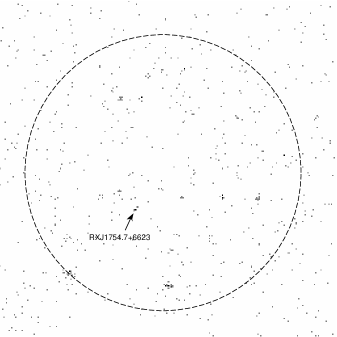
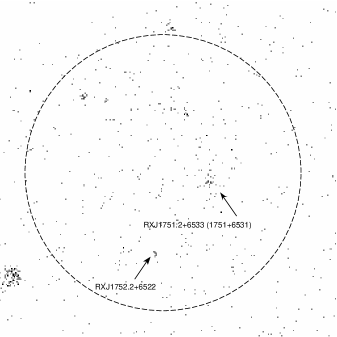
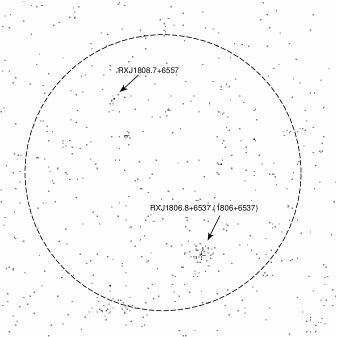
The North Ecliptic Pole (NEP) survey (Henry et al., 2001; Gioia et al., 2003) includes sources in the high-exposure region of the ROSAT All-Sky Survey. The nominal detection threshold of the NEP survey is below our flux limit. The advantage of NEP is a large contiguous area (81 deg2) with fairly uniform X-ray data. The disadvantage for cluster detection is the poor angular resolution, (Boese, 2000), which complicated the determination of the spatial extent of detected sources. The total overlap between the 400d and NEP surveys is deg2, where we detect 6 clusters of which 4 are also listed in the NEP catalog. Our clusters 17466848 and 18076946 were missed by the NEP probably because of the presence of bright point X-ray sources in their vicinity. There are 13 NEP clusters in the overlapping region, of which we do not detect 8: five appear point-like (Fig. 8), while 3 have fluxes which are too faint for the pointed observations.
Comparison of our cluster list with the overlapping data from other X-ray surveys generally shows good agreement between the catalogs and thus demonstrates robustness of the X-ray cluster selection. In cases where a disagreement is found the cause is not related to the X-ray or optical analysis in the 400d sample. Most of the discrepancies can be traced to errors in the optical identifications, and therefore the role of optical data in the cluster selection should be minimized. The misclassification rate in the NEP and EMSS surveys is relatively high by modern standards. This underscores the need for X-ray telescopes with adequate angular resolution in implementing efficient distant cluster surveys. Robust X-ray analysis techniques applied to such surveys can provide high-quality cluster samples.
6. Statistical calibration of the X-ray detection algorithm
The X-ray detection procedure of the 400d survey was extensively calibrated. Our approach is similar to that used in the 160d survey (Vikhlinin et al., 1998a). It is based on Monte-Carlo simulations which provide the probability of detecting clusters with given X-ray flux and size, the bias and scatter in the X-ray flux measurements, and the expected number of false detections. We also studied more subtle effects, e.g., how the cluster detectability is affected by substructure in the ICM, or by the presence of central X-ray surface brightness peaks as well as intracluster point sources.
The cluster detectability depends on the observation exposure, the object off-axis distance, the proximity to other sources, and more weakly on secondary effects such as the Galactic absorption and the level of diffuse X-ray background in the field. To properly treat all these effects, we performed simulations in which clusters with different input parameters were placed at random in the real ROSAT images. The simulated data were then run through the complete X-ray analysis pipeline. All statistical properties of the 400d survey are obtained from comparison of the measured properties and input parameters for the simulated clusters.
The input clusters in the majority of the simulations were represented by the elliptical -models (see Appendix B for details) but more complicated cases were also considered (§ 7.1.1). Input values for fluxes and core radii were selected on a grid spanning the range erg s-1 cm-2 and . Simulated clusters were placed in randomly chosen survey fields and randomly positioned within the central 18.5′ of the field. This radius is larger than the maximum off-axis angle for detected clusters, . This allows us to properly treat edge effects but results in detection probabilities even for very bright objects. In total, we simulated 1,500,000 clusters.
6.1. Detection Probability
The derived probability of cluster detection as a function of flux and core radius is shown in Fig. 9. The probability is normalized to the ratio of input and nominal survey areas (see above) to remove the trivial geometric effects. As expected, the detection probability is nearly 1 for high-flux clusters and decreases at lower primarily because faint clusters are not detected in lower exposure fields. The detection probability for erg scm-2, the 400d catalog flux limit, exceeds 0.5 in a large range of angular core-radii.
At a fixed flux, the detection probability peaks in the core-radius range . The probability decreases at large because very extended clusters have a lower ratio of the source and background flux and hence a lower detection significance. The detection probability is small for compact clusters, , because such clusters are more difficult to distinguish from the point sources in the off-axis regions of the field of view (the PSF size changes from 25″ FVWM on-axis to 60″ at an off-axis distance of 17.5′). We note that the detection probability is a much stronger function of X-ray flux than of angular size. In fact, the probability is non-negligible even for very compact clusters, . Such objects can still be identified as extended sources because their surface brightness profiles have power-law wings unlike the PSF.
The core radius range within which our detection algorithm is sensitive, 10″–100″, matches well the typical sizes of high-redshift clusters. For example, this corresponds to a range of 60–600 kpc at . This range compares well with the observed core radii for X-ray luminous clusters which have the median kpc and are distributed in the range 70–350 kpc at both (Jones & Forman, 1999) and (Vikhlinin et al., 1998b). Even at , an angular size of 10″ corresponds to a physical radius of 80 kpc, which is near the lower boundary of the observed core-radius distribution.

6.2. Bias and Scatter in the Flux Measurements
Figure 10 shows the average bias and scatter in the flux measurements for detected clusters of different angular size. There is no significant bias at fluxes erg s-1 cm-2, except for where the measured are biased low because the local background is overestimated. This effect is strong only at low redshifts. For example, the largest core radius in the Jones & Forman (1999) sample is kpc, corresponding to an angular size of at . Fluxes of faint clusters are systematically overestimated which is a typical example of Malmquist bias. This problem is confined to the flux range below the limiting flux of our catalog.


Our simulations provide also the shape of the distribution. The knowledge of this distribution is required, e.g., for accurate calculations of the survey area or volume for clusters near our flux limit. An example of the flux scatter distribution derived from the simulations is shown in Fig. 11. The scatter distribution can be approximated by a log-normal function (dotted line). However, there is no need to use this approximation because the distribution is sampled sufficiently accurately except for the extreme upper and lower tails.
6.3. False Detections
As mentioned above, the 400d catalog contains 16 unidentified sources. They are most likely false X-ray detections arising from confusion of point sources. We identified most such cases through deep optical imaging (§ 3). However, it is useful to estimate the false detection rate independently from the optical data, to make sure that we are not missing a new interesting class of sources (e.g. clusters at very high redshift). Our approach is identical to that used for the 160d survey. We simulated ROSAT PSPC images containing only point sources and the diffuse background. The source fluxes were derived from the observed – relation (Hasinger et al., 1993) and their locations were chosen either randomly or according to the angular correlation function from Vikhlinin & Forman (1995). The resulting images correctly reproduce the fluxes and spatial distribution of detectable sources as well as the background fluctuations caused by undetected sources.

All extended sources detected in these simulations are false by design. The distributions of their fluxes and sizes are shown in Fig. 12 and 13. The total number of unidentified sources in the 400d catalog (16) is consistent with the number of false detections expected for randomly distributed point sources (18.6). It is smaller than, but marginally consistent with, 27.1 false detections expected for correlated point sources. We note that the angular correlation amplitude measured by Vikhlinin & Forman (1995) for point sources with erg s-1 cm-2 is not necessarily directly applicable in the flux range of sources mostly responsible for false detections in the 400d sample, erg s-1 cm-2. The distributions of fluxes and radii for unidentified sources and false detection also match very well (Fig. 13). Given the good agreement in the number and properties of unidentified 400d sources and false detections in the simulations, we conclude that the unidentified sources are most likely not clusters.

6.4. Effects of Point Sources Near Cluster Centers
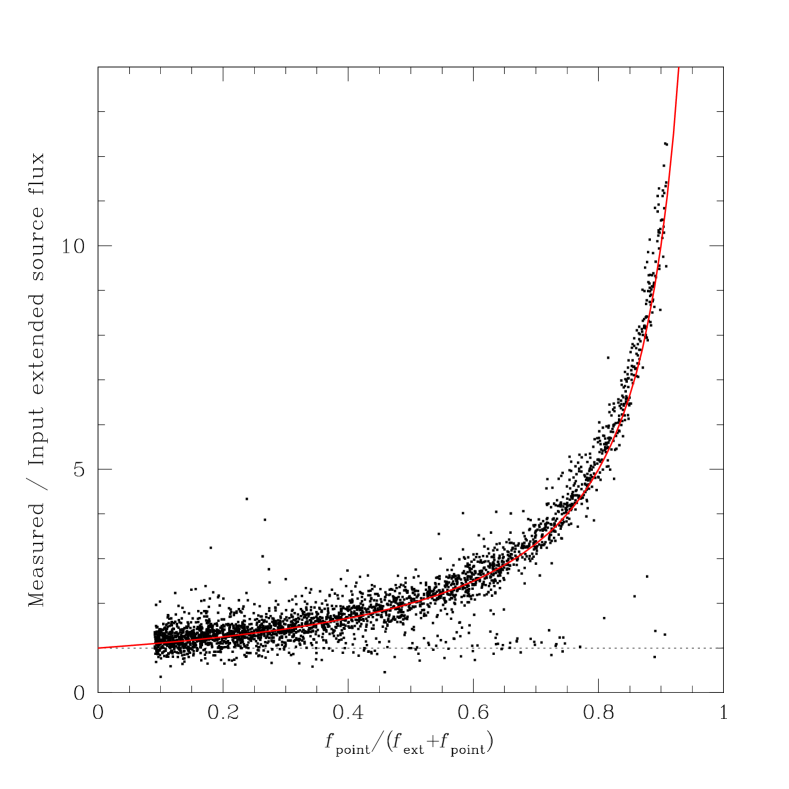
In some low-redshift clusters there are X-ray bright AGNs associated with the central cluster galaxies (Crawford & Fabian, 2003). The X-ray luminosity of the central AGN is typically much lower than that of the host cluster. However, the AGN fraction as well as their typical X-ray luminosities can increase at high redshift. Our analysis software does not attempt to subtract the contribution of point sources near the center (within FWHM of the PSF) from the cluster flux. This is a deliberate decision to avoid that the peaked X-ray emission from the cluster cooling cores is misinterpreted as the signature of a central AGN. Also, deblending of the central AGNs is an ill-posed problem in general because the angular size of high-redshift clusters is close to the PSF width. The effect of central point sources is twofold. First, they increase the source detectability but decrease our ability to identify it as extended. Second, the cluster flux is biased high if the point source emission is not subtracted. These effects were studied through additional Monte-Carlo simulations.
First, we note that our main simulations already include the effects associated with the chance projection of background sources. Also, individually detectable point sources are automatically removed from the cluster flux if they are located outside the central region (e.g., Fig.7). Therefore, we consider here only sources located within the cluster core radius. The simulations proceed as usual but we place point sources of various flux on top of input -model clusters. Point sources were placed either at the center of the -model (to simulate AGNs in central galaxies of relaxed clusters) or randomly distributed within a circle (to simulate AGNs in non-central galaxies or merging clusters).
Figure 14 shows the effect of central point sources on the detection probability for clusters with fluxes near our catalog threshold ( erg s-1 cm-2). The curves show the detection probability as a function of the ratio . The average detection probability for clusters without central sources is shown by the horizontal line. The detection probability decreases significantly only for (i.e., the point source is more luminous than the host cluster). Even though the detection probability is affected weakly, the measured flux is always strongly biased (Fig.15). We measure essentially , except in a small number of cases when our algorithm enters the deblending mode and is correctly recovered.

To summarize, the presence of X-ray bright central AGNs should not affect the catalog completeness unless the AGN luminosities exceed those of the host clusters, erg s-1 at . However, the ROSAT X-ray fluxes can be overestimated in such cases. Chandra observations of our distant clusters will help to assess the importance of this effect.
7. Using the Survey Statistical Calibration
The most general way to fit models of the cluster population to the 400d data is through the detection probability and flux measurement scatter functions derived above. The predicted “response” of the 400d survey to clusters with a distribution of fluxes and sizes is
| (1) |
where is the measured flux, is the detection probability, and is the scatter in the flux measurement as a function of true flux and size. The function is used to compute the likelihood given the number of actually observed clusters. However, it is useful also to have simpler functions such as the sky coverage or the survey volume as a function of cluster luminosity. Below, we demonstrate how such functions can be computed and used for non-parametric derivations of the cluster distribution or the X-ray luminosity function.
| , | ||||
|---|---|---|---|---|
| (erg s-1 cm-2) | ||||
| 1.0 | 1.1 | 1.2 | 1.1 | |
| 4.5 | 4.8 | 4.7 | 4.7 | |
| 13.5 | 14.6 | 15.0 | 14.9 | |
| 20.3 | 21.7 | 21.6 | 21.8 | |
| 32.7 | 34.2 | 33.9 | 34.3 | |
| 51.0 | 52.2 | 51.4 | 52.2 | |
| 76.0 | 77.3 | 76.2 | 77.6 | |
| 108.6 | 109.0 | 108.1 | 109.8 | |
| 145.3 | 143.0 | 142.2 | 146.0 | |
| 177.6 | 172.5 | 173.2 | 177.9 | |
| 207.5 | 201.7 | 203.6 | 208.4 | |
| 230.1 | 222.6 | 226.8 | 231.7 | |
| 248.2 | 240.5 | 245.8 | 250.2 | |
| 278.8 | 270.7 | 278.1 | 281.1 | |
| 313.6 | 303.6 | 314.4 | 315.9 | |
| 340.6 | 333.4 | 342.7 | 342.7 | |
| 366.0 | 364.0 | 368.8 | 367.0 | |
| 378.9 | 379.7 | 382.5 | 380.1 | |
| 384.2 | 388.9 | 390.7 | 388.3 | |
| 388.9 | 395.4 | 394.9 | 392.4 | |
Note. — The table lists effective sky coverage (in units of deg2) of the 400d catalog as a function of true cluster flux. The coverage is the product of the selection probability (§ 7.1) and geometric survey area, deg2. Column 2 gives the area averaged over all redshifts (eq.4) and columns 3–5 give more accurate averages for clusters at , 0.5, and 0.8 (eq.3).
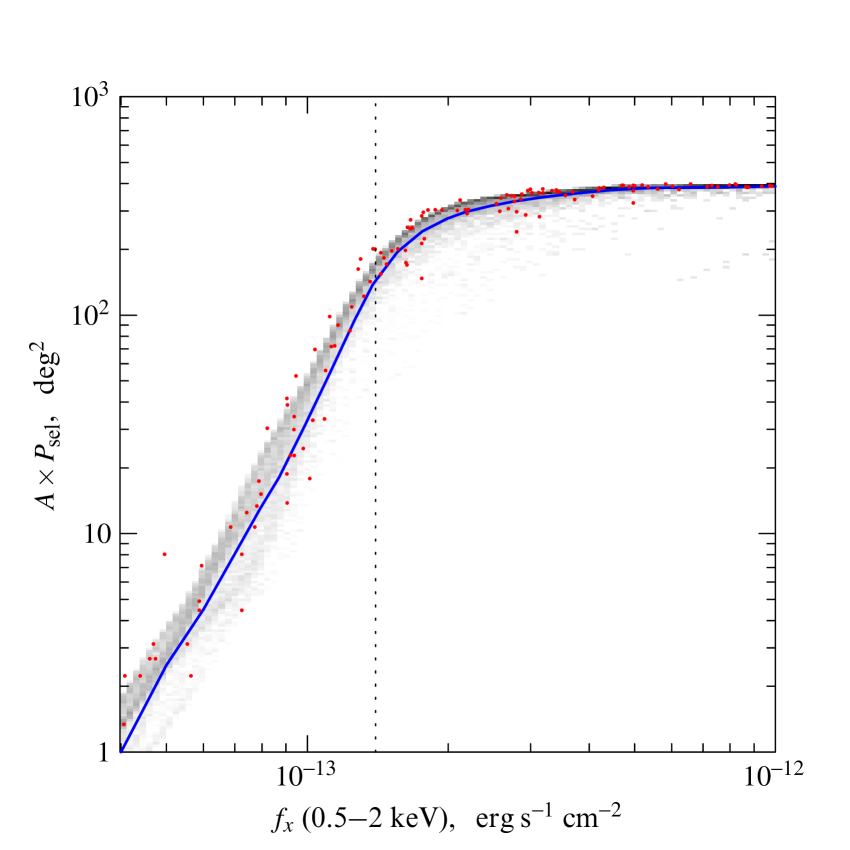
7.1. Efficiency of Selection to 400d Catalog
The 400d catalog includes only clusters with a measured flux above erg s-1 cm-2, i.e. we discard objects with fainter fluxes even if they pass the detection significance criteria. The probability for a cluster to be selected in the catalog can be computed as
| (2) |
where is the minimum flux required for the cluster selection ( erg s-1 cm-2 for the main 400d catalog, or a higher value if the probability is computed for a brighter subsample). Note that is different from the detection efficiency .
In practice, and are weak functions of in the plausible range of angular sizes of distant clusters. This allows us to eliminate the -dependence by averaging eq.(2) with a realistic distribution of core radii333We use the measurements by Jones & Forman (1999), see Appendix B., :
| (3) |
The -dependence in eq.(3) arises because the X-ray analysis depends on the angular, not proper size. A further simplification is to use a realistic model for the cluster distribution as a function of flux and 444Such a distribution can be computed using a model for the X-ray luminosity function, see Appendix B and average over :
| (4) |
The probabilities in eq.(2), (3), and (4), multiplied by the geometric area of the 400d survey, give (in the decreasing order of accuracy) the effective sky coverage of the 400d catalog as a function of true flux. The calculations for our reference cluster population model (Appendix B) are shown in Fig.16 and tabulated in Table 3.
7.1.1 Sensitivity to the Cluster Population Models
The calculation of the cluster selection probability (eq. 3, 4) in principle depends on the exact form of the core-radius distribution and also on the luminosity function and its evolution. However, these dependencies are weak as shown below.
Figure 17 shows the relative deviations of (eq.4) calculated with different models of the cluster X-ray luminosity function (XLF) and core-radius distribution. The top panel demonstrates the sensitivity to the assumed evolution of the XLF (this affects the -distribution of clusters with given X-ray flux and hence their angular core-radii). changes by less than in the full range of the XLF evolution models consistent with the Mullis et al. (2004) measurements. is slightly more sensitive to the assumed distribution of core radii (bottom panel in Fig.17). For example, if the average core radius for distant clusters is scaled by factors 1.3 and 0.77 relative to the non-evolving Jones & Forman (1999) distribution, decreases by 3%. Such an evolution of the average core radius is inconsistent with observations (Vikhlinin et al., 1998b).

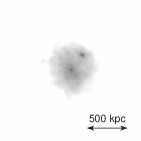
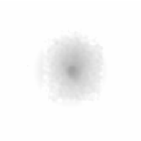
All the cases considered in Fig.17 still assume that the cluster emission follows elliptical -models. What if we consider a more realistic range of cluster structures, from peaked cooling cores to strong mergers? To check this, we used a complete flux-limited sample of 38 clusters ( erg s-1 cm-2) in the redshift range from the HIFLUGCS catalog (Reiprich & Böhringer, 2002). The minimum luminosity in this sample of low-redshift clusters approximately corresponds to the 400d sensitivity limit at . These clusters show a wide range of morphologies and represent an unbiased (with respect to structure) snapshot of the local population (Fig.18). Template images created from ROSAT and Chandra observations of these clusters (shown in Fig.18) were used in the simulations instead of the elliptical -models. Each cluster was put at , 0.45, 0.55, and . We scaled the templates in flux and angular size according to the distance to these redshifts but kept the X-ray luminosity and physical size of each cluster constant. Constant luminosity corresponds to a weakly X-ray luminosity function, approximately as observed (Mullis et al., 2004). Constant size corresponds approximately to a non-evolving scale radius in the Navarro, Frenk & White model (Navarro et al., 1997) of the total mass density profile, as is indeed expected (Bullock et al., 2001).
Each cluster leaves a track in the plot when its redshift is varied. The combined results for all clusters are shown by points in Fig.16. There is a very good agreement with the calculations using -model clusters from our reference model. We conclude that the deviations of the cluster X-ray morphologies from the -model do not play a significant role in the 400d survey selection functions.
7.2. Cluster .
If the fluxes of all clusters were measured precisely, the could be computed using from eq.(4),
| (5) |
where is the X-ray flux of individual detected clusters and is the geometric survey area. However, because of the flux measurement errors, the estimated by eq.(5) will be biased (Eddington bias, Eddington, 1940). Kenter & Murray (2003) discuss how to reconstruct the true function by fitting an analytic model to the distribution of measured object fluxes. However, it is also useful to reconstruct the true non-parametrically. A possible approach (Vikhlinin et al., 1998a) is to define the effective sky coverage as a ratio of differential for detected and input sources from a realistic input population (e.g. a power law with Euclidean slope). This ratio is usually insensitive to the exact form of the input population and therefore can be used for non-parametric reconstruction. The corresponding calculation follows from eq.(1):
| (6) |
where is the reference cluster population model (Appendix B). The cluster is then estimated as
| (7) |
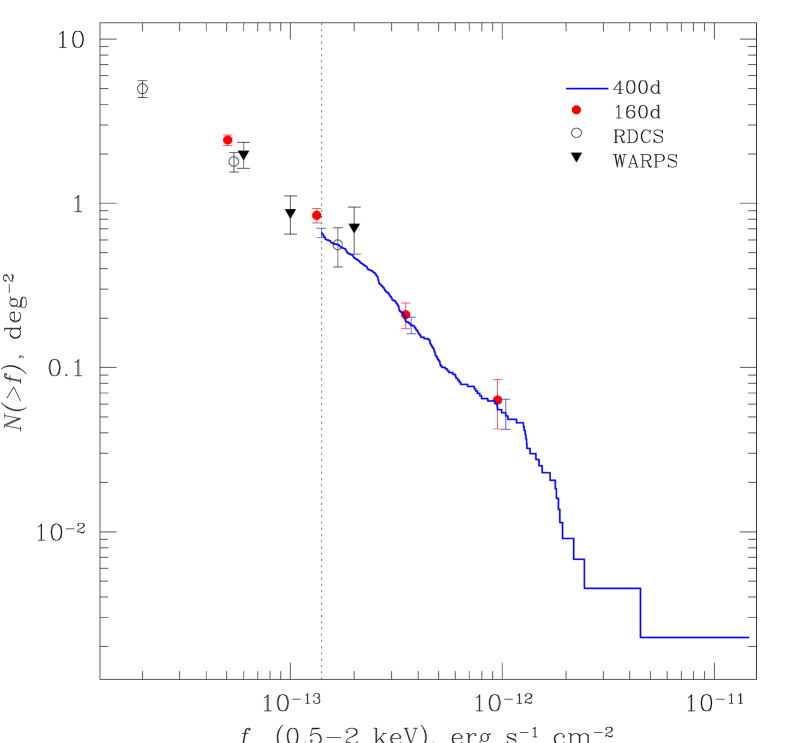
The results are shown in Fig.19 in comparison with several earlier surveys. There is very good agreement in the overlapping flux range. Note a marginal deficit of very bright clusters, erg s-1 cm-2, in our sample relative to a power law extrapolation from fainter fluxes. This might be related to the fact that many of the high-flux clusters were previously known and used as targets for ROSAT pointings. However, this deficit is marginal. The observed distribution is in fact consistent with a single power law throughout our flux range, where and per square degree.
7.3. Survey Volume and X-ray Luminosity Function
The area calculations discussed in §§ 7.1 and 7.2 are straightforwardly generalized for computations of the search volume. For example, the comoving search volume for clusters with true luminosity in the redshift interval is
| (8) |
where is the cosmological comoving volume per redshift interval and is given by eq.(3). The flux and luminosity in eq.(8) are related through eq.(B2) in Appendix B. In Fig.20, we show the volume covered by the 400d survey out to redshift , for three representative X-ray luminosities, , , and erg s-1. Note that the volume for luminous clusters, erg s-1at high redshifts exceeds the volume typically covered by the catalogs based on the ROSAT All-Sky Survey.
The effective volume as a function of measured X-ray luminosity, including first-order corrections for the Eddington bias (see § 7.2), is given by expressions
| (9) |
| (10) |
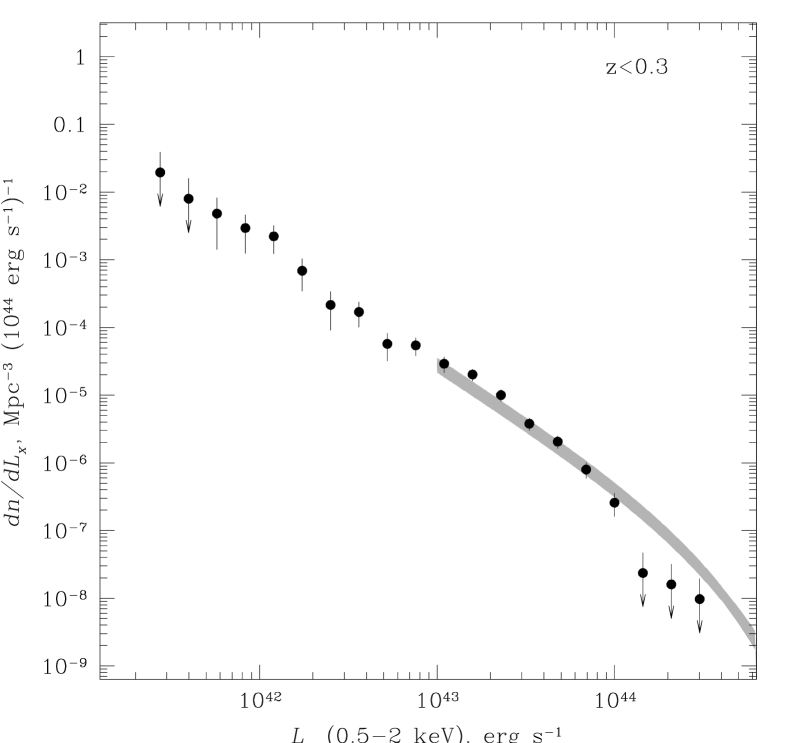
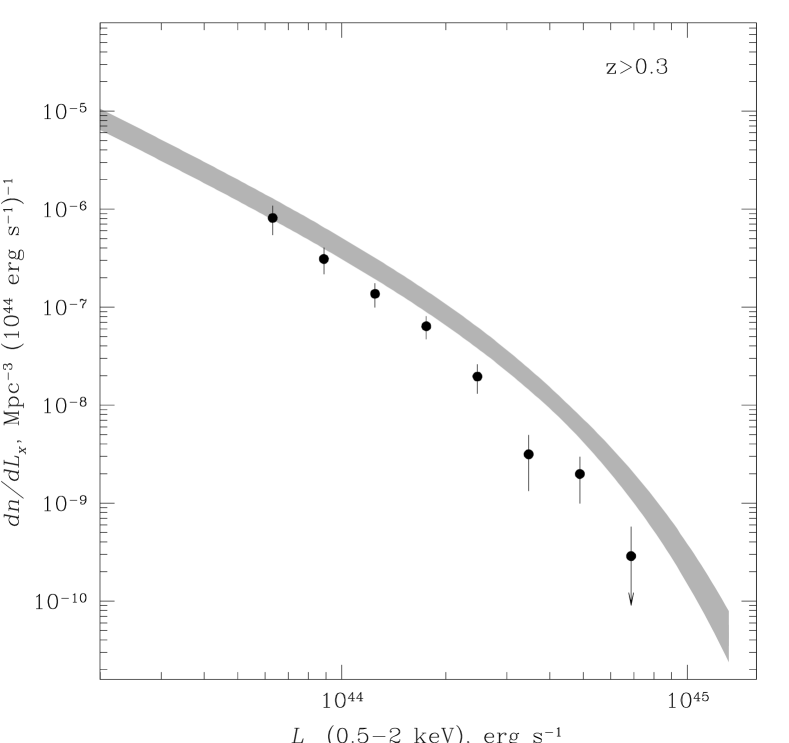
This effective volume can be used for non-parametric estimation of the X-ray luminosity function from the 400d data, shown in Fig. 21 and 22 for the and subsamples, respectively. For comparison, we also show the low- XLF from the REFLEX sample (Böhringer et al., 2002)555Other measurements based on the ROSAT All-Sky Survey, such as those from the BCS (Ebeling et al., 1997) or RASS1 Bright (de Grandi et al., 1999) catalogs, are consistent with the REFLEX result within the statistical uncertainties. We have chosen REFLEX because the XLF parameters are reported for the cosmology adopted here. which is in very good agreement with our results, thus providing an independent proof that our flux measurements, calculations of the sky coverage etc., are accurate.

At (Fig. 22), our XLF clearly shows negative evolution at high compared with the low-redshift XLF. For example, the local XLF predicts that the 400d should contain 116 clusters with erg s-1at while we found only 47 such objects ( significance). The evolution is weaker for low-luminosity clusters; the total number of the erg s-1, clusters in our sample is 17 while the non-evolving XLF predicts 29.5. Our XLF results are fully consistent with the earlier studies by Henry et al. (1992), Rosati et al. (1998), Vikhlinin et al. (1998b), Jones et al. (1998), Gioia et al. (2001), Mullis et al. (2004) but the evolution is measured with a much higher statistical significance because of the larger survey area.
To provide a quantitative characterization of the XLF evolution, we follow the approach of Rosati et al. (2002) and Mullis et al. (2004) to fit the data with the evolving Schechter (1976) model, , where the normalization and characteristic luminosity are power-law functions of ,
| (11) |
The best-fit parameters obtained with the Maximum Likelihood approach Cash (1979) are and .
8. Chandra observations of 400d clusters
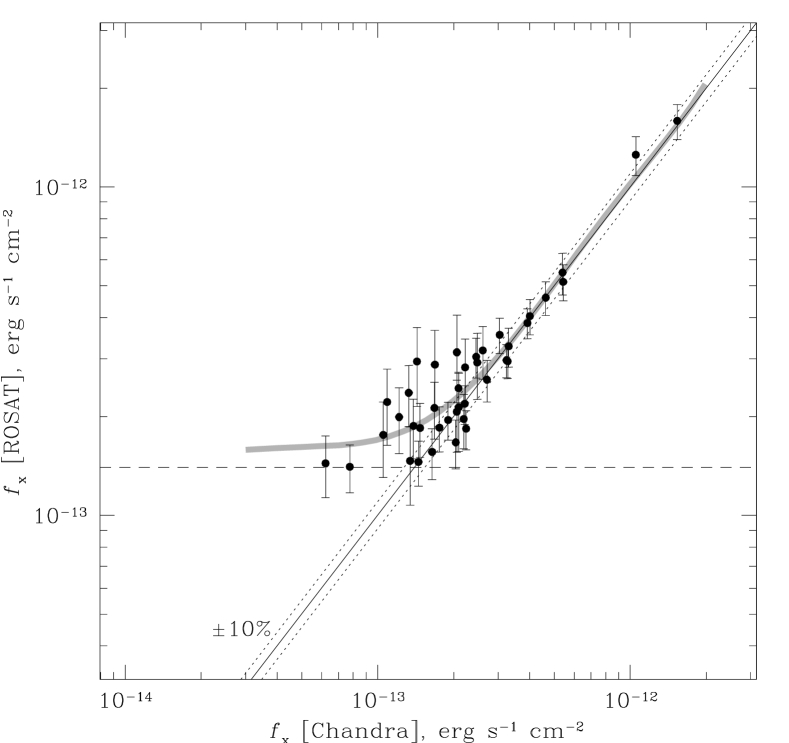
A complete sample of high-redshift clusters from the 400d survey was observed by Chandra (PIs L. Van Speybroeck, S. S. Murray, A. Vikhlinin). Here, we use preliminary Chandra results to cross-check our X-ray flux estimates from the ROSAT data. Due to sufficiently long exposures, Chandra traced the cluster surface brightness to larger radii and thus provided accurate total fluxes without the need to rely on -model fits. Figure 23 shows a comparison of Chandra fluxes with the ROSAT estimates. The horizontal line shows the flux limit of the 400d catalog. By design, all ROSAT fluxes are forced to be above this line, which leads to a significant bias at low . Using the statistical calibrations described in § 6, we can predict this bias. Specifically, the average measured flux for clusters with true flux is (cf. eq.2 and 3)
| (12) |
where erg s-1 cm-2. The predicted flux bias computed from eq.(12) is shown by the thick gray line in Fig.23. It agrees very well with the actually observed bias at erg s-1 cm-2. At higher fluxes, where one expects no selection biases, the Chandra and ROSAT fluxes agree to better than 10%: the average observed ratio is . The comparison of our ROSAT-derived fluxes with the accurate Chandra measurements thus demonstrates the validity of the 400d statistical calibration and our cluster flux measurements procedure.
9. Summary
We present a catalog of galaxy clusters detected in a new, 400 square degrees ROSAT PSPC survey. The survey uses the central 17.5′ region of 1610 individual pointings to high Galactic latitude targets, essentially all ROSAT PSPC data suitable for detection of high-redshift clusters. The X-ray analysis algorithm is adopted from that in the 160d survey Vikhlinin et al. (1998a) with minimal modifications. The 400d catalog includes 266 optically confirmed galaxy clusters, groups and individual elliptical galaxies with flux erg scm-2 in 0.5–2 keV energy band. This sample is selected out of 287 candidate extended X-ray sources; the success rate of the X-ray selection is therefore very high, 93%. Redshifts of all clusters have been measured through optical spectroscopy (see Hornstrup et al., in preparation).
The statistical properties of the 400d sample have been carefully calibrated by extensive Monte-Carlo simulations. We provide the essential quantities, such as the cluster detection probability as a function of flux and size, and describe how to use them for calculations of the sky coverage or search volume in the given redshift interval. We also study the sensitivity of the statistical calibration to details of the cluster population models (e.g., the presence of the central X-ray brightness cusps caused by the radiative cooling). These analyses show that systematic uncertainties in the final area and volume calculations are within 5%, smaller than the Poisson uncertainties in our sample.
Our low- X-ray luminosity function agrees very well with the results from the ROSAT All-Sky Survey. At , the X-ray luminosity function shows negative evolution significant at .
High-redshift clusters from the 400d catalog have been observed by Chandra. We will use these data to derive cosmological constraints (Vikhlinin et al., in preparation). Relevant to the present work is the comparison of the ROSAT-derived fluxes with the accurate values provided by the Chandra data. This comparison demonstrates the validity of the 400d statistical calibration and our cluster flux measurements procedure.
Machine-readable tables of our cluster catalog and associated calibration data are also published on the WWW pages http://hea.iki.rssi.ru/400d and http://hea-www.harvard.edu/400d.
References
- Abazajian et al. (2005) Abazajian, K., et al. 2005, AJ, 129, 1755
- Abell et al. (1989) Abell, G. O., Corwin, Jr., H. G., & Olowin, R. P. 1989, ApJS, 70, 1
- Appenzeller et al. (1998) Appenzeller, I., et al. 1998, ApJS, 117, 319
- Battye & Weller (2003) Battye, R. A. & Weller, J. 2003, Phys. Rev. D, 68, 083506
- Batuski et al. (1999) Batuski, D. J., Miller, C. J., Slinglend, K. A., Balkowski, C., Maurogordato, S., Cayatte, V., Felenbok, P., & Olowin, R. 1999, ApJ, 520, 491
- Bernardi et al. (2002) Bernardi, M., Alonso, M. V., da Costa, L. N., Willmer, C. N. A., Wegner, G., Pellegrini, P. S., Rité, C., & Maia, M. A. G. 2002, AJ, 123, 2990
- Binggeli et al. (1993) Binggeli, B., Popescu, C. C., & Tammann, G. A. 1993, A&AS, 98, 275
- Binggeli et al. (1985) Binggeli, B., Sandage, A., & Tammann, G. A. 1985, AJ, 90, 1681
- Boese (2000) Boese, F. G. 2000, A&AS, 141, 507
- Böhringer et al. (2000) Böhringer, H., et al. 2000, ApJS, 129, 435
- Böhringer et al. (2002) Böhringer, H., et al. 2002, ApJ, 566, 93
- Bullock et al. (2001) Bullock, J. S., Kolatt, T. S., Sigad, Y., Somerville, R. S., Kravtsov, A. V., Klypin, A. A., Primack, J. R., & Dekel, A. 2001, MNRAS, 321, 559
- Burke et al. (2003) Burke, D. J., Collins, C. A., Sharples, R. M., Romer, A. K., & Nichol, R. C. 2003, MNRAS, 341, 1093
- Cappi et al. (1998) Cappi, A., Held, E. V., & Marano, B. 1998, A&AS, 129, 31
- Cash (1979) Cash, W. 1979, ApJ, 228, 939
- Colless et al. (2001) Colless, M., et al. 2001, MNRAS, 328, 1039
- Crawford & Fabian (2003) Crawford, C. S. & Fabian, A. C. 2003, MNRAS, 339, 1163
- da Costa et al. (1991) da Costa, L. N., Pellegrini, P. S., Davis, M., Meiksin, A., Sargent, W. L. W., & Tonry, J. L. 1991, ApJS, 75, 935
- da Costa et al. (1998) da Costa, L. N., et al. 1998, AJ, 116, 1
- de Grandi et al. (1999) de Grandi, S., et al. 1999, ApJ, 513, L17
- de Vaucouleurs et al. (1991) de Vaucouleurs, G., de Vaucouleurs, A., Corwin, Jr., H. G., Buta, R. J., Paturel, G., & Fouque, P. 1991, S&T, 82, 621
- Denicoló et al. (2005) Denicoló, G., Terlevich, R., Terlevich, E., Forbes, D. A., Terlevich, A., & Carrasco, L. 2005, MNRAS, 356, 1440
- Ebeling et al. (1997) Ebeling, H., Edge, A. C., Fabian, A. C., Allen, S. W., Crawford, C. S., & Boehringer, H. 1997, ApJ, 479, L101
- Ebeling et al. (2001a) Ebeling, H., Edge, A. C., & Henry, J. P. 2001a, ApJ, 553, 668
- Ebeling et al. (2001b) Ebeling, H., Jones, L. R., Fairley, B. W., Perlman, E., Scharf, C., & Horner, D. 2001b, ApJ, 548, L23
- Eddington (1940) Eddington, Sir, A. S. 1940, MNRAS, 100, 354
- Eke et al. (1998) Eke, V. R., Cole, S., Frenk, C. S., & Patrick Henry, J. 1998, MNRAS, 298, 1145
- Evrard (1989) Evrard, A. E. 1989, ApJ, 341, L71
- Falco et al. (1999) Falco, E. E., et al. 1999, PASP, 111, 438
- Fukazawa et al. (1998) Fukazawa, Y., Makishima, K., Tamura, T., Ezawa, H., Xu, H., Ikebe, Y., Kikuchi, K., & Ohashi, T. 1998, 50, 187
- Giacconi et al. (1979) Giacconi, R., et al. 1979, ApJ, 230, 540
- Gioia et al. (1990a) Gioia, I. M., Henry, J. P., Maccacaro, T., Morris, S. L., Stocke, J. T., & Wolter, A. 1990a, ApJ, 356, L35
- Gioia et al. (2003) Gioia, I. M., Henry, J. P., Mullis, C. R., Böhringer, H., Briel, U. G., Voges, W., & Huchra, J. P. 2003, ApJS, 149, 29
- Gioia et al. (2001) Gioia, I. M., Henry, J. P., Mullis, C. R., Voges, W., Briel, U. G., Böhringer, H., & Huchra, J. P. 2001, ApJ, 553, L105
- Gioia et al. (1990b) Gioia, I. M., Maccacaro, T., Schild, R. E., Wolter, A., Stocke, J. T., Morris, S. L., & Henry, J. P. 1990b, ApJS, 72, 567
- Haiman et al. (2001) Haiman, Z., Mohr, J. J., & Holder, G. P. 2001, ApJ, 553, 545
- Hardcastle et al. (2002) Hardcastle, M. J., Worrall, D. M., Birkinshaw, M., Laing, R. A., & Bridle, A. H. 2002, MNRAS, 334, 182
- Hasinger et al. (1993) Hasinger, G., Burg, R., Giacconi, R., Hartner, G., Schmidt, M., Trumper, J., & Zamorani, G. 1993, A&A, 275, 1
- Henry (1997) Henry, J. P. 1997, ApJ, 489, L1
- Henry (2000) Henry, J. P. 2000, ApJ, 534, 565
- Henry et al. (1992) Henry, J. P., Gioia, I. M., Maccacaro, T., Morris, S. L., Stocke, J. T., & Wolter, A. 1992, ApJ, 386, 408
- Henry et al. (2001) Henry, J. P., Gioia, I. M., Mullis, C. R., Voges, W., Briel, U. G., Böhringer, H., & Huchra, J. P. 2001, ApJ, 553, L109
- Hewitt & Burbidge (1991) Hewitt, A. & Burbidge, G. 1991, ApJS, 75, 297
- Hu & Cohn (2006) Hu, W. & Cohn, J. D. 2006, Phys. Rev. D, 73, 067301
- Huchra et al. (1990) Huchra, J. P., Geller, M. J., de Lapparent, V., & Corwin, Jr., H. G. 1990, ApJS, 72, 433
- Huchra et al. (1999) Huchra, J. P., Vogeley, M. S., & Geller, M. J. 1999, ApJS, 121, 287
- Huterer & Turner (2001) Huterer, D. & Turner, M. S. 2001, Phys. Rev. D, 64, 123527
- Jones & Forman (1999) Jones, C. & Forman, W. 1999, ApJ, 511, 65
- Jones et al. (2003) Jones, L. R., Ponman, T. J., Horton, A., Babul, A., Ebeling, H., & Burke, D. J. 2003, MNRAS, 343, 627
- Jones et al. (1998) Jones, L. R., Scharf, C., Ebeling, H., Perlman, E., Wegner, G., Malkan, M., & Horner, D. 1998, ApJ, 495, 100
- Katgert et al. (1998) Katgert, P., Mazure, A., den Hartog, R., Adami, C., Biviano, A., & Perea, J. 1998, A&AS, 129, 399
- Keel (1996) Keel, W. C. 1996, ApJS, 106, 27
- Kenter & Murray (2003) Kenter, A. T. & Murray, S. S. 2003, ApJ, 584, 1016
- Kochanek et al. (2001) Kochanek, C. S., et al. 2001, ApJ, 560, 566
- Lucey et al. (1983) Lucey, J. R., Dickens, R. J., Mitchell, R. J., & Dawe, J. A. 1983, MNRAS, 203, 545
- Mahdavi & Geller (2004) Mahdavi, A. & Geller, M. J. 2004, ApJ, 607, 202
- Markevitch (1998) Markevitch, M. 1998, ApJ, 504, 27
- Mason et al. (2000) Mason, K. O., et al. 2000, MNRAS, 311, 456
- Miller et al. (2002) Miller, C. J., Krughoff, K. S., Batuski, D. J., & Hill, J. M. 2002, AJ, 124, 1918
- Miller et al. (2004) Miller, N. A., Owen, F. N., Hill, J. M., Keel, W. C., Ledlow, M. J., & Oegerle, W. R. 2004, ApJ, 613, 841
- Mohr et al. (1995) Mohr, J. J., Evrard, A. E., Fabricant, D. G., & Geller, M. J. 1995, ApJ, 447, 8
- Molnar et al. (2004) Molnar, S. M., Haiman, Z., Birkinshaw, M., & Mushotzky, R. F. 2004, ApJ, 601, 22
- Molthagen et al. (1997) Molthagen, K., Wendker, H. J., & Briel, U. G. 1997, A&AS, 126, 509
- Moretti et al. (2004) Moretti, A., et al. 2004, A&A, 428, 21
- Mullis et al. (2003) Mullis, C. R., et al. 2003, ApJ, 594, 154
- Mullis et al. (2004) Mullis, C. R., et al. 2004, ApJ, 607, 175
- Navarro et al. (1997) Navarro, J. F., Frenk, C. S., & White, S. D. M. 1997, ApJ, 490, 493
- Nesci & Altamore (1990) Nesci, R. & Altamore, A. 1990, A&A, 234, 60
- Oukbir & Blanchard (1992) Oukbir, J. & Blanchard, A. 1992, A&A, 262, L21
- Owen et al. (1995) Owen, F. N., Ledlow, M. J., & Keel, W. C. 1995, AJ, 109, 14
- Perlman et al. (2002) Perlman, E. S., Horner, D. J., Jones, L. R., Scharf, C. A., Ebeling, H., Wegner, G., & Malkan, M. 2002, ApJS, 140, 265
- Peterson (1978) Peterson, B. M. 1978, ApJ, 223, 740
- Ponman et al. (1994) Ponman, T. J., Allan, D. J., Jones, L. R., Merrifield, M., McHardy, I. M., Lehto, H. J., & Luppino, G. A. 1994, Nature, 369, 462
- Reiprich & Böhringer (2002) Reiprich, T. H. & Böhringer, H. 2002, ApJ, 567, 716
- Rines et al. (2003) Rines, K., Geller, M. J., Kurtz, M. J., & Diaferio, A. 2003, AJ, 126, 2152
- Romer et al. (2000) Romer, A. K., et al. 2000, ApJS, 126, 209
- Rosati et al. (2002) Rosati, P., Borgani, S., & Norman, C. 2002, ARA&A, 40, 539
- Rosati et al. (1995) Rosati, P., della Ceca, R., Burg, R., Norman, C., & Giacconi, R. 1995, ApJ, 445, L11
- Rosati et al. (1998) Rosati, P., della Ceca, R., Norman, C., & Giacconi, R. 1998, ApJ, 492, L21
- Scharf et al. (1997) Scharf, C. A., Jones, L. R., Ebeling, H., Perlman, E., Malkan, M., & Wegner, G. 1997, ApJ, 477, 79
- Schechter (1976) Schechter, P. 1976, ApJ, 203, 297
- Schuecker et al. (2003) Schuecker, P., Böhringer, H., Collins, C. A., & Guzzo, L. 2003, A&A, 398, 867
- Simien & Prugniel (2000) Simien, F. & Prugniel, P. 2000, A&AS, 145, 263
- Smith et al. (2000) Smith, R. J., Lucey, J. R., Hudson, M. J., Schlegel, D. J., & Davies, R. L. 2000, MNRAS, 313, 469
- Snowden et al. (1994) Snowden, S. L., McCammon, D., Burrows, D. N., & Mendenhall, J. A. 1994, ApJ, 424, 714
- Starobinsky (1998) Starobinsky, A. A. 1998, JETP Lett., 68, 721
- Stocke et al. (1984) Stocke, J. T., Liebert, J., Schild, R., Gioia, I. M., & Maccacaro, T. 1984, ApJ, 277, 43
- Stocke et al. (1991) Stocke, J. T., Morris, S. L., Gioia, I. M., Maccacaro, T., Schild, R., Wolter, A., Fleming, T. A., & Henry, J. P. 1991, ApJS, 76, 813
- Struble & Rood (1999) Struble, M. F. & Rood, H. J. 1999, ApJS, 125, 35
- Viana et al. (2003) Viana, P. T. P., Kay, S. T., Liddle, A. R., Muanwong, O., & Thomas, P. A. 2003, MNRAS, 346, 319
- Viana & Liddle (1996) Viana, P. T. P. & Liddle, A. R. 1996, MNRAS, 281, 323
- Viana & Liddle (1999) Viana, P. T. P. & Liddle, A. R. 1999, MNRAS, 303, 535
- Vikhlinin & Forman (1995) Vikhlinin, A. & Forman, W. 1995, ApJ, 455, L109
- Vikhlinin et al. (1999a) Vikhlinin, A., Forman, W., & Jones, C. 1999a, ApJ, 525, 47
- Vikhlinin et al. (1998a) Vikhlinin, A., McNamara, B. R., Forman, W., Jones, C., Quintana, H., & Hornstrup, A. 1998a, ApJ, 502, 558
- Vikhlinin et al. (1998b) Vikhlinin, A., McNamara, B. R., Forman, W., Jones, C., Quintana, H., & Hornstrup, A. 1998b, ApJ, 498, L21
- Vikhlinin et al. (1999b) Vikhlinin, A., McNamara, B. R., Hornstrup, A., Quintana, H., Forman, W., Jones, C., & Way, M. 1999b, ApJ, 520, L1
- Vikhlinin et al. (2002) Vikhlinin, A., VanSpeybroeck, L., Markevitch, M., Forman, W. R., & Grego, L. 2002, ApJ, 578, L107
- Vikhlinin et al. (2003) Vikhlinin, A., et al. 2003, ApJ, 590, 15
- Voevodkin & Vikhlinin (2004) Voevodkin, A. & Vikhlinin, A. 2004, ApJ, 601, 610
- Wang & Steinhardt (1998) Wang, L. & Steinhardt, P. J. 1998, ApJ, 508, 483
- Wegner et al. (1999) Wegner, G., Colless, M., Saglia, R. P., McMahan, R. K., Davies, R. L., Burstein, D., & Baggley, G. 1999, MNRAS, 305, 259
- Wegner et al. (2003) Wegner, G., et al. 2003, AJ, 126, 2268
- White et al. (1993) White, S. D. M., Efstathiou, G., & Frenk, C. S. 1993, MNRAS, 262, 1023
Appendix A Summary of notations
For quick reference, we provide a summary of notations used throughout the paper.
— core-radius of the -model; in calculations of the survey area and volumes, it is assumed to be in units of angular size;
, — true cluster flux in the 0.5–2 keV band;
— measured flux in the 0.5–2 keV band;
— the probability for the cluster to be detected and identified as extended X-ray source (§ 6.1);
— the probability for the detected cluster to have measured flux (§ 6.2);
— the probability that the cluster is detected and has above the 400d catalog selection threshold (§ 7.1);
— number density of clusters at redshift as a function of true observed flux and angular size;
— geometric area of the survey (intersection of the 18.5′ circles centered on individual pointings, minus the target regions);
— effective sky coverage as a function of measured flux (§ 7.2);
— comoving search volume for clusters with true luminosity (§ 7.3);
— effective comoving search volume as a function of measured luminosity (§ 7.3);
Appendix B Reference model of the cluster population
The calculation of essential quantities such as the survey area or volume involves averaging of the detection probabilities over the expected distribution of cluster sizes and fluxes (§ 7). For this, we use the reference model which assumes a non-evolving population of -model clusters with the distribution of structural parameters and the X-ray luminosity function fixed by detailed observations of the low-redshift objects, as detailed below.

The distribution of cluster core radii is taken from the Einstein sample of Jones & Forman (1999). The use of Jones & Forman sample is justified by the fact that nearby clusters at were observed by Einstein approximately with the same proper-size resolution as ROSAT distant clusters at . The average core radius in the Jones & Forman sample shows a trend with the cluster luminosity which can be approximated as for erg s-1 and constant average at higher luminosities. We corrected individual measurements in the Jones & Forman sample by this trend to obtain the master distribution of shown in Fig. 24. The distribution for any luminosity is obtained by scaling the master distribution by the trend of average with . The distribution of -parameters is also adopted from Jones & Forman (1999), with one modification. The Jones & Forman distribution contains objects with and even . Such low values are unrealistic (e.g., the total flux diverges for ). They are artifacts of fitting a single -model to the cluster with cool cores and are in fact not found if the cores are excluded from the fit (Vikhlinin et al., 1999a). For our work, the relevant slope is that at large radii (it affects the total flux estimates). Therefore, we truncated the Jones & Forman distribution at . Finally, our -models are elliptical with the distribution of axis ratios from Mohr et al. (1995).
Our adopted X-ray luminosity function is the Schechter (1976) fit to the REFLEX survey data (Böhringer et al., 2002),
| (B1) |
with and erg s-1 (we use the Mullis et al., 2004, conversion of to the 0.5–2 keV band). The REFLEX XLF is consistent with other ROSAT All-Sky Survey measurements (Ebeling et al., 1997; de Grandi et al., 1999). We use the REFLEX results because they are reported for our adopted cosmology.
To compute the survey area and search volume, we need the distribution of clusters as a function of observed flux, not the rest-frame luminosity (see § 7.1 and 7.3). This can be obtained from the luminosity function through an obvious relation,
| (B2) |
where is the cosmological luminosity distance and is the -correction factor that describes redshifting of the source spectrum. The -correction can be easily computed for any given source spectrum (see, e.g., Jones et al., 1998, specifically for the case of the cluster X-ray spectra). The -correction in principle depends on the temperature and, more weakly, on the metallicity of the ICM. The temperature can be estimated from the correlation with the accuracy sufficient for this purpose. We use a non-evolving relation that follows the Markevitch (1998) measurements for the high- clusters and the Fukazawa et al. (1998) data for low-mass clusters and groups. It is now established that the relation in fact evolves (Vikhlinin et al., 2002). However, this does not affect the luminosity-to-flux conversion because the evolution is not strong and the -correction is a weak function of temperature in the high- regime (see, e.g., Fig.7 in Jones et al., 1998).
| Num. | R.A. | Dec. | , | ref. | , | Note | |
|---|---|---|---|---|---|---|---|
| (J2000) | cgs | erg s-1 | |||||
| (1) | (2) | (3) | (4) | (5) | (6) | (7) | (8) |
| 1 | 00:29:50.6 | 13:30:14 | 3.14 0.78 | 0.251 | |||
| 2 | 00:30:33.6 | 26:18:16 | 2.44 0.29 | 0.500 | 1 | VMF 001 | |
| 3 | 00:45:18.8 | 29:24:02 | 3.41 0.49 | 0.257 | |||
| 4 | 00:50:59.3 | 09:29:14 | 3.66 0.50 | 0.199 | 1 | VMF 003 | |
| 5 | 00:56:03.5 | 37:32:43 | 14.92 1.53 | 0.163 | 2 | ||
| 6 | 00:56:55.0 | 22:13:51 | 2.48 0.45 | 0.116 | 1 | VMF 005 | |
| 7 | 00:57:24.7 | 26:16:50 | 18.60 2.23 | 0.113 | 3 | VMF 007, A 0122 | |
| 8 | 01:06:59.0 | 32:09:30 | 4.53 0.52 | 0.112 | 4 | § 4.1 | |
| 9 | 01:13:11.0 | 28:28:16 | 3.99 0.97 | 0.262 | |||
| 10 | 01:16:39.7 | 03:30:11 | 3.22 0.46 | 0.0810 | 5 | ||
| 11 | 01:22:36.0 | 28:32:05 | 2.69 0.61 | 0.256 | 1 | VMF 010, A S0154 | |
| 12 | 01:24:48.1 | 09:32:29 | 3.87 0.46 | 0.0079 | 6 | NGC 0524 | |
| 13 | 01:26:54.5 | 19:12:42 | 1.49 0.43 | 0.0427 | 7 | IC 0115, A 0195 | |
| 14 | 01:32:54.6 | 42:59:46 | 3.25 0.81 | 0.0876 | 1 | VMF 014 | |
| 15 | 01:39:53.7 | 18:10:07 | 2.73 0.36 | 0.176 | 3 | VMF 017, A 0227 | |
| 16 | 01:41:32.3 | 30:34:42 | 3.14 0.94 | 0.442 | § 4.1 | ||
| 17 | 01:42:50.6 | 20:25:13 | 2.61 0.52 | 0.271 | 1 | VMF 018 | |
| 18 | 01:52:41.3 | 13:58:13 | 1.84 0.25 | 0.833 | 8 | ||
| 19 | 01:54:12.5 | 59:37:33 | 1.45 0.36 | 0.360 | 1 | VMF 020 | |
| 20 | 01:59:18.2 | 00:30:09 | 3.27 0.45 | 0.386 | 1 | VMF 021 | |
| 21 | 02:06:49.9 | 13:09:09 | 2.61 0.49 | 0.321 | 1 | VMF 023 | |
| 22 | 02:09:52.8 | 51:16:19 | 1.72 0.66 | 0.206 | |||
| 23 | 02:16:33.7 | 17:47:27 | 1.40 0.23 | 0.578 | 8 | ||
| 24 | 02:23:28.2 | 08:52:12 | 2.53 0.34 | 0.163 | 9 | ||
| 25 | 02:28:13.5 | 10:05:45 | 2.43 0.37 | 0.149 | 1 | VMF 026 | |
| 26 | 02:28:22.6 | 23:25:23 | 2.59 0.56 | 0.305 | |||
| 27 | 02:30:26.6 | 18:36:22 | 2.21 0.58 | 0.799 | |||
| 28 | 02:37:59.6 | 52:24:47 | 7.33 0.79 | 0.136 | 10 | VMF 028, A 3038 | |
| 29 | 02:45:45.7 | 09:36:36 | 6.33 2.05 | 0.147 | |||
| 30 | 02:50:03.6 | 19:07:51 | 2.59 0.39 | 0.122 | 8 | ||
| 31 | 02:51:17.8 | 20:55:46 | 2.62 0.55 | 0.325 | |||
| 32 | 02:59:33.8 | 00:13:45 | 3.24 0.56 | 0.194 | 1 | VMF 031 | |
| 33 | 03:02:21.3 | 04:23:29 | 15.89 1.95 | 0.350 | |||
| 34 | 03:04:24.7 | 07:02:13 | 2.59 0.67 | 0.135 | 11 | ||
| 35 | 03:06:28.7 | 09:43:50 | 10.40 1.24 | 0.0342 | 12 | IC 1880 | |
| 36 | 03:07:04.7 | 06:28:51 | 5.99 0.82 | 0.347 | 11 | ||
| 37 | 03:18:33.4 | 03:02:56 | 4.60 0.54 | 0.370 | 9 | ||
| 38 | 03:20:18.1 | 42:59:13 | 2.99 0.67 | 0.158 | |||
| 39 | 03:20:37.8 | 43:11:52 | 2.62 0.67 | 0.149 | A S0343 | ||
| 40 | 03:22:59.4 | 13:38:15 | 2.06 0.68 | 0.334 | |||
| 41 | 03:23:59.5 | 19:16:34 | 3.26 0.74 | 0.332 | |||
| 42 | 03:27:54.5 | 02:33:47 | 9.41 1.00 | 0.0302 | 14 | UGC 02748 | |
| 43 | 03:28:36.1 | 21:40:04 | 2.14 0.57 | 0.590 | |||
| 44 | 03:32:13.5 | 29:10:39 | 4.83 0.71 | 0.150 | 15 | ||
| 45 | 03:33:10.2 | 24:56:41 | 2.36 0.50 | 0.475 | |||
| 46 | 03:34:03.7 | 39:00:49 | 6.43 0.71 | 0.0623 | 3 | A 3135 | |
| 47 | 03:36:49.4 | 28:04:53 | 9.46 1.67 | 0.105 | 3 | A 3141 | |
| 48 | 03:38:11.8 | 22:56:24 | 1.73 0.23 | 0.173 | |||
| 49 | 03:39:24.3 | 33:13:09 | 3.46 0.88 | 0.269 | A 3150 | ||
| 50 | 03:40:27.2 | 28:40:20 | 17.77 3.44 | 0.0680 | 3 | A 3151 | |
| 51 | 03:40:51.6 | 28:23:10 | 3.18 0.58 | 0.346 | |||
| 52 | 03:48:22.4 | 33:28:33 | 10.38 1.48 | 0.165 | 16 | A 3169 | |
| 53 | 03:50:43.9 | 38:01:25 | 2.88 0.78 | 0.363 | § 4.1 | ||
| 54 | 03:54:34.6 | 42:33:33 | 2.05 0.55 | 0.224 | |||
| 55 | 03:54:35.4 | 37:45:20 | 19.72 2.59 | 0.251 | A 3184 | ||
| 56 | 03:55:29.9 | 36:34:03 | 10.84 1.83 | 0.320 | 17 | A S0400, MS 0353.6-3642 | |
| 57 | 03:55:59.3 | 37:41:46 | 2.92 0.67 | 0.473 | |||
| 58 | 04:05:24.3 | 41:00:15 | 1.54 0.37 | 0.686 | |||
| 59 | 04:17:25.8 | 45:12:28 | 4.88 1.05 | 0.213 | 15 | A 3240 | |
| 60 | 04:21:03.5 | 46:29:34 | 3.51 0.84 | 0.131 | A 3247 | ||
| 61 | 04:22:28.8 | 50:09:01 | 4.00 1.18 | 0.0901 | |||
| 62 | 04:28:42.4 | 38:05:47 | 2.08 0.55 | 0.154 | 3 | VMF 036, A 3259 | |
| 63 | 04:46:38.0 | 04:21:02 | 7.71 0.88 | 0.177 | |||
| 64 | 04:58:55.1 | 00:29:21 | 24.84 2.61 | 0.0150 | 18 | NGC 1713 | |
| 65 | 05:05:58.2 | 28:26:02 | 1.41 0.21 | 0.131 | 1 | VMF 038 | |
| 66 | 05:06:04.0 | 28:40:50 | 1.97 0.41 | 0.136 | 1 | VMF 039 | |
| 67 | 05:09:43.4 | 08:36:41 | 1.98 0.26 | 0.125 | |||
| 68 | 05:21:10.5 | 25:30:36 | 1.76 0.45 | 0.581 | 1 | VMF 040 | |
| 69 | 05:22:13.8 | 36:24:49 | 1.84 0.34 | 0.472 | 1 | VMF 041 | |
| 70 | 05:28:40.1 | 32:51:29 | 1.99 0.25 | 0.273 | 1 | VMF 042 | |
| 71 | 05:32:41.8 | 46:14:17 | 4.11 0.43 | 0.135 | 1 | VMF 044 | |
| 72 | 05:33:53.1 | 57:46:45 | 1.70 0.62 | 0.297 | 1 | VMF 045 | |
| 73 | 05:42:50.8 | 41:00:05 | 2.19 0.29 | 0.642 | |||
| 74 | 05:44:13.3 | 25:55:40 | 1.55 0.33 | 0.260 | foreground A 0548 | ||
| 75 | 06:10:32.0 | 48:48:26 | 2.49 0.28 | 0.243 | |||
| 76 | 06:34:34.1 | 62:26:46 | 2.77 0.76 | 0.270 | |||
| 77 | 06:35:28.4 | 62:34:06 | 3.92 0.84 | 0.157 | a part of A 3398 | ||
| 78 | 07:20:17.7 | 71:32:11 | 1.48 0.22 | 0.268 | 19 | ||
| 79 | 07:20:53.7 | 71:08:57 | 1.82 0.24 | 0.230 | 19 | ||
| 80 | 08:09:41.0 | 28:11:58 | 5.49 0.80 | 0.399 | § 4.1 | ||
| 81 | 08:10:24.2 | 42:16:19 | 23.89 2.63 | 0.0640 | 1 | VMF 047 | |
| 82 | 08:19:54.7 | 56:34:39 | 3.08 0.52 | 0.260 | 1 | VMF 050 | |
| 83 | 08:20:26.6 | 56:45:27 | 2.29 0.48 | 0.0429 | 1 | VMF 051 | |
| 84 | 08:38:31.3 | 19:48:17 | 5.25 1.34 | 0.123 | |||
| 85 | 08:41:07.4 | 64:22:41 | 2.91 0.32 | 0.343 | 1 | VMF 056 | |
| 86 | 08:49:11.4 | 37:31:23 | 1.46 0.27 | 0.240 | 1 | VMF 062, a part of A 0708 | |
| 87 | 08:52:32.9 | 16:18:07 | 3.71 0.68 | 0.0980 | 1 | VMF 063 | |
| 88 | 08:53:13.4 | 57:59:44 | 1.99 0.45 | 0.475 | 1 | VMF 064 | |
| 89 | 09:00:04.7 | 39:20:24 | 3.48 0.68 | 0.0951 | |||
| 90 | 09:07:20.0 | 16:39:25 | 14.87 1.66 | 0.0756 | 20 | VMF 068, A 0744 | |
| 91 | 09:10:16.1 | 60:12:17 | 1.42 0.35 | 0.181 | a part of A 0742 | ||
| 92 | 09:21:13.2 | 45:28:44 | 2.39 0.43 | 0.315 | 1 | VMF 070 | |
| 93 | 09:26:36.6 | 12:42:59 | 1.67 0.28 | 0.489 | 1 | VMF 071 | |
| 94 | 09:43:32.4 | 16:40:02 | 2.31 0.36 | 0.256 | 1 | VMF 073 | |
| 95 | 09:43:45.0 | 16:44:13 | 2.12 0.47 | 0.180 | 1 | VMF 074 | |
| 96 | 09:50:07.7 | 70:33:58 | 3.20 0.54 | 0.210 | |||
| 97 | 09:53:36.0 | 70:54:29 | 9.07 1.32 | 0.185 | A 0875 | ||
| 98 | 09:53:44.6 | 69:47:29 | 1.60 0.20 | 0.214 | |||
| 99 | 09:56:02.8 | 41:07:08 | 1.56 0.28 | 0.587 | 1 | VMF 079 | |
| 100 | 09:58:13.0 | 55:16:06 | 4.82 0.88 | 0.214 | 1 | VMF 081, A 0899 | |
| 101 | 09:58:19.3 | 47:02:17 | 2.82 0.62 | 0.390 | 21 | ||
| 102 | 10:02:07.7 | 68:58:48 | 1.97 0.37 | 0.500 | § 4.1 | ||
| 103 | 10:03:04.5 | 32:53:36 | 3.55 0.44 | 0.416 | 22 | ||
| 104 | 10:03:06.6 | 19:25:47 | 2.77 0.46 | 0.243 | |||
| 105 | 10:07:08.4 | 20:31:26 | 1.43 0.44 | 0.105 | |||
| 106 | 10:10:15.8 | 54:30:12 | 2.11 0.30 | 0.0450 | 1 | VMF 084 | |
| 107 | 10:11:25.4 | 54:50:06 | 2.00 0.52 | 0.294 | 1 | VMF 086 | |
| 108 | 10:13:27.8 | 01:36:42 | 2.28 0.55 | 0.276 | |||
| 109 | 10:13:36.9 | 49:33:05 | 4.40 1.05 | 0.133 | 1 | VMF 087 | |
| 110 | 10:18:00.9 | 21:54:35 | 2.32 0.42 | 0.240 | |||
| 111 | 10:27:10.7 | 39:08:06 | 4.63 0.56 | 0.338 | |||
| 112 | 10:33:51.9 | 57:03:11 | 1.45 0.37 | 0.0463 | 1 | VMF 089 | |
| 113 | 10:36:11.3 | 57:13:31 | 1.88 0.41 | 0.203 | 1 | VMF 090 | |
| 114 | 10:38:01.8 | 41:46:38 | 2.71 0.42 | 0.125 | 23 | A 1056 | |
| 115 | 10:39:31.3 | 39:47:38 | 1.92 0.46 | 0.0926 | |||
| 116 | 10:42:24.3 | 00:08:16 | 3.44 0.47 | 0.139 | 24 | ||
| 117 | 10:48:00.6 | 11:24:11 | 1.85 0.37 | 0.0650 | 1 | VMF 091 | |
| 118 | 10:58:12.6 | 01:36:57 | 13.00 1.82 | 0.0385 | 25 | VMF 095, a part of A 1139 | |
| 119 | 11:10:04.5 | 29:57:06 | 1.71 0.31 | 0.200 | |||
| 120 | 11:16:54.7 | 18:03:20 | 6.23 0.79 | 0.0032 | 26 | NGC 3607 | |
| 121 | 11:17:30.1 | 17:44:45 | 1.44 0.31 | 0.547 | 1 | VMF 098 | |
| 122 | 11:20:07.6 | 43:18:07 | 2.97 0.34 | 0.600 | 9 | ||
| 123 | 11:20:58.3 | 23:26:34 | 2.12 0.42 | 0.562 | 1 | VMF 100 | |
| 124 | 11:23:10.6 | 14:09:40 | 1.82 0.42 | 0.340 | 1 | VMF 101 | |
| 125 | 11:24:36.6 | 41:55:55 | 4.02 0.93 | 0.195 | 1 | VMF 103 | |
| 126 | 11:27:45.4 | 43:09:47 | 1.83 0.53 | 0.181 | 17 | MS 1125.3+4324 | |
| 127 | 11:28:54.2 | 42:52:00 | 1.69 0.32 | 0.411 | |||
| 128 | 11:35:54.4 | 21:31:04 | 1.78 0.38 | 0.133 | 1 | VMF 104 | |
| 129 | 11:38:43.2 | 03:15:33 | 1.59 0.34 | 0.127 | 1 | VMF 105 | |
| 130 | 11:42:04.5 | 21:45:00 | 4.56 1.29 | 0.131 | 1 | VMF 106 | |
| 131 | 11:42:06.3 | 10:08:52 | 4.71 0.65 | 0.119 | 3 | A 1354 | |
| 132 | 11:42:16.6 | 10:27:02 | 3.26 0.46 | 0.117 | foreground A 135, § 4.1 | ||
| 133 | 11:46:26.9 | 28:54:19 | 3.92 0.52 | 0.149 | 1 | VMF 107 | |
| 134 | 11:52:35.7 | 37:32:46 | 3.49 0.62 | 0.230 | |||
| 135 | 11:59:51.2 | 55:31:56 | 7.42 0.76 | 0.0808 | 11 | VMF 110, MS 1157.3+5548 | |
| 136 | 12:00:07.7 | 68:09:07 | 3.67 0.73 | 0.265 | 11 | foreground A 1432 | |
| 137 | 12:00:49.5 | 03:27:30 | 1.85 0.27 | 0.396 | 1 | VMF 111 | |
| 138 | 12:01:04.7 | 12:09:31 | 4.77 1.15 | 0.304 | |||
| 139 | 12:02:13.7 | 57:51:53 | 1.47 0.39 | 0.677 | |||
| 140 | 12:06:33.5 | 07:44:24 | 12.88 1.52 | 0.0680 | 1 | VMF 114 | |
| 141 | 12:11:16.0 | 39:11:41 | 3.18 0.37 | 0.340 | 17 | VMF 115, MS 1208.7+3928 | |
| 142 | 12:12:19.2 | 27:33:14 | 12.54 1.69 | 0.353 | a part of A 1489 | ||
| 143 | 12:12:59.0 | 27:27:13 | 7.93 1.09 | 0.179 | a part of A 1489 | ||
| 144 | 12:13:34.4 | 02:53:57 | 1.43 0.29 | 0.409 | 1 | VMF 116 | |
| 145 | 12:16:19.8 | 26:33:21 | 1.54 0.40 | 0.428 | 1 | VMF 117 | |
| 146 | 12:17:43.7 | 47:29:14 | 6.09 0.64 | 0.270 | |||
| 147 | 12:17:48.5 | 22:55:16 | 3.00 0.59 | 0.140 | |||
| 148 | 12:20:17.4 | 75:22:12 | 9.53 1.00 | 0.0059 | 14 | NGC 4291 | |
| 149 | 12:21:25.0 | 49:18:07 | 2.07 0.51 | 0.700 | 1 | VMF 119 | |
| 150 | 12:22:01.9 | 27:09:19 | 1.87 0.39 | 0.472 | |||
| 151 | 12:22:16.2 | 25:59:40 | 1.89 0.32 | 0.160 | |||
| 152 | 12:24:17.5 | 75:31:39 | 1.44 0.21 | 0.0056 | 14 | NGC 4386 | |
| 153 | 12:26:22.2 | 62:24:38 | 1.43 0.43 | 0.398 | 11 | ||
| 154 | 12:26:57.7 | 33:32:50 | 2.94 0.34 | 0.888 | 28 | ||
| 155 | 12:27:14.1 | 08:58:15 | 4.14 0.53 | 0.0873 | 29 | ||
| 156 | 12:30:14.1 | 23:26:04 | 3.13 0.73 | 0.221 | |||
| 157 | 12:31:45.6 | 41:37:11 | 2.82 0.34 | 0.176 | |||
| 158 | 12:35:06.4 | 41:17:44 | 3.01 0.83 | 0.189 | A 1565 | ||
| 159 | 12:36:28.6 | 12:24:21 | 2.45 0.38 | 0.0667 | 31 | IC 3574 | |
| 160 | 12:36:56.8 | 25:50:27 | 2.52 0.38 | 0.175 | |||
| 161 | 12:48:36.4 | 05:48:01 | 3.47 0.47 | 0.0041 | 25 | NGC 4697 | |
| 162 | 12:52:04.7 | 29:20:51 | 2.15 0.40 | 0.188 | 1 | VMF 124 | |
| 163 | 12:53:04.7 | 62:48:10 | 2.32 0.45 | 0.235 | A 1636 | ||
| 164 | 12:59:51.0 | 31:20:48 | 5.68 1.53 | 0.0523 | 5 | ||
| 165 | 13:01:43.4 | 10:59:35 | 2.80 0.71 | 0.231 | 1 | VMF 130 | |
| 166 | 13:08:32.9 | 53:42:15 | 1.69 0.26 | 0.330 | 9 | ||
| 167 | 13:11:12.7 | 32:28:58 | 4.67 0.56 | 0.245 | 1 | VMF 132 | |
| 168 | 13:12:19.4 | 39:00:58 | 2.59 0.38 | 0.404 | |||
| 169 | 13:13:39.1 | 32:50:41 | 2.55 0.35 | 0.0518 | |||
| 170 | 13:29:27.9 | 11:43:23 | 12.73 2.18 | 0.0228 | 4 | VMF 136, NGC 5171, NGC 5176 | |
| 171 | 13:29:49.4 | 33:10:23 | 1.80 0.30 | 0.0511 | |||
| 172 | 13:31:31.0 | 62:38:24 | 2.19 0.42 | 0.219 | |||
| 173 | 13:34:20.3 | 50:31:05 | 1.85 0.29 | 0.620 | 9 | ||
| 174 | 13:38:05.7 | 29:44:22 | 4.11 0.49 | 0.189 | 17 | MS 1335.2-2928 | |
| 175 | 13:38:50.2 | 38:51:18 | 5.98 0.77 | 0.246 | 33 | 3C 28, § 4.1 | |
| 176 | 13:40:33.5 | 40:17:46 | 1.61 0.29 | 0.171 | 1 | VMF 144 | |
| 177 | 13:40:54.0 | 39:58:28 | 3.47 0.66 | 0.169 | 1 | VMF 145, A 1774 | |
| 178 | 13:41:52.0 | 26:22:49 | 80.95 8.30 | 0.0755 | 3 | VMF 146, A 1775 | |
| 179 | 13:43:27.9 | 55:46:55 | 1.99 0.24 | 0.0673 | 11 | VMF 150, a part of A 1783 | |
| 180 | 13:49:00.2 | 49:18:33 | 5.52 0.96 | 0.167 | 22 | a part of A 1804 | |
| 181 | 13:54:16.7 | 02:21:46 | 1.46 0.23 | 0.546 | 1 | VMF 151 | |
| 182 | 13:57:19.4 | 62:32:42 | 1.95 0.26 | 0.525 | |||
| 183 | 14:06:55.0 | 28:34:16 | 2.56 0.31 | 0.118 | 1 | VMF 154 | |
| 184 | 14:10:13.4 | 59:42:38 | 3.35 0.69 | 0.316 | 11 | VMF 155 | |
| 185 | 14:10:15.9 | 59:38:27 | 2.01 0.68 | 0.319 | 11 | VMF 156 | |
| 186 | 14:16:26.8 | 23:15:31 | 13.05 1.38 | 0.138 | 9 | ||
| 187 | 14:16:28.1 | 44:46:38 | 4.04 0.50 | 0.400 | 1 | VMF 158 | |
| 188 | 14:18:31.2 | 25:10:47 | 7.54 0.78 | 0.290 | 1 | VMF 159 | |
| 189 | 14:27:58.2 | 26:30:23 | 1.46 0.23 | 0.0324 | 32 | IC 4436 | |
| 190 | 14:34:17.3 | 32:29:04 | 12.63 2.07 | 0.241 | A S0766 | ||
| 191 | 14:36:58.4 | 55:07:45 | 2.63 0.54 | 0.125 | |||
| 192 | 14:38:50.6 | 64:23:39 | 2.62 0.42 | 0.146 | 1 | VMF 164 | |
| 193 | 14:48:36.2 | 27:49:10 | 5.11 1.08 | 0.175 | may be a part of A 3609 | ||
| 194 | 14:51:17.4 | 18:41:00 | 2.73 0.56 | 0.0439 | 36 | IC 1062 | |
| 195 | 15:01:18.3 | 08:30:33 | 14.00 1.75 | 0.108 | |||
| 196 | 15:04:39.1 | 14:53:58 | 2.79 0.76 | 0.284 | |||
| 197 | 15:15:33.0 | 43:46:35 | 3.45 0.68 | 0.137 | 1 | VMF 168 | |
| 198 | 15:24:40.3 | 09:57:35 | 3.04 0.42 | 0.516 | 1 | VMF 170 | |
| 199 | 15:33:17.1 | 31:08:55 | 18.17 2.96 | 0.0673 | 3 | A 2092 | |
| 200 | 15:37:44.6 | 12:00:21 | 2.67 0.74 | 0.134 | 1 | VMF 171 | |
| 201 | 15:52:12.3 | 20:13:42 | 4.97 0.61 | 0.136 | 1 | VMF 175 | |
| 202 | 16:14:11.5 | 34:25:25 | 2.30 0.45 | 0.269 | |||
| 203 | 16:29:46.1 | 21:23:55 | 2.53 0.53 | 0.184 | 1 | VMF 178 | |
| 204 | 16:30:14.7 | 24:34:49 | 17.79 2.54 | 0.0655 | 1 | VMF 179 | |
| 205 | 16:31:04.9 | 21:21:54 | 3.01 0.60 | 0.0980 | 1 | VMF 180 | |
| 206 | 16:39:55.5 | 53:47:55 | 13.07 1.43 | 0.111 | 1 | VMF 182, A 2220 | |
| 207 | 16:41:11.0 | 82:32:26 | 8.03 1.16 | 0.206 | 1 | VMF 183 | |
| 208 | 16:41:52.3 | 40:01:29 | 2.94 0.80 | 0.464 | 1 | VMF 184 | |
| 209 | 16:58:33.9 | 34:30:08 | 3.37 0.68 | 0.330 | 1 | VMF 187 | |
| 210 | 17:00:42.7 | 64:12:58 | 4.56 0.48 | 0.225 | 3 | VMF 189, A 2246 | |
| 211 | 17:01:22.6 | 64:14:09 | 3.85 0.40 | 0.453 | 1 | VMF 190 | |
| 212 | 17:22:53.9 | 41:05:30 | 2.87 0.63 | 0.309 | 1 | VMF 193 | |
| 213 | 17:29:00.6 | 74:40:40 | 1.74 0.51 | 0.213 | 1 | VMF 194 | |
| 214 | 17:46:27.4 | 68:48:57 | 2.23 0.34 | 0.217 | 1 | VMF 195 | |
| 215 | 17:51:08.6 | 65:31:59 | 3.41 0.71 | 0.0428 | 32 | NGC 6505 | |
| 216 | 17:51:38.6 | 67:19:19 | 4.81 1.42 | 0.0933 | 40 | ||
| 217 | 18:06:55.8 | 65:37:11 | 4.93 1.00 | 0.263 | 40 | ||
| 218 | 18:07:28.1 | 69:46:22 | 1.41 0.39 | 0.0941 | |||
| 219 | 18:19:10.0 | 69:09:39 | 2.58 0.89 | 0.205 | |||
| 220 | 18:23:43.5 | 56:58:26 | 2.59 0.41 | 0.105 | |||
| 221 | 18:46:42.7 | 74:31:59 | 4.53 0.75 | 0.141 | |||
| 222 | 20:03:13.3 | 32:47:31 | 2.53 0.61 | 0.256 | |||
| 223 | 20:03:28.4 | 55:56:47 | 4.77 0.60 | 0.0148 | 41 | VMF 196, A S0840 | |
| 224 | 20:11:53.2 | 35:55:40 | 2.13 0.52 | 0.172 | |||
| 225 | 20:51:38.6 | 57:04:24 | 1.43 0.24 | 0.0599 | |||
| 226 | 21:14:19.8 | 68:00:56 | 2.57 0.30 | 0.130 | 1 | VMF 201 | |
| 227 | 21:37:06.9 | 00:26:48 | 2.77 0.63 | 0.0509 | 1 | VMF 202 | |
| 228 | 21:37:51.2 | 42:51:08 | 5.08 0.66 | 0.185 | A 3791 | ||
| 229 | 22:13:30.4 | 16:56:05 | 1.83 0.36 | 0.297 | 1 | VMF 207 | |
| 230 | 22:20:09.1 | 52:28:01 | 18.80 2.22 | 0.102 | 42 | A 3864 | |
| 231 | 22:22:13.9 | 52:35:13 | 2.61 0.41 | 0.174 | may be a part of A 3870 | ||
| 232 | 22:39:24.4 | 05:46:57 | 2.22 0.32 | 0.242 | 8 | VMF 208, a part of A 2465 | |
| 233 | 22:39:38.8 | 05:43:13 | 3.24 0.46 | 0.243 | 8 | VMF 210, a part of A 2465 | |
| 234 | 22:47:29.5 | 03:37:08 | 2.30 0.50 | 0.200 | 1 | VMF 211 | |
| 235 | 22:58:07.1 | 20:55:06 | 5.06 0.60 | 0.288 | 17 | VMF 213, MS 2255.7+2039 | |
| 236 | 23:05:25.7 | 35:45:43 | 1.55 0.29 | 0.201 | 1 | VMF 214 | |
| 237 | 23:18:05.5 | 42:35:34 | 1.56 0.30 | 0.209 | 1 | VMF 216 | |
| 238 | 23:19:34.2 | 12:26:12 | 3.83 0.49 | 0.126 | 1 | VMF 217 | |
| 239 | 23:23:14.8 | 18:11:23 | 5.04 0.99 | 0.154 | |||
| 240 | 23:25:39.0 | 54:43:57 | 2.26 0.68 | 0.102 | 1 | VMF 218 | |
| 241 | 23:48:53.4 | 31:17:12 | 3.25 0.44 | 0.184 | 1 | VMF 221, A 4043 | |
| 242 | 23:55:11.5 | 15:00:29 | 2.66 0.65 | 0.0857 | 1 | VMF 223 | |
Note. — Cluster redshift references are: 1 — Vikhlinin et al. (1998a); Mullis et al. (2003); 2 — Cappi et al. (1998); 3 — Struble & Rood (1999); 4 — Mahdavi & Geller (2004); 5 — Rines et al. (2003); 6 — Simien & Prugniel (2000); 7 — Huchra et al. (1999); 8 — Perlman et al. (2002); 9 — Romer et al. (2000); 10 — Nesci & Altamore (1990); 11 — Abazajian et al. (2005); 12 — da Costa et al. (1998); 13 — Abell et al. (1989); 14 — de Vaucouleurs et al. (1991); 15 — Colless et al. (2001); 16 — Batuski et al. (1999); 17 — Stocke et al. (1991); 18 — Wegner et al. (2003); 19 — Mason et al. (2000); 20 — Peterson (1978); 21 — Molthagen et al. (1997); 22 — Böhringer et al. (2000); 23 — Miller et al. (2002); 24 — Appenzeller et al. (1998); 25 — Smith et al. (2000); 26 — Denicoló et al. (2005); 27 — Binggeli et al. (1985); 28 — Ebeling et al. (2001b); 29 — Burke et al. (2003); 30 — Bernardi et al. (2002); 31 — Binggeli et al. (1993); 32 — Falco et al. (1999); 33 — Hewitt & Burbidge (1991); 34 — Keel (1996); 35 — Huchra et al. (1990); 36 — Wegner et al. (1999); 37 — Miller et al. (2004); 38 — Owen et al. (1995); 39 — Kochanek et al. (2001); 40 — Gioia et al. (2003); 41 — da Costa et al. (1991); 42 — Katgert et al. (1998); If redshift reference is missing, the redshift is our measurement (hornstrup05). The codes in column (8) are VMF — 160d cluster (Vikhlinin et al., 1998a; Mullis et al., 2003); A — Abell cluster (Abell et al., 1989); MS — EMSS (Stocke et al., 1991).
| Num. | R.A. | Dec. | , | ref. | , | Note | ROSAT target: | |||
|---|---|---|---|---|---|---|---|---|---|---|
| (J2000) | cgs | erg s-1 | Type | Name | ||||||
| (1) | (2) | (3) | (4) | (5) | (6) | (7) | (8) | (9) | (10) | (11) |
| 1 | 03:22:20.5 | 49:18:42 | 4.04 0.66 | 0.0670 | 13 | VMF 032, A S0346 | 0.0710 | AGN | 2MASX J032315324931064 | |
| 2 | 03:31:59.4 | 45:24:24 | 1.63 0.36 | 0.0671 | 0.0665 | Horologium Supercluster (Lucey et al., 1983) | ||||
| 3 | 08:38:10.4 | 25:06:02 | 18.48 3.02 | 0.0286 | 4 | CGCG 120-014 | 0.0286 | AGN | NGC 2622, MKN 1218 | |
| 4 | 10:20:45.3 | 38:31:28 | 5.16 0.65 | 0.0530 | 0.0491 | GClstr | RX J1022.13830 | |||
| 5 | 10:24:19.1 | 68:04:56 | 5.46 0.62 | 0.201 | 9 | A 0981 | 0.2031 | GClstr | A 0998 | |
| 6 | 12:04:04.0 | 28:07:08 | 10.25 1.09 | 0.167 | 17 | VMF 112, MS 1201.5+2824 | 0.1653 | AGN | GQ Com | |
| 7 | 12:36:59.5 | 63:11:18 | 19.75 2.22 | 0.302 | 3 | A 1576 | 0.2970 | BL Lac | HB89 1235632 | |
| 8 | 13:29:39.3 | 29:46:05 | 2.25 0.34 | 0.0473 | 32 | CGCG 161-067 | 0.0470 | AGN | VCV2001 J132908.8295023 | |
| 9 | 13:59:34.0 | 62:19:01 | 4.93 0.54 | 0.332 | 0.3280 | GClstr | ZwCl 1358.16245 | |||
| 10 | 14:25:04.5 | 37:58:16 | 2.04 0.41 | 0.163 | 0.1712 | GClstr | A 1914 | |||
| 11 | 14:44:06.4 | 63:44:54 | 1.74 0.38 | 0.298 | 35 | VMF 165, A 1969 | 0.2990 | BL Lac | MS 1443.56349 | |
| 12 | 15:00:02.6 | 22:34:05 | 1.46 0.42 | 0.230 | 1 | VMF 166 | 0.2350 | BL Lac | FBQS J150101.8223806 | |
| 13 | 15:14:22.0 | 36:36:22 | 5.14 0.65 | 0.372 | 17 | MS 1512.4+3647 | 0.3707 | QSO | HB89 1512370 | |
| 14 | 15:36:35.3 | 01:33:20 | 7.14 1.83 | 0.309 | 0.3120 | BL Lac | RBS 1517 | |||
| 15 | 15:40:10.1 | 66:11:18 | 3.29 0.59 | 0.245 | 37 | 0.2465 | GClstr | A 2125 | ||
| 16 | 15:41:10.7 | 66:26:30 | 2.91 0.39 | 0.245 | 9 | 0.2465 | GClstr | A 2125 | ||
| 17 | 15:47:20.4 | 20:57:01 | 2.54 0.88 | 0.266 | 1 | VMF 174 | 0.2643 | QSO | PG 1545210 | |
| 18 | 16:20:21.6 | 17:23:19 | 2.08 0.39 | 0.112 | 1 | VMF 177 | 0.1124 | QSO | MRK 0877, PG1617175 | |
| 19 | 16:27:00.1 | 55:28:18 | 21.06 2.44 | 0.130 | 3 | A 2201 | 0.1330 | QSO | SBS 1626554 | |
| 20 | 16:59:02.1 | 32:29:15 | 3.37 0.48 | 0.0621 | 38 | 0.0635 | GClstr | A 2241 | ||
| 21 | 17:01:27.9 | 34:00:35 | 3.72 0.74 | 0.0960 | 11 | 0.0968 | GClstr | A 2244 | ||
| 22 | 17:22:15.4 | 30:42:45 | 12.22 2.04 | 0.0467 | 39 | CGCG 170-018 | 0.0430 | AGN | MRK506 | |
| 23 | 18:43:30.6 | 79:49:57 | 3.15 0.42 | 0.0510 | 17 | MS 1846.9+7947 | 0.0561 | AGN | 3C 390.3 | |
| 24 | 21:39:04.8 | 23:33:08 | 5.18 0.69 | 0.320 | 0.3130 | GClstr | MS 2137.32353 | |||
Note. — See notes to Table 4
| R.A. | Dec. | , | ref. | , | Type | Note | |
|---|---|---|---|---|---|---|---|
| (J2000) | cgs | erg s-1 | |||||
| (1) | (2) | (3) | (4) | (5) | (6) | (7) | (8) |
| 09:55:18.0 | 69:50:57 | 2.48 0.32 | M82 wind | ||||
| 12:19:09.9 | 47:05:40 | 1.41 0.18 | 0.0009 | 14 | dE | UGC 07356 | |
| 12:21:56.1 | 04:29:09 | 4.38 0.71 | 0.0052 | 27 | SAB, Sy2 | MESSIER 061 | |
| 12:30:01.0 | 13:38:41 | 4.62 0.71 | 0.0045 | 30 | SB0, Sy2 | NGC 4477 | |
| 14:13:15.1 | 03:12:36 | 26.05 2.80 | 0.0062 | 34 | Sa, Sy2 | NGC 5506 | |
Note. — See notes to Table 4
| R.A. | Dec. | , | Note |
|---|---|---|---|
| (J2000) | cgs | ||
| (1) | (2) | (3) | (4) |
| 03:22:26.4 | 21:08:34 | 9.15 1.49 | § 4.1 |
| 03:55:46.9 | 39:25:23 | 2.30 0.41 | |
| 05:22:37.1 | 36:28:53 | 1.41 0.41 | |
| 06:54:15.9 | 69:05:52 | 1.44 0.46 | |
| 10:07:09.9 | 35:02:47 | 1.54 0.24 | |
| 11:39:58.6 | 31:53:04 | 1.45 0.36 | |
| 12:30:35.6 | 76:59:34 | 1.55 0.49 | |
| 12:43:50.8 | 02:44:12 | 3.22 0.76 | |
| 13:37:54.2 | 38:54:01 | 1.43 0.41 | VMF 143 |
| 14:18:45.6 | 06:44:02 | 1.64 0.24 | VMF 160 |
| 14:28:28.0 | 01:06:31 | 1.41 0.29 | |
| 15:00:51.3 | 22:44:56 | 1.78 0.35 | VMF 16, § 4.1 |
| 17:58:26.0 | 65:30:58 | 3.93 0.53 | |
| 19:58:02.6 | 57:35:39 | 1.98 0.65 | |
| 20:05:13.5 | 56:12:57 | 3.51 0.49 | VMF 198 |
| 22:01:54.9 | 51:24:04 | 1.53 0.37 | |