001–999
Supermassive Black Holes in BCGs
Abstract
We observed a sample of three Brightest Cluster Galaxies (BCGs), Abell 1836-BCG, Abell 2052-BCG, and Abell 3565-BCG, with the Advanced Camera for Surveys (ACS) and the Imaging Spectrograph (STIS) on board the Space Telescope. For each target galaxy we obtained high-resolution spectroscopy of the H and [N II] emission lines at three slit positions, to measure the central ionized-gas kinematics. ACS images in three different filters (F435W, F625W, and FR656N) have been used to determine the optical depth of the dust, stellar mass distribution near the nucleus, and intensity map. We present supermassive black hole (SBH) mass estimates for two galaxies which show regular rotation curves and strong central velocity gradients, and an upper limit on the SBH mass of the third one. For the SBHs of Abell 1836-BCG and Abell 3565-BCG, we derived M⊙ and M⊙ at confidence level, respectively. For the SBH of Abell 2052-BCG, we found M⊙.
keywords:
black hole physics, galaxies: kinematics and dynamics, galaxies: structure1 Introduction
The link between the evolution of SBHs and the hierarchical build-up of galaxies is imprinted in a number of scaling relations connecting SBH masses to the global properties of the host galaxies. The high SBH mass end of these relations has yet to be fully explored: the massive galaxies expected to host the most massive SBHs are generally at large distances, making a dynamical detection of SBHs observationally challenging. This is unfortunate, since black holes with mass in excess of M⊙ occupy an integral part in our understanding of the co-evolution of SBHs and galaxies: these are the systems that have undergone the most extensive and protracted history of merging; moreover, they represent the local relicts of the high redshift quasars detected in optical surveys. To investigate the high-mass end of the SBH mass function, we selected three BCGs from the sample of Laine et al. (2003). Their large masses, luminosities and stellar velocity dispersions, as well as their having a merging history which is unmatched by galaxies in less crowded environments, make these galaxies the most promising hosts of the most massive SBHs in the local Universe.
2 Dynamical Modeling and Results
Following Coccato et al. (2006), a model of the gas velocity field for each galaxy is generated by assuming that the ionized-gas component is moving onto circular orbits in an infinitesimally thin disc centered at the galactic nucleus. The model is projected onto the plane of the sky for a grid of assumed inclination angles of the gaseous disk. Finally, the model is brought to the observational plane by accounting for the width and location (namely position angle and offset with respect to the disk center) of each slit, for the point spread function of the STIS instrument, and for the effects of charge bleeding between adjacent CCD pixels. The mass of the SBH is determined by finding the model parameters (SBH mass, inclination of the gas disk, and mass-to-light ratio of the stellar component) that produce the best match to the observed velocity curves.
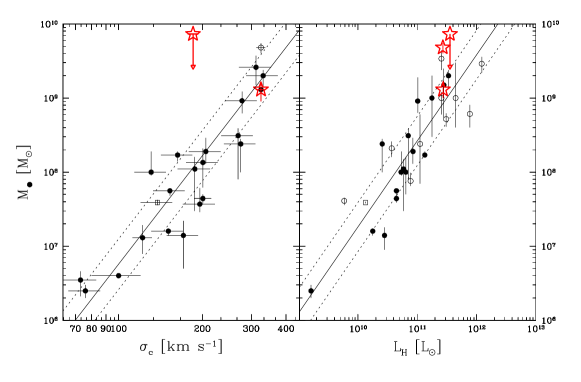
For Abell 1836-BCG, we derive M⊙, the largest SBH mass to have been dynamically measured to-date. The best fit inclination angle is , while only an upper limit to the stellar mass-to-light ratio is found ( M/LI⊙ at confidence level). For Abell 3565-BCG we determine M⊙, with and M/LI⊙ ( confidence level). In the case of Abell 2052-BCG we find M⊙, following the method by Sarzi et al. (2002).
In Fig. 1 we show the location of our SBH masses determinations in the near-infrared relation of Marconi & Hunt (2003) and the relation, as given in Ferrarese & Ford (2005). Implications of these observations will be discussed in a forthcoming paper (Dalla Bontà et al., in preparation).
References
- [Coccato et al.(2006)] Coccato, L., et al. 2006, MNRAS, 366, 1050
- [Ferrarese & Ford(2005)] Ferrarese, L., & Ford, H. 2005, Sp. Sci. Rev., 116, 523
- [Laine et al.(2003)] Laine, S., et al. 2003, ApJ, 125, 478
- [Marconi & Hunt(2003)] Marconi, A., & Hunt, L. K. 2003, ApJ, 589, L21
- [Sarzi et al.(2002)] Sarzi, M., et al. 2002, ApJ, 567, 237
- [Smith et al.(2000)] Smith, R. J., et al. 2000, MNRAS, 313, 469