email:[voss;gilfanov]@mpa-garching.mpg.de
A study of the population of LMXBs in the bulge of M31
Abstract
Aims. We explore the population of X-ray point sources in the bulge of M31 to contrast properties of various subpopulations, such as persistent and transient sources and primordial LMXBs and dynamically formed ones.
Methods. Based on the data from 26 archival Chandra observations we study the source content and properties of various subpopulations of X-ray sources to a maximum distance of 12′ from the centre of M31.
Results. To a limiting luminosity of erg s-1 we find 263 X-ray point sources, with of these being background galaxies. A study of the spatial distribution and the luminosity function of the X-ray sources shows that the distribution of primordial LMXBs is consistent with the distribution of the K-band light and that their luminosity function flattens below erg s-1 to the law in agreement with the behaviour found earlier for LMXBs in the Milky Way and in Cen A. Within a radius of , the luminosity function is independent of distance to the centre of M31, in contrast to earlier Chandra studies. The LMXBs located in globular clusters and within from the centre of M31 are presumably created via dynamical interactions. The dynamical origin of the sources is strongly suggested by their radial distribution which follows the profile rather than the K-band light distribution. Their luminosity function shows a prominent fall-off below . Although the statistics is insufficient to claim a genuine low-luminosity cut-off in the luminosity function, the best fit powerlaw with a slope of -0.60.2 is significantly flatter than the law. We also searched for transients and found 28 sources that varied by a factor larger than 20. Their spatial distribution follows the distribution of the persistent LMXBs within the accuracy allowed by the limited number of transients.
Key Words.:
galaxies: individual: M31 – X-rays: binaries – X-rays: galaxies1 introduction
With the advent of Chandra,
X-ray point sources in nearby galaxies became a
subject of intense study
(see Fabbiano 2006, and references therein).
In spiral and starburst galaxies the X-ray luminosity function
(LF) has been shown to be a powerlaw with a differential slope of 1.6
(Grimm et al. 2003), whereas the LF in elliptical galaxies seems to have
a more complicated shape, being steep at the bright end, , with power law index in the 1.8-2.5 range, and flat below
(Gilfanov 2004; Voss & Gilfanov 2006). There is, however,
currently no consensus on the existence and position of the breaks, and
on the slope below a few times erg s-1 (Kim, D.-W., et al. 2006).
While M31 is not an elliptical galaxy, the population of X-ray sources
in the bulge mainly consists of low mass X-ray binaries (LMXBs), similar
to the population of X-ray sources in elliptical galaxies. It is
therefore fair to expect the X-ray LF to be similar to that of ellipticals
(and perhaps even more interesting if differences show up).
The LF can only be studied to a limiting luminosity of erg s-1
in the closest large ellipticals (Kim, D.-W., et al. 2006), except for Cen A
(Voss & Gilfanov 2006) that is both an unusual elliptical and suffers from contamination
of X-rays from other sources than binaries. In contrast to this, the
proximity of M31 makes it possible to study the LF down
to erg s-1.
M31 has been observed extensively both by XMM-Newton and
Chandra, and
the point source population has been analysed in a number of papers,
see e.g. Kong et al. (2002); Kaaret (2002); Pietsch et al. (2005b); Williams et al. (2004a, 2006).
In the central parts of M31 the point spread function
(PSF) of XMM-Newton
causes source confusion and therefore only Chandra
observations are suited for studies of the weak sources in this region.
The LF of the inner region of M31 has previously been studied
with Chandra by Kong et al. (2002, 2003); Williams et al. (2004a).
There are several good reasons
to reinvestigate the LF in this region. The inner bulge of M31
has been observed a number of times after this study, significantly
increasing the exposure, and also the previous study did not include the
effects of incompleteness and contamination by background sources,
which influences their conclusions significantly.
The paper is structured as follows. In section 2 we describe the data sets and the basic data preparation and analysis. The identification of sources in other wavelengths is discussed in this section. The properties of the population of X-ray binaries in the bulge of M31 are analysed in section 3, including the spatial distribution and analysis of incompleteness effects. The search for and analysis of transient sources is presented in section 4. The LFs of the source populations are analysed in section 5. We conclude in section 6.
to achieve absolute astrometry. 1 pixel equals 0.492″. Obs-ID Date Instrument Exp. Time R.A. Dec. Data Mode Correction West Correction North 0303 1999 Oct 13 ACIS-I 12.01 ks 00 42 44.4 41 16 08.30 FAINT 0.72 pixel 0.29 pixel 0305 1999 Dec 11 ACIS-I 04.18 ks 00 42 44.4 41 16 08.30 FAINT 0.59 pixel 0.16 pixel 0306 1999 Dec 27 ACIS-I 04.18 ks 00 42 44.4 41 16 08.30 FAINT 0.51pixel 0.01 pixel 0307 2000 Jan 29 ACIS-I 04.17 ks 00 42 44.4 41 16 08.30 FAINT 0.34 pixel 0.19 pixel 0308 2000 Feb 16 ACIS-I 04.06 ks 00 42 44.4 41 16 08.30 FAINT 0.77 pixel 1.34 pixel 0309 2000 Jun 01 ACIS-S 05.16 ks 00 42 44.4 41 16 08.30 FAINT 0.41 pixel 0.12 pixel 0310 2000 Jul 02 ACIS-S 05.14 ks 00 42 44.4 41 16 08.30 FAINT 0.40 pixel 0.17 pixel 0311 2000 Jul 29 ACIS-I 04.96 ks 00 42 44.4 41 16 08.30 FAINT 1.29 pixel 2.79 pixel 0312 2000 Aug 27 ACIS-I 04.73 ks 00 42 44.4 41 16 08.30 FAINT 0.90 pixel 1.62 pixel 1575 2001 Oct 05 ACIS-S 38.15 ks 00 42 44.4 41 16 08.30 FAINT 0.97 pixel 0.04 pixel 1577 2001 Aug 31 ACIS-I 04.98 ks 00 43 08.5 41 18 20.00 FAINT 2.79 pixel 2.71 pixel 1581 2000 Dec 13 ACIS-I 04.46 ks 00 42 44.4 41 16 08.30 FAINT 0.62 pixel 2.93 pixel 1582 2001 Feb 18 ACIS-I 04.36 ks 00 42 44.4 41 16 08.30 FAINT 1.65 pixel 2.49 pixel 1583 2001 Jun 10 ACIS-I 05.00 ks 00 42 44.4 41 16 08.30 FAINT 0.50 pixel 3.95 pixel 1585 2001 Nov 19 ACIS-I 04.95 ks 00 43 05.6 41 17 03.30 FAINT 1.28 pixel 0.81 pixel 1854 2001 Jan 13 ACIS-S 04.75 ks 00 42 40.8 41 15 54.00 FAINT 0.74 pixel 0.19 pixel 2895 2001 Dec 07 ACIS-I 04.94 ks 00 43 08.5 41 18 20.00 FAINT 0.49 pixel 0.22 pixel 2896 2002 Feb 06 ACIS-I 04.97 ks 00 43 05.5 41 17 03.30 FAINT 0.20 pixel 0.83 pixel 2897 2002 Jan 08 ACIS-I 04.97 ks 00 43 09.8 41 19 00.72 FAINT 0.44 pixel 0.01 pixel 2898 2002 Jun 02 ACIS-I 04.96 ks 00 43 09.8 41 19 00.72 FAINT 0.56 pixel 0.02 pixel 4360 2002 Aug 11 ACIS-I 04.97 ks 00 42 44.4 41 16 08.90 FAINT 0.19 pixel 0.07 pixel 4678 2003 Nov 09 ACIS-I 04.87 ks 00 42 44.4 41 16 08.90 FAINT 0.06 pixel 0.35 pixel 4679 2003 Nov 26 ACIS-I 04.77 ks 00 42 44.4 41 16 08.90 FAINT 0.00 pixel 0.96 pixel 4680 2003 Dec 27 ACIS-I 05.24 ks 00 42 44.4 41 16 08.90 FAINT 0.36 pixel 0.86 pixel 4681 2004 Jan 31 ACIS-I 05.13 ks 00 42 44.4 41 16 08.90 FAINT 0.59 pixel 1.12 pixel 4682 2004 May 23 ACIS-I 04.93 ks 00 42 44.4 41 16 08.90 FAINT 0.64 pixel 0.07 pixel
2 Data analysis
The analysis in this paper is based on 26 Chandra ACIS observations, with aimpoints within 10′ from the centre of M31 (RA 00 42 44.31, Dec +41 16 09.4). Information about the observations is listed in Table 1. The data preparation was done following the standard CIAO111http://cxc.harvard.edu/ciao/ threads (CIAO version 3.2.1; CALDB version 3.0.3), and limiting the energy range to 0.5-8.0 keV. The ACIS chips sometimes experience flares of enhanced background. For point source detection and luminosity estimation it is not necessary to filter out the flares, since the increased exposure time outweighs the increased background.
We used CIAO wavdetect to detect sources. The input parameters for the detection procedure are similar to those used in Voss & Gilfanov (2006). We detected sources within 10′ of the aimpoint in each of the individual observations. Due to limitations of the absolute astrometry of Chandra, the observations have to be aligned before they are combined. We chose to align the observations to OBS-ID 1575, as this is the observation with highest exposure time. For each of the observations we determined the number of sources matching sources found in OBS-ID 1575, excluding all ambiguous matches, such as a source in one of the source lists being close to two sources in the other list. The source lists were shifted relative to each other, and the smallest rms-distance between the sources were found. This method made it possible to align the 25 observations with OBS-ID 1575 with a minimum of 40 matches. The corrections applied to the observations are listed in Table 1. All the observations were then reprojected into the coordinate systems of OBS-ID 1575 using CIAO reproject_events, and a merged observations were created. Notice that the steps above were taken in order to align and combine the observations, not to achieve good absolute astrometry. This will be dealt with using optical data in section 2.2.
An exposure map was created for each of the observations, assuming the energy distribution to be a powerlaw with photon index of 1.7 and Galactic absorption of 6.68cm-2. (Dickey & Lockman 1990). In the following we use the same spectrum to convert the observed count rates to unabsorbed source flux. To calculate the luminosity of the sources, we assumed a distance of 780 kpc to M31 (Stanek & Garnavich 1998; Macri 2001).
To estimate the source counts we applied circular aperture photometry. The output count rate for each detected source is calculated inside a circular region centered on the source central coordinates given by wavdetect. The radius of the circle was determined individually for each source so that the encircled energy was 85%. To find this radius we extracted the PSF using CIAO psfextract task for each of the 26 observations, and the PSFs were combined using the values of the exposure maps as weights. For the background region we used a circle with radius 3 times the radius of the source region and the source region excluded, as well as the source regions of eventual nearby sources. The corrected source counts and errors were then found by the equations (Harnden et al. 1984):
| (1) |
and
| (2) |
Here is the total number of counts from the source, C is the number of counts inside the source region and Q is the number of counts in the background region, is the integral of the PSF over the source region, is the integral of the PSF over the source and background regions, b is the area of the source and background regions and d is the area of the source region. For close sources the extraction regions can overlap. In this case a second iteration was performed. In this iteration the number of counts of the neighbouring sources, together with their PSF was used to find the contamination from nearby sources of the source and background regions of a source. This contamination from nearby sources was then subtracted from and , and equation 1 was repeated. In all cases the effect of the contamination was small enough to justify the use of this method with only on iteration.
2.1 2MASS LGA
To compare the spatial distribution of the point sources with the distribution of mass in M31, we used a K-band image of the region from the 2MASS Large Galaxy Atlas (Jarret et al. 2003). The image has a resolution of 1″, and it is therefore possible to clearly see point sources. While many of the sources are objects inherent to M31, such as globular clusters, some of the sources may be foreground or background objects. In order to remove these objects, we correlate the image with the Revised Bologna catalogue of M31 globular clusters (Galleti et al. 2004), and thereby find the maximum K-band luminosity of a globular cluster, 2. All point sources more luminous than this are removed from the image (replaced with local background). This corresponds to 14 per cent of the luminosity in the outer part of the image (the annulus 9′-12′). Point sources with luminosities between 4 and 2 corresponds only to 2 per cent of the total luminosity, and most of these sources are GCs in M31. We therefore conclude that after our removal of the most luminous sources, contamination from point sources not in M31 is insignificant in the outer region. In the rest of the image the luminosity density of M31 is higher and contamination is therefore even less important.
2.2 Absolute astrometry
We used the 2MASS All-Sky Point Source Catalog (Skrutskie et al. 2006) to achieve better absolute astrometry. This catalog was chosen, due to the high number of (true) matches with our source list. The astrometric precision ranges from 0.1″ for brighter sources to 0.4″ for the weakest sources. The X-ray sources were correlated with the 3132 2MASS point sources in the observed region and the X-ray image was shifted to give the smallest rms-distance for matches with a distance less than 1″. This gives a correction of 0.97 pixel west and +0.04 pixel north with 40 matches (2 random matches expected). We note that after the corrections, our source coordinates are in good agreement with the coordinates given by previous studies (Kong et al. 2002; Williams et al. 2004a).
2.3 Source Identifications
For the identification of the detected sources we have used a variety of catalogues. For the identification of globular clustes we have used the Revised Bologna Catalogue of M31 globular clusters (Galleti et al. 2004) as well as the lists given by Magnier (1993) and Fan et al. (2005). GCs were divided into the categories confirmed GCs and candidate GCs, following (Galleti et al. 2004), and the GCs in Magnier (1993) and Fan et al. (2005) were all considered candidates. Planetary nebulae have been identified using Ciardullo et al. (1989), and supernova remnants using Magnier et al. (1995). Furthermore we have searched for sources coincident with stellar novae in Pietsch et al. (2005a). Stars were identified using Galleti et al. (2004) as well as GSC 2.2 (Morrison et al. 2003) and USNO-B1 (Monet et al. 2003) (the latter two catalogues gave only sources found in Galleti et al. (2004) as well). Finally we searched for possible counterparts using the NASA/IPAC Extragalactic Database (NED) and SIMBAD. A source was assumed to be a counterpart to the X-ray source if within a distance of 2.5″, except for supernova remnants for which the distance was 5″.
A number of objects have been excluded from the following analysis, 4 foreground stars, 3 SNRs and one extended source (which was detected as two sources). More sources have been identified with objects, as can be seen from our source list, but the number is small, and the meaning of the identifications is uncertain, and we have therefore chosen to keep them in the sample. For example we note that a detailed study of the planetary nebulae correlations (Williams et al. 2004b) suggested that most are not true counterparts. Also of the four novae correlations, only one (source 128) is a true counterpart (W. Pietsch, private communication).
Our final source list consists of 263 sources within a radius of 12′ from the centre of M31 (Table LABEL:sourcelist). Of these 9 sources are not included in the analysis below. Above erg s-1 there are 48 sources, and above erg s-1 (approximately the completeness limit), there are 136 sources included in the analysis. We expect 29 of the sources with luminosity erg s-1 and 89 of all the sources to be background sources, taking into account incompleteness, see sections 3.1.3 and 3.3. We find that 15 sources are coincident with GCs (0.25 random matches expected) and 14 with GC candidates (1 random match expected).
| Number | distance | RA | DEC | cts | corrected cts | error | luminosity | type | id | name |
|---|---|---|---|---|---|---|---|---|---|---|
| (1) | (2) | (3) | (4) | (5) | (6) | (7) | (8) | (9) | (10) | (11) |
| 1 | 1.0 | 00 42 44.37 | 41 16 08.7 | 2245 | 2580.7 | 58.0 | 7.08e+36 | r1-10 | ||
| 2 | 2.2 | 00 42 44.38 | 41 16 07.4 | 2864 | 3308.2 | 65.4 | 1.08e+37 | r1-9 | ||
| 3 | 4.0 | 00 42 44.38 | 41 16 05.4 | 1117 | 1233.9 | 41.3 | 5.32e+36 | r1-21 | ||
| 4 | 4.6 | 00 42 44.30 | 41 16 14.0 | 316 | 344.9 | 22.6 | 1.52e+36 | r1-22 | ||
| 5 | 5.4 | 00 42 43.86 | 41 16 11.1 | 225 | 244.1 | 19.2 | 1.07e+36 | r1-27 | ||
| 6 | 7.4 | 00 42 43.87 | 41 16 03.9 | 709 | 811.6 | 33.1 | 3.53e+36 | r1-23 | ||
| 7 | 9.7 | 00 42 44.68 | 41 16 18.2 | 906 | 1047.3 | 37.3 | 4.62e+36 | r1-8 | ||
| 8 | 10.6 | 00 42 45.24 | 41 16 11.1 | 456 | 516.2 | 26.8 | 2.25e+36 | r1-20 | ||
| 9 | 14.5 | 00 42 45.60 | 41 16 08.6 | 1026 | 1191.0 | 39.5 | 5.21e+36 | r1-7 | ||
| 10 | 15.3 | 00 42 45.12 | 41 16 21.7 | 3098 | 3631.2 | 67.9 | 1.61e+37 | RAD | SIM WSTB 37W135 | r1-4 |
| 11 | 20.8 | 00 42 43.88 | 41 16 29.6 | 1293 | 1463.5 | 44.5 | 6.54e+36 | r1-11 | ||
| 12 | 21.7 | 00 42 46.01 | 41 16 19.6 | 468 | 531.3 | 27.2 | 2.33e+36 | t | r1-19 | |
| 13 | 23.8 | 00 42 43.75 | 41 16 32.4 | 2329 | 2726.7 | 59.0 | 1.24e+37 | r1-12 | ||
| 14 | 24.0 | 00 42 42.18 | 41 16 08.3 | 4525 | 5353.9 | 81.6 | 2.45e+37 | t | r1-5 | |
| 15 | 25.9 | 00 42 42.48 | 41 15 53.7 | 3077 | 3601.1 | 67.6 | 1.62e+37 | PN | CIA 4 | r1-14 |
(1) – The sequence number; (2) – Distance to the centre in arcsec; (3),(4) – Right ascension and declination of source; (5) – Source counts; (6) – Source counts after background subtraction; (7) – Statistical error on source counts after background subtraction; (8) – X-ray luminosity, 0.5-8 keV, assuming 780 kpc distance; (9) – Source Type: GC – confirmed globular cluster, GCC – globular cluster candidate, PN – planetary nebula, FGS – foreground star, NOVA – nova, EmO – emission line object, RAD – radio source, SNR – supernova remnant, EXT – extended source, t – transient source; (10) – precise identification and reference: Bol – Galleti et al. (2004), Fan – Fan et al. (2005), Mita – Magnier (1993), MLA – Meyssonnier et al. (1993), W2 – Williams et al. (2004b), CIA – Ciardullo et al. (1989), CFN – Ciardullo et al. (1987), PIE – Pietsch et al. (2005a), SI – Shafter & Irby (2001), B68 – Börngen (1968), SIM – Simbad, GLG – Gelfand et al. (2004), B90 – Braun (1990), MG – Magnier et al. (1995), Cra – Crampton et al. (1984); (11) – Source name in Kong et al. (2002), Williams et al. (2004a) and Williams et al. (2006); Sources not included in these catalogues are marked with K if observed in Kaaret (2002), else with X, indicating that these are new sources.
3 Populations of sources in the bulge of M31
3.1 Expected numbers
3.1.1 Low mass X-ray binaries
LMXBs are related to the population of old stars, and there is therefore a correlation between their number and the stellar mass of a galaxy (Gilfanov 2004). In order to estimate the expected number and luminosity distribution of LMXBs we used a K-band image from 2MASS Large Galaxy Atlas (Jarret et al. 2003) and integrated the flux emitted in the parts of M31 analysed in this paper (excluding luminous point sources not related to the galaxy, see Sect. 2.1). This gives a K-band luminosity of . To convert it to the stellar mass we use the color-dependent K-band mass-to-light ratio from Bell & De Jong (2001). For the extinction corrected optical color of the bulge of M31, (Walterbos & Kennicutt 1987), the mass-to-light ratio is . This gives the stellar mass of , assuming that the absolute K-band magnitude of the sun is equal to . Using the results of Gilfanov (2004) we predict 55.7 LMXBs with erg s-1, and 128.9 with erg s-1.
3.1.2 High mass X-ray binaries
Being young objects, HMXBs are associated with star formation and, as expected for the bulge of a spiral galaxy, are by far a less significant contribution to the population of X-ray binaries than LMXBs. Star formation is mostly associated with the disk of M31. An investigation of the star formation rate of the disk has been conducted by Williams (2003), who find that the mean SFR over the last 60 Myr for 1.4 deg2 of the M31 disk is 0.630.07 M⊙yr-1 (in the range 0.1100 M⊙) with no drastic changes. Assuming a flat SFR density over the galaxy gives an SFR of 0.048 M⊙yr-1 within the region analyzed in this paper. We used the calibration of Grimm et al. (2003) to calculate the expected number of HMXBs (see comment in Shtykovskiy & Gilfanov 2005, regarding the normalization). From this we get the expectation of 0.3 HMXBs brighter than erg s-1, and 1.2 sources brighter than erg s-1.
Alternatively we have estimated upper limits for the numbers of HMXBs from the H and FIR luminosities reported by Devereux et al. (1994). For H the combined luminosity from the nuclear region and from diffuse emission inside the star forming ring (which is at a radius of 50′, much larger than the maximum distance of 12′ analysed in this paper) is 4.3 1039 erg s-1 (corrected to our distance of 780 kpc). From Grimm et al. (2003) we find that this corresponds to 1.1 HMXBs with a luminosity above 1037 erg s-1, and 4.4 HMXBs with a luminosity above 1036 erg s-1. The FIR luminosity in this region is 5.25 108 L⊙, which corresponds to 2.0 HMXBs with a luminosity above 1037 erg s-1, and 8.0 HMXBs with a luminosity above 1036 erg s-1. It should be noted, however, that the region these luminosities are found from is much larger than the region containing our X-ray data, and that it is very likely that the main part of the light is not produced by star formation, as Devereux et al. (1994) found that for the central region the number of O-type stars is a factor of 200 lower than what would be expected if the luminosities were due to star formation. We can therefore safely ignore the contribution of HMXBs in the following analysis.
3.1.3 Background X-ray sources
To estimate the number of background sources, we use results of the CXB determination by Moretti et al. (2003). We use the source counts in the soft and hard bands (their Eq. 2) and convert the fluxes to the 0.5–8.0 keV band, assuming a powerlaw spectrum with a photon index of 1.4. For the total area of our survey of 0.126 deg2 we obtain from the source counts in the soft band 1.8 CXB sources above the flux corresponding to erg s-1, and 29 above erg s-1. From the hard band counts the predicted numbers are 1.2 and 30.5 sources. The predictions based on the soft and hard differ slightly because of the well recognized fact that source counts in different energy bands and flux regimes are dominated by different types of sources, see Voss & Gilfanov (2006). To find the total number of background sources in our source list, we multiply the CXB LF by the incompleteness function found in section 3.3, and integrate over the observed luminosity range. We find the total number of CXB sources to be 89.
3.2 The spatial distribution of the point sources
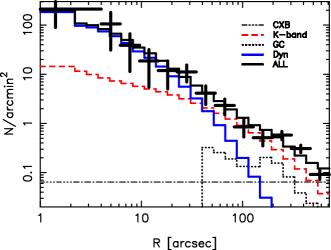
We studied the azimuthally averaged radial distribution of the X-ray point sources. As the two main contributions of sources are the LMXBs and CXBs, we model the distribution as a superposition of two functions, representing these contributions. As the spatial distribution of the globular clusters in M31 is significantly different from the mass distribution in the inner parts of the bulge, we have accounted for the globular cluster sources separately. The distribution of LMXBs is assumed to follow the K-band light, and for this the image from the 2MASS LGA was used, whereas the density of CXBs can be assumed to be flat on the angular scales under consideration here. The only free parameter of the model is the ratio of normalizations of the LMXB and CXB fraction.
The model was compared to the observations for sources more luminous than erg s-1 (Figure 1), as sources of such luminosity could be observed in the entire image without it being necessary to consider incompleteness effects. This analysis was presented in Voss & Gilfanov (2007), where the data was shown to deviate significantly from the model in the inner . It was also shown that the discrepancy could be succesfully modelled by binaries created through dynamical interactions.
In this paper we adopt the normalizations of the primordial LMXBS and CXBs found in Voss & Gilfanov (2007). Above a luminosity of 1036 erg s-1 this corresponds to 29 CXBs and 64 primordial LMXBs, as well as 20 LMXBs created via dynamical interactions in the inner bulge and 20 LMXBs in GCs. The normalization of CXBs is consistent with the expectations. From this we find that the ratio of primordial LMXBs with luminosity above 1036 erg s-1 (1037 erg s-1) to stellar mass is is 17.01.8 (8.91.6) sources per 1010 , and the ratio of primordial LMXBs to the K-band luminosity is is 19.72.1 (10.31.9) sources per 1010 . The normalization of the primordial LMXBs is about two times smaller than the number obtained by Gilfanov (2004). There are two reasons for this. 1) We removed LMXBs in GCs and in the inner bulge from the analysis, to only account for LMXBs thought to be primordial. This was not done by Gilfanov (2004). 2) We assumed the K-band mass to light ratio of the bulge of M31 to be 0.85, as compared to the ratio of 0.56 used in Gilfanov (2004).
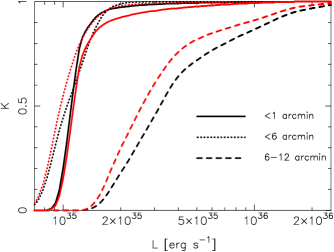
3.3 Incompleteness
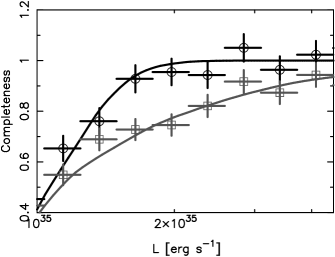
The variations of the diffuse background level and deterioration of the PSF at large off-axis angles lead to variations of the point-source sensitivity across the Chandra images. An image in which observations with different pointings are combined has very non-uniform exposure. As a result there are strong incompleteness effects at the faint end of the luminosity function. We calculate the incompleteness function for each analysed area, using the method described in Voss & Gilfanov (2006), in which the incompleteness function is calculated separately for LMXBs and for CXBs. A completeness limit is calculated for each pixel and weighted by the expected distribution of sources (using the same distributions as in section 3.2). In Figure 2 the incompleteness function is shown for both LMXBs and CXBs in 3 regions. As in Voss & Gilfanov (2006) we verified our calculated incompleteness functions by simulations of the type used by Kim & Fabbiano (2004). In each of the simulations we used Monte Carlo techniques to simulate 10 000 point sources. Each of the sources was placed on the real image of M31, according to the expected spatial distribution of the source type (LMXBs or CXBs), and our observation pipeline was applied to the image to test if the source is detected, and if so, with what luminosity. This way, the observed number of sources in a luminosity range was compared to the simulated number to determine the detection efficiency. For more details on the method, see Voss & Gilfanov (2006). The results of the simulations are compared to the calculated functions for two regions in Figure 3. We calculated the incompleteness function for GCs and GC candidates by finding the detection limit at the position of each of the GCs, and assuming the probability of containing an LMXB to be the same for all the GCs. The incompleteness functions calculated in this section will be used in the analysis of the LF of the LMXBs in section 5.
4 Transient sources
A large fraction of the sources in our sample are variable. For most
of the sources, the luminosity varies within a factor of a few.
In the combined image the luminosity is the average of the
luminosities of the single observations, weighted by the exposure.
For the sources with a low amplitude of the variability, this
weighted average is adequate for the analysis carried out in this
paper.
However, the study of Williams et al. (2006) has shown that, on average, there is one transient source per observation. In an image combined from many observations the effects of these sources on the normalization and shape of the LF are non-negligible. As the luminosity of a source is weighted by the exposure, it is straightforward that the more observations that are combined, the more transients there are, and the lower the average luminosity of each of them will seem to be. To find and investigate transient sources, we analysed each observation individually in the same way as the combined observation.
For each source it was noted for which observations it was
found and with what luminosity. If the source was not found
with wavdetect (and if the source region had any exposure)
we put the source into one of two categories.
The number of photons from the source region,
(85 per cent of PSF centered on the observed coordinates of
the full image), and background region (annulus with radius 1–3
times the source region) were counted. 95 per cent confidence
limits and were calculated on the source
counts (Gehrels 1986).
If was larger than the number of expected
background photons in the source region, scaled by exposure and
numbers of pixels from the background region, we labelled it
a low-significance source and used - as source
photons to find the luminosity.
If was lower than the expectation of background
photons, we calculated an upper limit to the luminosity from
. Based on the considerations above we divided
the sources into three types for each observation.
Type 0 is a source observed with
wavdetect, type 1 is a low-significance source, and type
2 is a source not observed, for which an upper limit is given.
In Table 3 the source type is given for the
observation with lowest luminosity for each source.
The ratio between the highest and the lowest luminosity (or upper limit) was then noted for each of the sources. We chose to label sources with a ratio 20 as transients. This gave the 28 sources listed in Table 3. Out of these, only one was actually observed at the lowest luminosity, indicating that the majority of these sources are real transients. For many of our sources, the ratio limit is set so high that if they are transients, they would not be labeled as such, due to lack of exposure. If the limit was set to be lower, however, there would be a large number of sources that are variable, but not transients, that would be included. The amplitude of the variability of a source is artificially enhanced by statistics when the number of observations is large.
| Source | high/low | max lum | high obs | low obs | type |
|---|---|---|---|---|---|
| (1) | (2) | (3) | (4) | (5) | (6) |
| 12 | 22.0 | 7.61e+36 | 1585 | 310 | 2 |
| 14 | 468.8 | 7.28e+37 | 308 | 1575 | 2 |
| 23 | 50.3 | 1.26e+37 | 4682 | 305 | 1 |
| 29 | 126.2 | 4.42e+37 | 1575 | 310 | 2 |
| 32 | 65.2 | 1.37e+37 | 4681 | 1575 | 2 |
| 38 | 99.5 | 2.28e+37 | 4679 | 303 | 2 |
| 41 | 28.3 | 3.18e+36 | 303 | 1575 | 1 |
| 44 | 35.7 | 3.22e+36 | 303 | 1575 | GCC,1 |
| 47 | 64.6 | 1.99e+37 | 4682 | 1575 | 2 |
| 51 | 87.1 | 1.11e+37 | 306 | 1575 | 2 |
| 59 | 589.0 | 4.75e+37 | 4682 | 1575 | 2 |
| 68 | 370.5 | 1.93e+37 | 310 | 1575 | 2 |
| 72 | 21.2 | 1.34e+37 | 309 | 4679 | 1 |
| 84 | 54.5 | 7.68e+36 | 1854 | 1575 | 2 |
| 85 | 79.0 | 2.56e+37 | 303 | 1585 | 1 |
| 90 | 58.6 | 5.36e+37 | 311 | 312 | 1 |
| 105 | 954.2 | 3.27e+38 | 1575 | 303 | 2 |
| 118 | 108.4 | 3.86e+37 | 4681 | 303 | 2 |
| 128 | 46.1 | 1.50e+37 | 2896 | 1575 | 2 |
| 130 | 104.4 | 1.49e+37 | 311 | 1575 | 2 |
| 136 | 92.2 | 4.55e+37 | 4682 | 305 | GCC,2 |
| 146 | 212.4 | 3.77e+37 | 4681 | 1575 | 2 |
| 155 | 96.3 | 4.48e+37 | 1585 | 1575 | GCC,0 |
| 212 | 65.2 | 2.68e+37 | 4682 | 1575 | 2 |
| 216 | 20.8 | 1.04e+37 | 1854 | 1575 | 2 |
| 234 | 66.9 | 1.18e+37 | 4682 | 2898 | 1 |
| 237 | 37.5 | 7.48e+37 | 2897 | 307 | 1 |
| 250 | 53.4 | 7.00e+37 | 2896 | 305 | GC,2 |
A catalogue of transients in M31 was published by Williams et al. (2006), and 5 further transients were found in a series of papers by the same group (e.g. Williams et al. 2005). From their lists, 36 of the sources are within the region analysed in this paper. Of these, 18 coincide with sources in our transient list. We have therefore identified 10 new sources. Of the 18 sources remaining in their source list, 5 of them were detected in our observations, but did not fulfil our criteria for being transients (they also had high/low ratios lower than 20 in Williams et al. (2006)). One source (source 214 in Table 2) was labelled a transient in their paper with a high/low ratio of 96 but only varied by a factor of 10 in our observations. The last 12 sources from their source list are not active in our observations. Trudolyubov et al. (2006) detected 4 transients with XMM-Newton. 3 of these are not active in our observations, while the fourth (source 234 in Table 2) was found to be transient in our observations, as well as by Williams et al. (2005).
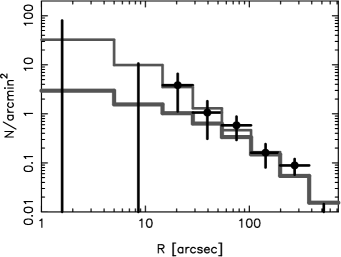
We investigated the spatial distribution of the transient
sources. In Figure 4 we compare their
radial distribution with two models: 1) the distribution of
the K-band light, representing the primordial LMXBs,
and 2) the distribution of all the observed LMXBs (all sources
with CXBs subtracted).
It can be seen that with the current set of observations, both
models can explain the distribution. With more observations it
might be possible to distinguish between the models, and thereby
learn if the ratio of transient to persistent sources is different
for primordial LMXBs and dynamically formed LMXBs.
The
number of individual observations and length of these varies strongly from
region to region, and this can have significant effects
on the observed distribution. Also inside 5″ the source
density is so high that transients could easily be missed.
5 The luminosity function of the point sources
The LF in the bulge of M31 has previously been
studied with Chandra by Kong et al. (2002, 2003); Williams et al. (2004a),
but for several reasons it is
interesting to do further work on this. The exposure of the
inner region has increased significantly since the previous
studies, and methods for incompleteness correction have been
developed. It is therefore possible to probe the LF at much
lower luminosities. Furthermore the previous studies neglected
the contribution of background sources. This can be important
for the outer parts of the bulge, where the density of LMXBs is
comparable to the density of background objects, see Figure
1.
Here we study the LF of the LMXBs in detail, statistically
taking into account the CXBs, and correcting for incompleteness
as described in section 3.3.
The LMXB LFs presented
in this section are corrected by subtracting the LF of
CXBs multiplied by the incompleteness function of the CXBs.
The normalization of the LF of CXBs was chosen as in
3.2. The LFs of the LMXBs were then corrected
by dividing by the incompleteness function of the LMXBs.
From Figure 2 it can be seen that there is
a factor of 10 difference between the sensitivity in
the regions inside 6′ and the regions outside. At the
same time the density of X-ray sources is much higher in the
inner region than
in the outside region, making the CXB contribution less
important. In the inner regions the LF can therefore be
determined directly down to a few times erg s-1.
We choose to present the
functions as differential LFs, as opposed to the cumulative LFs
often used in the literature. The advantage of this is that bins
are independent, and features in the LF are therefore more visible,
and easier to interpret.
The disadvantage is that it is necessary to bin the data.
The LFs presented below are cut off at a lower luminosity.
This luminosity corresponds to the limit at which the
incompleteness correction is for either the
CXB LF or the LMXB LF. For this reason the LFs of the
individual regions begin at different luminosities in
figures 5-10.
For each of the LFs, we give the number of sources
included in the calculations. However it should be noted
that due to the corrections for incompleteness and CXB
sources applied to the LFs, the error bars in the figures
provide better estimates for the precision of the functions.
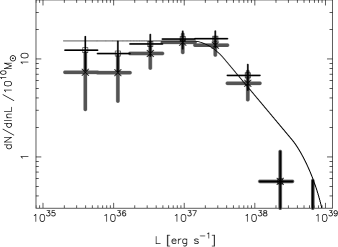
In Figure 5 we show the LF of the entire region within a distance of 12′ from the centre of M31. The squares correspond to all the sources, whereas to produce the crosses, the transient sources (Table 3) were excluded. There is a clear break at erg s-1, consistent with previous results obtained with Chandra (Kong et al. 2002, 2003; Williams et al. 2004a) as well as other X-ray telescopes (Primini et al. 1993; Shirey et al. 2001; Gilfanov 2004).
As it can be seen in Figure 5 the effect of transients is to artificially steepen the slope of the LF below erg s-1. A maximum likelihood (ML) fit by a single powerlaw in the range erg s-1 gives a slope of and with and without transients, respectively. While the difference is not statistically significant in our sample, it is a systematic effect that should not be ignored in general when studying a large number of observations combined. To avoid distortion of the LF due to transient sources, they should be excluded from the analysis, and we have done so in the rest of the analyses presented in this paper.
After the transient sources have been excluded, the faint end ( erg s-1) of the LF appears to be significantly flatter than powerlaw. This is caused by the sources located in globular clusters and in the inner bulge, thought to have dynamical origin, as the LF of these sources has a prominent fall-off at low luminosities (Figure 6). Their relative contribution to the LF increases when the transient sources are excluded. As will be shown below, the LF of the primordial sources is consistent with the general shape found by Gilfanov (2004).
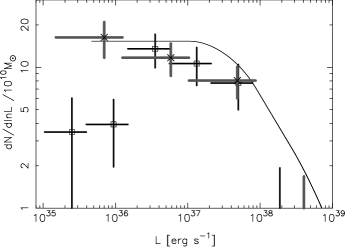
In Figure 6 the LFs of the LMXBs thought to be
created through dynamical interactions are presented. The
LMXBs from the inner 1′ of the M31 bulge are shown (crosses),
compared to the LFs of LMXBs in confirmed GCs (squares) and
GC candidates (triangles). The three LFs are consistent with
each other, and
for all three populations the number of LMXBs falls off at
luminosities below
. This is most significant
in the bulge population, which can also be observed to the lowest
luminosity level. For the GC candidate sources, the falling off
at low luminosities is hardly significant, but it is known that
the GC candidate list is contaminated by background galaxies (Galleti et al. 2004),
and with the LF of CXB sources, the effect of such a contamination
would be to raise the lower end of the LF.
In the inner 1′ of M31, as well as in the GCs, the source density is
so high that source blending can become a factor.
We performed Monte Carlo simulations of the source population in
the inner 1′ of
M31, similar to the ones performed to estimate incompleteness (see section
3.3). We assumed the average luminosity function of
Gilfanov (2004), with the normalization according to our observed number
of sources in the region, and with a lower cut-off at erg s-1
as observed, and the spatial distribution of all sources in Figure
1. From this we find that the fraction of blended sources
(parameter in appendix A) is %. For an
alternative luminosity function in which the lower cut-off is set at
erg s-1, 9-10%.
As only 20% of the GCs host LMXBs, the
fraction of blended sources is also likely to be low here ( per
cent, assuming that all GCs are identical, but the exact number
depends on the distribution of GC properties
relevant for the formation of LMXBs). For comparison one out of 12 GCs hosting
LMXBs in the Galaxy has been shown to host two LMXBs (White & Angelini 2001),
corresponding to per cent. In
appendix A we consider the effects of source blending on
the observed LF, and we show that for the values of in this range,
the effect of blending is not important.
Given the Chandra angular resolution, at the distance of M31,
all X-ray sources in a GC will be blended into
one point-like source. As there are numerous sources of low luminosity
erg s-1, this could affect our
analysis. This is not the case, however, as the luminosities of these
sources are too low. For example the combined luminosity of the
observed sources in the massive Galactic GC 47 Tucanae is
erg s-1 (Heinke et al. 2005), i.e. less than 1% of the luminosity of
a typical GC source observed in M31.
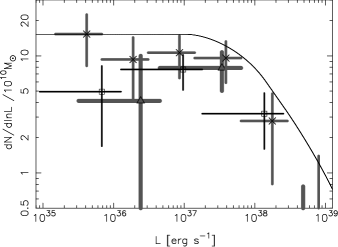
From a comparison of Figure 5 and Figure 6, it appears that the LF of the LMXBs of presumably dynamical origin is different from the average LF of all the LMXBs. We investigate this difference further in Figure 8 where we compare the LF of the dynamically formed LMXBs (sources located in the inner 1′ and in confirmed GCs) with the LF of all other sources in the 1′-9′ annulus. These are, presumably, of primordial origin. This figure confirms qualitatively the difference between the two populations. Due to rather limited numbers of sources the LFs are not very tightly constrained. In particular, the statistics is insufficient to discriminate between a genuine low-luminosity cut-off in the LF of dynamically formed sources and its moderate flattening. To estimate the statistical significance we consider the numbers of sources in different sub-populations in the erg s-1 luminosity range (the lower boundary is defined by the low bound of the primordial LF, see discussion earlier in this section). There are two sources in this luminosity range in the population of the dynamically formed LMXBs, whereas would be expected if the source counts in the erg s-1 range were extrapolated with a law. Due to nearly identical normalizations of the two LFs above (cf. Figure 8), these numbers can be directly compared with primordial sources (CXB contribution subtracted and incompleteness corrected) observed in the same luminosity range ( sources expected for extrapolation). In order to further quantify the difference between the two luminosity distributions we fit them with a single powerlaw in the 1.5 erg s-1 luminosity range, using ML fits. For the primordial sources we obtained a differential slope of , while the LF of dynamicaly formed LMXBs has a slope of 0.2. Although the difference between these two numbers is only marginally significant, the LF slope of the dynamically formed LMXBs is inconsistent with the value of obtained for the average LMXB LF.
It is interesting to compare the results with the bright (
erg s-1) LMXBs in Galactic
GCs. Currently 13 of such LMXBs have been observed in 12 GCs, and due to the
proximity the sample is believed to be complete, except for possible
future transients. While all of these sources have been observed with
Chandra, there are not published luminosities for all of them,
and analysis of the observations are beyond the scope of this paper.
Instead we find the luminosities by averaging the lightcurves for each
of the sources from RXTE ASM, over all of the observed time
(until January 1st, 2007). The count rates were converted to fluxes
in the 0.5-8.0 keV band, assuming a powerlaw spectrum with photon
index 1.7, using
PIMMS222http://cxc.harvard.edu/toolkit/pimms.jsp.
This gives a conversion factor of
1 count s erg cm-2 s-1.
In Figure 7 the LF of the LMXBs in Galactic GCs is
compared to the LF of LMXBs in confirmed GCs in M31, and it is shown
that in the Galaxy there is a clear cut-off at erg
s-1.

The difference between the LF of primordial and dynamically formed LMXBs is interesting for several reasons. It has recently been discussed whether most of the field LMXBs were actually formed in GCs (e.g. White et al. 2002; Juett 2005). If the LFs of the field and GC LMXBs are different, it is a strong indication that their origin is different as well. Moreover, the fact that the LF of the sources in the inner 1′ is consistent with the LF of the GC sources and different from the LF of the field LMXBs reinforces the conclusion of Voss & Gilfanov (2007) that the surplus X-ray sources in the center of M31 are LMXBs created through dynamical interactions in high stellar density environment of the inner bulge.
Differences between the LFs of dynamically formed LMXBs in the
globular clusters and field LMXBs have previously been reported
(Kong et al. 2002; Trudolyubov & Priedhorsky 2004) but at larger luminosities, above
erg s-1. These have been disputed in a recent thorough study of six
elliptical galaxies by Kim, E., et al. (2006), who concluded that the LFs
of the two populations are consistent. We note that the differences found
in the analysis of this paper occur at luminosities below the sensitivity
threshold of Kim, E., et al. (2006), and our results therefore do not
contradict theirs.
Various models for LMXB evolution exist, from which the shape of their luminosity distribution can be predicted. For a population of LMXBs with non-degenerate donors, the differential powerlaw slope of at luminosities below can be naturally obtained if the mass transfer is driven by gravitational radiation, as opposed to the steeper slope above erg s-1, which can be explained by the magnetic braking driven systems (Postnov & Kuranov 2005; Pfahl et al. 2003). Ultra-compact X-ray binaries (UCXB) have degenerate donor stars and the mass transfer is driven by gravitational radiation alone. In this case the reaction of the WD donor to mass loss is important for the mass transfer rates and therefore also for slope of the LF, and models have been succesful in explaining the bright end of the LMXB LF, near and above erg s-1 (Bildsten & Deloye 2004). No modeling of the fainter end of luminosity distribution for the UCXB population has been reported so far. Intuitively, one might expect that the luminosity distribution of these systems should fall off at low luminosities. Although the UCXB systems are very unlikely to contribute significantly to the bulk of fainter primordial LMXBs in the luminosity domain, their importance increases dramatically in the entire luminosity range when considering the LMXBs of dynamical origin, especially those formed in the high velocity environment of the inner bulge (Voss & Gilfanov 2007). This offers a plausible explanation for the rather peculiar shape of the luminosity distribution of the globular cluster sources and of the sources in the inner of M31. As the reaction of the WD donor to mass loss depends on the chemical composition of the WD, modeling the luminosity function at low luminosities and comparing with observations of LMXB in the inner bulge and in globular clusters in M31 and other galaxies might reveal new information on the progenitors of the UCXBs and advance our understanding of binary evolution and dynamical interactions in dense stellar environments in general.
Another factor, potentially important at low mass transfer rates, is the
thermal-viscous instability, which causes transient behaviour in LMXBs
below some critical value of the mass accretion rate
(van Paradijs 1996). Consequently, the LF of persistent sources should be
expected to have a break around this luminosity. The critical
luminosity is somewhere in the erg s-1 domain,
and depends, among other parameters, on the physical size of the
accretion disk around the compact object (King & Ritter 1998).
In this picture, if the disk instability was the reason for the
observed low luminosity cut-off observed in Figure
6, the critical luminosity for UCXBs would be
expected to be lower than for LMXBs with non-degenerate donors.
This prediction seems
to be in contrast to the result of this paper, that the LF of the
dynamically formed LMXBs (presumably having a significantly higher
fraction of UCXBs) appears to be flatter (i.e. fewer faint
systems) than the LF of the primordial LMXBs.
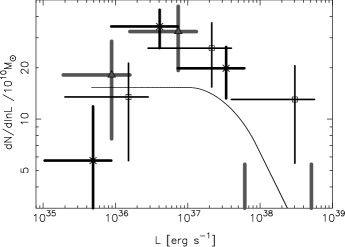
In the previous study of LMXBs in the bulge of M31
(Kong et al. 2002), it was found that their LF varied significantly with
the distance from the centre, becoming progressively steeper with
radius. We searched for the radial trend by
comparing the LFs of the primordial LMXBs (that is, with LMXBs
in GCs excluded) of the annuli
1′-3′, 3′-6′ and 6′-12′
(Figure 9),
and found no statistically significant variations.
We suggest that the difference
in the LF reported by them,
especially between their regions 2 and 3,
was caused by the contribution of CXB sources which becomes more
larger in the outer parts of the bulge
(cf. Figure 1). Note that this possibility was
also considered by Kong et al. (2002).
In Figure 10, we show the LF of transient sources. As the average luminosity is meaningless, due to its dependence on the exposure time and pattern of the observations in which the sources were found, we have chosen to use the maximum of the observed luminosities in the individual observations for each source. The LF of these sources follows the average LF of LMXBs to a minimum luminosity of 1037 erg s-1. Below this the observed distribution falls off quickly, but this is likely an artifact of the our selection criterion for transient sources, . For most sources with peak luminosities below 1037 erg s-1, it is not possible to constrain the quiescent luminosity well enough to classify the sources as transients.
6 Conclusions
We have studied the X-ray point sources in the bulge of
M31 (′) based on archival Chandra data.
Our study concentrated
on statistical properties of the population, with emphasis on the
spatial distribution and LFs of the various subpopulations. One of our
primary goals was to contrast properties of different sub-populations
of X-ray point sources, namely transient and persistent sources,
primordial LMXBs and dynamically formed ones.
To achieve this we combined 26 Chandra observations to
obtain as much
exposure as was possible and
implemented an adequate correction for
incompleteness effects, as well as for contamination from background
sources.
With a total exposure time of 201 ks, we detected 263 X-ray point sources
within a distance of 12′ from the centre of M31. Of these sources
64 were not observed previously. This allowed us
to study the sources to a minimum luminosity of erg s-1,
whereas the sample is complete above erg s-1. We
found good agreement between the observed number of sources and the
expected number, predicted
based on the K-band luminosity and average X-ray mass to
light ratio for nearby galaxies.
The radial distribution of the M31 sources (Figure 1)
can be interpreted as
superposition of the following three components:
(i) primordial LMXBs following the K-band
light profile,
(ii) LMXBs created through dynamical interactions in the inner
bulge of the galaxy, with a distribution that follows the square of the
stellar density and
(iii) LMXBs dynamically created in the
globular clusters, with a radial profile that follows the distribution of
globular clusters in M31.
Superimposed on these are the CXB
sources, the distribution of which is flat on the angular scales under
consideration.

After applying the incompleteness correction and subtracting the contribution of CXB sources, we were able to recover the LF of M31 sources down to the luminosity of erg s-1, which is a factor of 3 better than previous studies. The luminosity distribution of all X-ray sources in the bulge of M31 (Fig.5) is consistent with the average LMXB LF obtained by Gilfanov (2004), in particular, it follows the law in the faint luminosity limit, in agreement with the behaviour found earlier for LMXBs in the Milky Way and in Cen A. It was furthermore possible to divide the LMXBs into two subpopulations – primordial LMXBs and dynamically formed ones, in order to study the differences in their luminosity distributions (Figure 8). We found that the LF of the primordial LMXBs is consistent with the average LMXB LF, and is independent of the radial distance from the centre of M31, within the accuracy allowed by the statistics of our sample. The LMXBs thought to be of dynamical origin have a significantly different luminosity distribution – below their LF shows a prominent decrease towards low luminosities (Figure 6). The statistics is not sufficient to tightly constrain the shape of the LF, in particular to distinguish between a true low luminosity cut-off and a more moderate flattening of the luminosity function. It is however sufficient to claim that the low luminosity, , slope of the LF of these sources, , is inconsistent with the law.
We identified the population of transient sources and found that their radial distribution is consistent with the distribution of persistent sources. However the current statistics is insufficient to investigate differences between the fractions of transients in primordial and dynamically formed LMXBs, especially in the inner 30″, where the radial distribution of these two populations differ the most. Above erg s-1 the LF of the maximum luminosity of the transients follows the average LMXB LF (Figure 10).
Acknowledgements.
This reaserch has made use of CHANDRA archival data provided by the CHANDRA X-ray Center and data from the 2MASS Large Galaxy Atlas provided by NASA/IPAC infrared science archive, as well as ASM/RXTE data obtained through the HEASARC online service. We thank the referee for helpful remarks on the paper.References
- Bell & De Jong (2001) Bell, E., & De Jong, R. 2001, ApJ, 550, 212
- Bildsten & Deloye (2004) Bildsten, L., Deloye, C.J. 2004, ApJ, 607, L119
- Börngen (1968) Börngen, F. 1968, Astronomisch Nachrichten, 291, 19
- Braun (1990) Braun, R. AJS, 72, 761
- Ciardullo et al. (1987) Ciardullo, R., Ford, H.C., Neill, J.D., Jacoby, G.H., Shafter, A.W. 1987, ApJ, 318, 520
- Ciardullo et al. (1989) Ciardullo, R., Jacoby, G.H., Ford, H.C., Neill, J.D. 1989, ApJ, 339, 53
- Crampton et al. (1984) Crampton, D., Cowley, A.P., Hutchings, J.B., Schade, D.J., van Speybroeck, L.P. 1984, ApJ, 284, 663
- Deloye & Bildsten (2003) Deloye, C.J., Bildsten, L. 2003, ApJ, 598, 1217
- Devereux et al. (1994) Devereux, N.A., Price, R., Wells, L.A., Duric, N. 1994, AJ, 108, 1667
- Dickey & Lockman (1990) Dickey, J.M., & Lockman, F.J. 1990, ARA&A, 28, 215
- Fabbiano (2006) Fabbiano, G. 2006, ARA&A 44, 323
- Fan et al. (2005) Fan, Z., Ma, J., Zhou, X., Chen, J., Jiang, Z., Wu, Z. 2005, PASP, 117, 1236
- Galleti et al. (2004) Galleti, S., Federici, L., Bellazzini, M., Fusi Pecci, F., & Macrina, S. 2004, A&A, 416, 917
- Gehrels (1986) Gehrels, N. 1986, ApJ 303, 336
- Gelfand et al. (2004) Gelfand, J.D., Lazio, T.J.W., Gaensler, B.M. 2004, ApJS, 155, 89
- Gilfanov (2004) Gilfanov, M. 2004, MNRAS, 349, 146
- Grimm et al. (2003) Grimm, H-J., Gilfanov, M.R., & Sunyaev, R.A. 2003, MNRAS, 339, 793
- Harnden et al. (1984) Harnden, F.R., Fabricant, D.G., Harris, D.E., Schwarz, J. 1984, SAO Special Report #393
- Heinke et al. (2005) Heinke, C.O., Grindlay, J.E., Edmonds, P.D., et al. 2005, ApJ, 625, 796
- Jarret et al. (2003) Jarret, T.H., Chester, T., Cutri, R., Schneider, S., & Huchra, J.P. 2003, AJ, 125, 525
- Juett (2005) Juett, A.M. 2005, ApJ, 621, L25
- Kaaret (2002) Kaaret, P. 2002, ApJ, 578, 114
- Kim & Fabbiano (2004) Kim, D.-W., Fabbiano, G. 2004, ApJ, 611, 846
- Kim, D.-W., et al. (2006) Kim, D.-W., Fabbiano, G., Kalogera, et al. 2006, astro-ph/0606008
- Kim, E., et al. (2006) Kim, E., Kim, D.-W., Fabbiano, G., Lee, M.G., Park, H.S., Geisler, D., Dirsch, B. 2006, ApJ, 647, 276
- King & Ritter (1998) King, A.R., Ritter, H. 1998, MNRAS, 293, L42
- Kong et al. (2002) Kong, A.K.H., Garcia, M.R., Primini, F.A., Murray, S.S., Di Stefano, R., McClintock, J.E. 2002, ApJ, 577, 738
- Kong et al. (2003) Kong, A.K.H., Di Stefano, R., Garcia, M.R., Greiner, J. 2003, ApJ, 585, 298
- Macri (2001) Macri, L.M. 2001, ApJ, 549, 721
- Magnier (1993) Magnier, E.A. 1993, Ph.D. thesis, MIT
- Magnier et al. (1995) Magnier, E.A., Prins, S., van Paradijs, J. Lewin, W.H.G., Supper, R., Hasinger, G., Pietsch, W., Truemper, J. 1995, A&AS, 114, 215
- Meyssonnier et al. (1993) Meyssonnier, N., Lequeux, J., Azzopardi, M. 1993, A&AS, 102, 251
- Monet et al. (2003) Monet, D.G., Levine, S.E., Canzian, B., et al. 2003, AJ, 125, 984
- Moretti et al. (2003) Moretti, A., Campana, S., Lazzati, D., & Tagliaferri, G. 2003, ApJ, 588, 696
- Morrison et al. (2003) Morrison, J.E., Röser, S., McLean, B., Bucciarelli, B., Lasker, B. 2001, AJ, 121, 1752
- Pfahl et al. (2003) Pfahl, E., Rappaport, S., Podsiadlowski, P. 2003, ApJ, 597, 1036
- Pietsch et al. (2005a) Pietsch, W., Fliri, J., Freyberg, M.J., Greiner, J., Haberl, F., Riffeser, A., Sala, G. 2005a, A&A, 442, 879
- Pietsch et al. (2005b) Pietsch, W., Freyberg, M.J., Haberl, F. 2005b, A&A, 434, 483
- Postnov & Kuranov (2005) Postnov, K.A., Kuranov, A.G. 2005, Astro. Lett., 31, 7
- Primini et al. (1993) Primini, F.A., Forman, W., Jones, C. 1993, ApJ, 410, 615
- Shafter & Irby (2001) Shafter, A.W., Irby, B.K. 2001, ApJ, 563, 749
- Shirey et al. (2001) Shirey, R., Soria, R., Borozdin, K., et al. 2001, A&A, 365, 195
- Shtykovskiy & Gilfanov (2005) Shtykovskiy, P., & Gilfanov, M., 2005, A&A, 431, 597
- Skrutskie et al. (2006) Skrutskie, M.F., Cutri, R.M., Stiening, R. et al. 2006, AJ, 131, 1163
- Stanek & Garnavich (1998) Stanek, K.Z., & Garnavich, P.M. 1998, ApJ, 503, 131
- Trudolyubov & Priedhorsky (2004) Trudolyubov, S., Priedhorsky, W. 2004, ApJ 616, 821
- Trudolyubov et al. (2006) Trudolyubov, S., Priedhorsky, W., Cordova, F. 2006, ApJ 645, 277
- van Paradijs (1996) van Paradijs, J. 1996, ApJ, 464, L139
- Voss & Gilfanov (2006) Voss, R., & Gilfanov, M. 2006, A&A, 447, 71
- Voss & Gilfanov (2007) Voss, R., & Gilfanov, M. 2007, in preparation
- Walterbos & Kennicutt (1987) Walterbos, R.A.M., & Kennicutt, R.C. 1987, A&AS, 69, 311
- White & Angelini (2001) White, N.E., & Angelini, L. 2001, ApJL, 561, L101
- White et al. (2002) White, R.E., Sarazin, C.L., Kulkarni, S.R. 2002, ApJ, 504, L31
- Williams (2003) Williams, B.F. 2003, AJ, 126, 1312
- Williams et al. (2004a) Williams, B.F., Garcia, M.R., Kong, A.K.H., Primini, F.A., King, A.R., Di Stefano, R., Murray, S.S. 2004a, ApJ, 609, 735
- Williams et al. (2004b) Williams, B.F., Garcia, M.R., McClintock, J.E., Kong, A.K.H. 2004b, AJ, 128, 1588
- Williams et al. (2005) Williams, B.F., Garcia, McClintock, J.E., Primini, F.A., Murray, S.S., 2005, ApJ, 632, 1086
- Williams et al. (2006) Williams, B.F., Naik, S., Garcia, M.R., Callanan, P.J. 2006, ApJ, 643, 356
Appendix A The effects of source blending on the luminosity function
In densely populated regions of X-ray point sources, such as GCs or the very inner parts of a galaxy, a fraction of the observed point sources will be a blend of two or more sources. Here we present a brief investigation of the effects of such source blending on the observed LF. If the distribution of luminosities of single sources is given by , then the distribution of luminosities of a blend of two sources is given by
| (3) |
Ignoring blends of three or more sources, the observed luminosity distribution is then given by
| (4) |
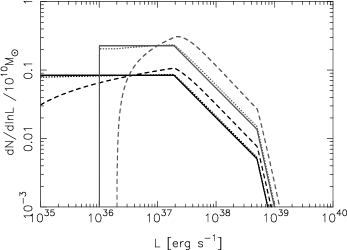
where is the fraction of observed sources that are blends of two sources. In Figure 11 we show the effects of source blending on the LMXB LF of Gilfanov (2004). The two models shown have different lower cut-off luminosities, below which the functions are set to zero, erg s-1 for the lower model and erg s-1 for the upper model (the assumed LFs are therefore equal to the LFs for which was calculated in section 5). The solid lines give , whereas the dashed lines gives . The dotted lines gives , for . It is clear that for sources samples with 0.10 the effects on the observed LF are negligible, and even for samples with higher values of , the effects are relatively small.
| Number | distance | RA | DEC | cts | corrected cts | error | luminosity | type | id | name |
|---|---|---|---|---|---|---|---|---|---|---|
| (1) | (2) | (3) | (4) | (5) | (6) | (7) | (8) | (9) | (10) | (11) |
| 1 | 1.0 | 00 42 44.37 | 41 16 08.7 | 2245 | 2580.7 | 58.0 | 7.08e+36 | r1-10 | ||
| 2 | 2.2 | 00 42 44.38 | 41 16 07.4 | 2864 | 3308.2 | 65.4 | 1.08e+37 | r1-9 | ||
| 3 | 4.0 | 00 42 44.38 | 41 16 05.4 | 1117 | 1233.9 | 41.3 | 5.32e+36 | r1-21 | ||
| 4 | 4.6 | 00 42 44.30 | 41 16 14.0 | 316 | 344.9 | 22.6 | 1.52e+36 | r1-22 | ||
| 5 | 5.4 | 00 42 43.86 | 41 16 11.1 | 225 | 244.1 | 19.2 | 1.07e+36 | r1-27 | ||
| 6 | 7.4 | 00 42 43.87 | 41 16 03.9 | 709 | 811.6 | 33.1 | 3.53e+36 | r1-23 | ||
| 7 | 9.7 | 00 42 44.68 | 41 16 18.2 | 906 | 1047.3 | 37.3 | 4.62e+36 | r1-8 | ||
| 8 | 10.6 | 00 42 45.24 | 41 16 11.1 | 456 | 516.2 | 26.8 | 2.25e+36 | r1-20 | ||
| 9 | 14.5 | 00 42 45.60 | 41 16 08.6 | 1026 | 1191.0 | 39.5 | 5.21e+36 | r1-7 | ||
| 10 | 15.3 | 00 42 45.12 | 41 16 21.7 | 3098 | 3631.2 | 67.9 | 1.61e+37 | RAD | SIM WSTB 37W135 | r1-4 |
| 11 | 20.8 | 00 42 43.88 | 41 16 29.6 | 1293 | 1463.5 | 44.5 | 6.54e+36 | r1-11 | ||
| 12 | 21.7 | 00 42 46.01 | 41 16 19.6 | 468 | 531.3 | 27.2 | 2.33e+36 | t | r1-19 | |
| 13 | 23.8 | 00 42 43.75 | 41 16 32.4 | 2329 | 2726.7 | 59.0 | 1.24e+37 | r1-12 | ||
| 14 | 24.0 | 00 42 42.18 | 41 16 08.3 | 4525 | 5353.9 | 81.6 | 2.45e+37 | t | r1-5 | |
| 15 | 25.9 | 00 42 42.48 | 41 15 53.7 | 3077 | 3601.1 | 67.6 | 1.62e+37 | PN | CIA 4 | r1-14 |
| 16 | 30.1 | 00 42 43.00 | 41 15 43.2 | 2424 | 2839.4 | 60.1 | 1.29e+37 | r1-13 | ||
| 17 | 30.6 | 00 42 46.97 | 41 16 15.6 | 4037 | 4736.5 | 77.3 | 2.07e+37 | r1-3 | ||
| 18 | 33.3 | 00 42 43.20 | 41 16 40.3 | 413 | 473.2 | 25.6 | 2.20e+36 | r1-24 | ||
| 19 | 33.5 | 00 42 46.16 | 41 15 43.2 | 372 | 427.0 | 24.3 | 1.91e+36 | r1-18 | ||
| 20 | 37.5 | 00 42 47.17 | 41 16 28.4 | 10653 | 12498.5 | 124.6 | 5.59e+37 | PN | CIA 11 | r1-2 |
| 21 | 41.0 | 00 42 42.65 | 41 16 45.9 | 38 | 33.6 | 8.8 | 1.58e+35 | X | ||
| 22 | 42.4 | 00 42 47.87 | 41 16 22.9 | 370 | 425.5 | 24.2 | 1.92e+36 | r1-17 | ||
| 23 | 44.8 | 00 42 47.88 | 41 15 49.8 | 264 | 304.3 | 20.7 | 1.40e+36 | t | r1-25 | |
| 24 | 45.0 | 00 42 42.08 | 41 15 32.0 | 366 | 417.4 | 24.2 | 2.14e+36 | r1-31 | ||
| 25 | 45.1 | 00 42 45.54 | 41 16 52.3 | 27 | 23.4 | 7.6 | 1.09e+35 | X | ||
| 26 | 47.0 | 00 42 45.09 | 41 15 23.2 | 386 | 441.1 | 24.8 | 2.05e+36 | PN | CIA 18 | r1-26 |
| 27 | 52.0 | 00 42 48.72 | 41 16 24.5 | 523 | 606.0 | 28.6 | 2.72e+36 | r1-16 | ||
| 28 | 53.3 | 00 42 40.00 | 41 15 47.5 | 4068 | 4772.3 | 77.5 | 2.32e+37 | RNova | SI 1997-06 | r1-15 |
| 29 | 53.5 | 00 42 39.59 | 41 16 14.3 | 2967 | 3500.0 | 66.4 | 1.73e+37 | t | r1-34 | |
| 30 | 53.9 | 00 42 42.53 | 41 16 59.4 | 210 | 240.8 | 18.6 | 1.11e+36 | r1-30 | ||
| 31 | 54.5 | 00 42 47.90 | 41 15 32.9 | 3265 | 3834.7 | 69.6 | 1.84e+37 | r1-6 | ||
| 32 | 55.7 | 00 42 43.79 | 41 15 14.1 | 110 | 117.5 | 13.8 | 5.69e+35 | t | r1-28 | |
| 33 | 55.8 | 00 42 41.45 | 41 15 23.8 | 471 | 540.7 | 27.2 | 2.93e+36 | GC | Bol B124 | r1-32 |
| 34 | 64.7 | 00 42 38.59 | 41 16 03.7 | 27143 | 31287.2 | 198.7 | 1.54e+38 | r2-26 | ||
| 35 | 67.8 | 00 42 48.53 | 41 15 21.2 | 12231 | 14353.6 | 133.8 | 6.74e+37 | r1-1 | ||
| 36 | 72.2 | 00 42 50.62 | 41 15 57.1 | 35 | 23.7 | 8.5 | 1.15e+35 | SNR | B90 101 | r2-56 |
| 37 | 73.4 | 00 42 39.65 | 41 17 00.7 | 35 | 33.5 | 8.4 | 1.71e+35 | K | ||
| 38 | 73.6 | 00 42 45.22 | 41 17 22.3 | 675 | 783.9 | 32.2 | 3.63e+36 | t | r2-16 | |
| 39 | 75.5 | 00 42 50.82 | 41 15 51.6 | 25 | 22.1 | 7.4 | 1.08e+35 | RNova | B68 27 | X |
| 40 | 75.7 | 00 42 38.80 | 41 15 26.2 | 35 | 29.8 | 8.5 | 1.50e+35 | r2-54 | ||
| 41 | 76.0 | 00 42 42.73 | 41 14 55.5 | 46 | 47.2 | 9.4 | 2.55e+35 | t | r2-20 | |
| 42 | 81.9 | 00 42 46.14 | 41 17 28.6 | 21 | 20.7 | 6.8 | 9.45e+34 | X | ||
| 43 | 86.8 | 00 42 42.34 | 41 14 45.5 | 1868 | 2198.5 | 53.0 | 1.18e+37 | r2-21 | ||
| 44 | 89.2 | 00 42 46.09 | 41 17 36.3 | 67 | 74.8 | 11.1 | 3.41e+35 | GCC t | Bol BH16 | r2-15 |
| 45 | 90.5 | 00 42 44.91 | 41 17 39.7 | 771 | 901.5 | 34.4 | 4.13e+36 | r2-18 | ||
| 46 | 97.2 | 00 42 52.53 | 41 15 40.0 | 2740 | 3237.8 | 63.9 | 1.51e+37 | r2-12 | ||
| 47 | 99.7 | 00 42 52.44 | 41 16 48.7 | 140 | 158.6 | 15.4 | 7.52e+35 | t | X | |
| 48 | 107.5 | 00 42 49.15 | 41 17 42.0 | 90 | 103.4 | 12.6 | 4.75e+35 | r2-41 | ||
| 49 | 113.5 | 00 42 44.63 | 41 18 02.8 | 21 | 19.9 | 6.8 | 9.00e+34 | X | ||
| 50 | 114.3 | 00 42 39.54 | 41 14 28.5 | 1169 | 1370.6 | 42.1 | 6.79e+36 | r2-25 | ||
| 51 | 116.9 | 00 42 34.78 | 41 15 23.3 | 149 | 167.8 | 15.9 | 8.27e+35 | t | r2-28 | |
| 52 | 117.8 | 00 42 33.90 | 41 16 19.8 | 1217 | 1426.2 | 42.9 | 7.25e+36 | r2-30 | ||
| 53 | 119.1 | 00 42 39.27 | 41 14 24.7 | 48 | 40.9 | 9.7 | 2.50e+35 | r2-62 | ||
| 54 | 120.0 | 00 42 54.94 | 41 16 03.2 | 11609 | 13667.2 | 130.1 | 6.21e+37 | r2-11 | ||
| 55 | 122.6 | 00 42 45.10 | 41 14 07.1 | 618 | 720.8 | 31.0 | 3.48e+36 | r2-17 | ||
| 56 | 124.3 | 00 42 52.30 | 41 17 35.0 | 122 | 137.6 | 14.5 | 6.37e+35 | r2-50 | ||
| 57 | 126.2 | 00 42 42.63 | 41 14 04.6 | 24 | 20.3 | 7.3 | 1.04e+35 | X | ||
| 58 | 130.6 | 00 42 36.05 | 41 17 41.0 | 15 | 13.0 | 6.0 | 6.04e+34 | GCC | Bol B261 | X |
| 59 | 134.3 | 00 42 33.41 | 41 17 03.5 | 196 | 225.7 | 18.0 | 1.11e+36 | t | r2-70 | |
| 60 | 134.9 | 00 42 32.53 | 41 15 45.7 | 93 | 104.1 | 12.8 | 4.91e+35 | r2-55 | ||
| 61 | 138.2 | 00 42 49.24 | 41 18 16.0 | 1627 | 1915.2 | 49.5 | 8.74e+36 | r2-14 | ||
| 62 | 140.6 | 00 42 50.25 | 41 18 13.1 | 24 | 23.5 | 7.2 | 1.10e+35 | r2-40 | ||
| 63 | 140.6 | 00 42 40.56 | 41 13 55.3 | 21 | 15.6 | 6.9 | 7.59e+34 | r2-23 | ||
| 64 | 148.9 | 00 42 31.14 | 41 16 21.7 | 7403 | 8689.1 | 104.2 | 5.21e+37 | r2-34 | ||
| 65 | 161.5 | 00 42 58.12 | 41 16 52.5 | 21 | 18.6 | 6.9 | 8.64e+34 | GCC | Bol AU010 | X |
| 66 | 162.5 | 00 42 40.22 | 41 18 45.2 | 1090 | 1278.4 | 40.8 | 6.15e+36 | r2-24 | ||
| 67 | 163.0 | 00 42 58.32 | 41 15 29.2 | 1537 | 1807.0 | 48.2 | 8.39e+36 | r2-7 | ||
| 68 | 163.9 | 00 42 34.45 | 41 18 09.8 | 94 | 105.3 | 12.9 | 5.01e+35 | t | r2-29 | |
| 69 | 163.9 | 00 42 36.61 | 41 13 50.3 | 130 | 144.9 | 14.9 | 7.06e+35 | r2-42 | ||
| 70 | 164.1 | 00 42 30.28 | 41 16 53.2 | 71 | 75.4 | 11.4 | 4.64e+35 | r2-44 | ||
| 71 | 167.1 | 00 42 40.67 | 41 13 27.4 | 1530 | 1803.7 | 48.1 | 8.75e+36 | r2-22 | ||
| 72 | 170.2 | 00 42 43.31 | 41 13 19.6 | 844 | 991.6 | 36.0 | 5.02e+36 | t | r2-19 | |
| 73 | 172.4 | 00 42 52.53 | 41 18 34.8 | 59 | 63.8 | 10.5 | 3.06e+35 | r2-49 | ||
| 74 | 175.5 | 00 42 59.87 | 41 16 05.8 | 6988 | 8269.1 | 101.4 | 3.76e+37 | GC | Bol B144 | r2-5 |
| 75 | 177.1 | 00 42 50.72 | 41 13 27.8 | 20 | 18.4 | 6.7 | 9.03e+34 | X | ||
| 76 | 185.8 | 00 42 42.24 | 41 19 13.8 | 37 | 38.7 | 8.6 | 1.83e+35 | RAD | B90 86 | r2-53 |
| 77 | 186.3 | 00 42 52.64 | 41 13 28.5 | 60 | 61.4 | 10.6 | 2.98e+35 | r2-38 | ||
| 78 | 189.2 | 00 42 52.53 | 41 18 54.4 | 13139 | 15495.8 | 138.6 | 7.47e+37 | r2-13 | ||
| 79 | 191.2 | 00 42 55.19 | 41 18 36.1 | 635 | 744.8 | 31.5 | 3.58e+36 | r2-10 | ||
| 80 | 192.4 | 00 42 54.36 | 41 13 33.9 | 30 | 28.1 | 7.9 | 1.36e+35 | X | ||
| 81 | 193.6 | 00 42 55.62 | 41 18 35.1 | 628 | 735.7 | 31.3 | 3.54e+36 | FGS | Bol B138 | r2-9 |
| 82 | 195.7 | 00 42 29.84 | 41 17 57.5 | 19 | 16.7 | 6.6 | 1.01e+35 | GC | Bol B103 | X |
| 83 | 204.1 | 00 42 51.66 | 41 13 02.9 | 260 | 297.7 | 20.6 | 1.51e+36 | r2-39 | ||
| 84 | 204.5 | 00 42 27.49 | 41 14 53.0 | 76 | 81.3 | 11.7 | 4.54e+35 | t | X | |
| 85 | 210.0 | 00 42 56.93 | 41 18 43.9 | 494 | 579.8 | 27.9 | 2.73e+36 | t | r2-8 | |
| 86 | 211.4 | 00 43 01.78 | 41 17 26.4 | 44 | 46.1 | 9.3 | 2.39e+35 | r2-46 | ||
| 87 | 211.5 | 00 42 42.82 | 41 19 40.3 | 21 | 19.7 | 6.9 | 9.46e+34 | X | ||
| 88 | 215.2 | 00 43 02.94 | 41 15 22.6 | 4541 | 5335.8 | 82.2 | 2.52e+37 | GC | Bol B146 | r2-4 |
| 89 | 216.1 | 00 42 26.57 | 41 17 31.5 | 6 | 1.1 | 4.4 | 5.89e+33 | X | ||
| 90 | 217.3 | 00 43 03.22 | 41 15 27.8 | 6398 | 7511.3 | 97.2 | 3.57e+37 | t | r2-3 | |
| 91 | 217.5 | 00 42 58.09 | 41 13 37.3 | 39 | 36.6 | 8.9 | 1.72e+35 | X | ||
| 92 | 221.0 | 00 42 32.75 | 41 13 10.9 | 1005 | 1131.2 | 39.3 | 6.11e+36 | r2-31 | ||
| 93 | 222.8 | 00 42 32.09 | 41 13 14.4 | 5162 | 6067.4 | 87.3 | 3.18e+37 | r2-32 | ||
| 94 | 222.8 | 00 42 49.03 | 41 19 45.8 | 31 | 28.6 | 8.0 | 1.41e+35 | RAD | SIM WSTB 37W138 | r2-66 |
| 95 | 224.9 | 00 43 04.25 | 41 16 01.3 | 969 | 1139.6 | 38.6 | 5.62e+36 | GCC | Fan 42 | r2-1 |
| 96 | 229.2 | 00 42 24.19 | 41 15 36.9 | 35 | 26.1 | 8.5 | 1.50e+35 | r2-52 | ||
| 97 | 229.6 | 00 42 32.09 | 41 19 13.1 | 37 | 35.0 | 8.7 | 1.70e+35 | X | ||
| 98 | 230.3 | 00 42 58.10 | 41 13 19.6 | 34 | 31.8 | 8.4 | 1.50e+35 | X | ||
| 99 | 232.6 | 00 43 01.71 | 41 18 14.5 | 31 | 26.6 | 8.0 | 1.33e+35 | r2-47 | ||
| 100 | 234.4 | 00 43 01.12 | 41 13 51.6 | 242 | 270.6 | 19.9 | 1.27e+36 | r2-37 | ||
| 101 | 235.1 | 00 42 30.96 | 41 19 10.1 | 104 | 117.9 | 13.5 | 6.95e+35 | r2-43 | ||
| 102 | 240.7 | 00 42 24.24 | 41 17 31.5 | 44 | 38.9 | 9.3 | 2.19e+35 | r2-57 | ||
| 103 | 243.2 | 00 42 22.96 | 41 15 35.3 | 13877 | 16254.1 | 142.4 | 9.59e+37 | r3-39 | ||
| 104 | 244.6 | 00 43 01.72 | 41 18 35.5 | 28 | 24.1 | 7.7 | 1.24e+35 | X | ||
| 105 | 246.8 | 00 43 05.68 | 41 17 02.7 | 18818 | 21892.3 | 166.0 | 1.05e+38 | t | r2-67 | |
| 106 | 248.9 | 00 43 03.87 | 41 18 04.9 | 4658 | 5511.9 | 83.1 | 2.81e+37 | GC | Bol B148 | r2-2 |
| 107 | 251.0 | 00 42 44.40 | 41 11 58.4 | 488 | 571.2 | 27.7 | 4.36e+36 | r3-30 | ||
| 108 | 253.7 | 00 42 47.24 | 41 11 57.9 | 159 | 181.2 | 16.4 | 1.34e+36 | r3-27 | ||
| 109 | 254.3 | 00 42 24.16 | 41 14 15.3 | 22 | 19.9 | 7.0 | 1.21e+35 | X | ||
| 110 | 255.9 | 00 42 31.26 | 41 19 38.9 | 2884 | 3395.5 | 65.6 | 2.01e+37 | GC | Bol B107 | r2-33 |
| 111 | 256.9 | 00 42 59.66 | 41 19 19.3 | 6646 | 7851.7 | 98.9 | 3.94e+37 | GC | Bol B143 | r2-6 |
| 112 | 257.4 | 00 42 21.49 | 41 16 01.3 | 4270 | 5026.6 | 79.5 | 3.20e+37 | r3-42 | ||
| 113 | 257.6 | 00 42 35.22 | 41 20 05.7 | 1496 | 1753.5 | 47.6 | 9.10e+36 | r2-27 | ||
| 114 | 259.1 | 00 43 02.92 | 41 18 41.5 | 22 | 14.3 | 7.1 | 7.30e+34 | X | ||
| 115 | 260.3 | 00 42 21.29 | 41 15 48.8 | 21 | 15.5 | 6.9 | 1.09e+35 | RAD | B90 65 | X |
| 116 | 262.3 | 00 42 25.15 | 41 13 40.6 | 614 | 712.8 | 31.0 | 4.44e+36 | r2-45 | ||
| 117 | 262.5 | 00 42 21.80 | 41 15 02.7 | 32 | 29.1 | 8.1 | 1.89e+35 | X | ||
| 118 | 266.2 | 00 42 56.04 | 41 12 18.4 | 537 | 634.5 | 29.0 | 4.53e+36 | t | r2-71 | |
| 119 | 267.5 | 00 42 48.29 | 41 20 33.1 | 24 | 22.6 | 7.2 | 1.11e+35 | X | ||
| 120 | 267.9 | 00 42 23.16 | 41 14 07.5 | 1223 | 1435.2 | 43.2 | 8.95e+36 | r3-38 | ||
| 121 | 269.0 | 00 42 59.52 | 41 12 42.3 | 173 | 191.7 | 17.1 | 9.62e+35 | r2-48 | ||
| 122 | 270.0 | 00 42 54.79 | 41 20 12.2 | 21 | 17.9 | 6.9 | 8.95e+34 | X | ||
| 123 | 271.5 | 00 42 44.85 | 41 11 38.0 | 2955 | 3465.1 | 66.5 | 2.53e+37 | r3-29 | ||
| 124 | 271.9 | 00 42 57.17 | 41 19 59.5 | 24 | 19.7 | 7.3 | 9.79e+34 | X | ||
| 125 | 277.1 | 00 42 26.05 | 41 19 15.0 | 1447 | 1697.3 | 46.9 | 9.40e+36 | GC | Bol B096 | r2-36 |
| 126 | 278.9 | 00 42 21.57 | 41 14 19.7 | 684 | 800.4 | 32.6 | 5.30e+36 | r3-41 | ||
| 127 | 279.8 | 00 42 31.32 | 41 20 07.9 | 111 | 121.3 | 13.9 | 7.27e+35 | r2-51 | ||
| 128 | 284.0 | 00 43 07.12 | 41 18 10.2 | 166 | 184.7 | 16.8 | 9.91e+35 | Nova t | PIE RJC 99 Jul 98 | r3-115 |
| 129 | 285.4 | 00 42 20.85 | 41 17 56.7 | 33 | 31.4 | 8.2 | 1.85e+35 | X | ||
| 130 | 287.6 | 00 42 21.09 | 41 18 08.6 | 81 | 87.7 | 12.1 | 5.13e+35 | t | r3-43 | |
| 131 | 289.5 | 00 42 28.30 | 41 12 23.1 | 6286 | 7379.4 | 96.2 | 5.72e+37 | r2-35 | ||
| 132 | 291.5 | 00 42 22.44 | 41 13 34.1 | 2253 | 2642.2 | 58.2 | 1.70e+37 | r3-40 | ||
| 133 | 294.7 | 00 42 33.82 | 41 20 39.3 | 27 | 25.3 | 7.6 | 1.33e+35 | X | ||
| 134 | 297.5 | 00 42 58.61 | 41 11 59.5 | 28 | 26.5 | 7.7 | 1.72e+35 | r2-59 | ||
| 135 | 297.6 | 00 42 41.65 | 41 21 05.5 | 450 | 522.2 | 26.7 | 3.64e+36 | r3-31 | ||
| 136 | 298.2 | 00 42 47.83 | 41 11 13.9 | 168 | 189.4 | 16.8 | 1.50e+36 | GCC t | Bol B128 | X |
| 137 | 300.6 | 00 42 59.02 | 41 11 58.8 | 33 | 32.8 | 8.2 | 2.14e+35 | r2-58 | ||
| 138 | 301.6 | 00 42 20.85 | 41 13 44.5 | 27 | 23.2 | 7.6 | 1.62e+35 | X | ||
| 139 | 306.8 | 00 43 10.62 | 41 14 51.4 | 14308 | 16890.8 | 144.8 | 8.99e+37 | GC | Bol B153 | r3-15 |
| 140 | 307.1 | 00 42 50.02 | 41 11 09.1 | 93 | 98.7 | 12.9 | 7.51e+35 | r3-24 | ||
| 141 | 308.9 | 00 42 41.12 | 41 11 02.6 | 30 | 25.9 | 8.0 | 2.07e+35 | r3-32 | ||
| 142 | 311.2 | 00 42 46.94 | 41 21 19.2 | 214 | 243.8 | 18.8 | 1.71e+36 | r3-28 | ||
| 143 | 311.9 | 00 42 18.43 | 41 17 59.6 | 8 | 0.8 | 4.9 | 5.37e+33 | X | ||
| 144 | 312.2 | 00 43 06.80 | 41 19 11.6 | 89 | 83.8 | 12.7 | 3.98e+35 | EXT | Source 231 | r3-67 |
| 145 | 312.9 | 00 42 16.55 | 41 16 10.7 | 30 | 27.5 | 7.9 | 1.90e+35 | r3-75 | ||
| 146 | 313.5 | 00 42 17.04 | 41 15 08.2 | 261 | 299.0 | 20.6 | 2.19e+36 | t | r3-46 | |
| 147 | 314.6 | 00 43 06.75 | 41 19 16.6 | 100 | 97.3 | 13.3 | 4.73e+35 | EXT | Source 160 | r3-67 |
| 148 | 316.2 | 00 42 18.65 | 41 14 01.9 | 5388 | 6324.4 | 89.2 | 4.69e+37 | GC | Bol B086 | r3-44 |
| 149 | 318.6 | 00 42 16.09 | 41 15 53.3 | 37 | 36.6 | 8.6 | 2.80e+35 | r3-76 | ||
| 150 | 318.9 | 00 42 47.88 | 41 10 53.1 | 54 | 56.4 | 10.1 | 4.71e+35 | r3-26 | ||
| 151 | 320.1 | 00 43 02.44 | 41 12 03.1 | 54 | 55.6 | 10.1 | 4.05e+35 | r3-68 | ||
| 152 | 321.4 | 00 42 20.48 | 41 13 13.2 | 34 | 27.6 | 8.4 | 2.03e+35 | r3-89 | ||
| 153 | 327.9 | 00 43 11.37 | 41 18 09.9 | 317 | 360.6 | 22.7 | 1.93e+36 | r3-14 | ||
| 154 | 330.4 | 00 42 15.69 | 41 17 21.0 | 2105 | 2476.8 | 56.2 | 1.69e+37 | r3-47 | ||
| 155 | 335.1 | 00 43 09.85 | 41 19 00.9 | 1328 | 1559.0 | 45.0 | 8.29e+36 | GCC t | Fan 44 | r3-16 |
| 156 | 335.6 | 00 42 27.71 | 41 20 48.1 | 68 | 68.7 | 11.2 | 4.54e+35 | r3-37 | ||
| 157 | 338.5 | 00 42 40.68 | 41 10 33.4 | 154 | 167.0 | 16.2 | 1.35e+36 | GC | Bol B123 | r3-34 |
| 158 | 339.3 | 00 43 13.88 | 41 17 12.2 | 70 | 64.0 | 11.4 | 3.59e+35 | r3-12 | ||
| 159 | 340.2 | 00 43 08.64 | 41 12 48.4 | 1109 | 1292.5 | 41.2 | 6.86e+36 | r3-17 | ||
| 160 | 341.1 | 00 42 57.91 | 41 11 04.8 | 4128 | 4861.9 | 78.4 | 3.65e+37 | r3-22 | ||
| 161 | 341.5 | 00 43 14.38 | 41 16 50.2 | 119 | 121.6 | 14.5 | 6.61e+35 | r3-11 | ||
| 162 | 343.1 | 00 42 50.76 | 41 10 34.1 | 48 | 46.0 | 9.7 | 3.58e+35 | GCC | Bol BH18 | r3-71 |
| 163 | 344.5 | 00 43 03.02 | 41 20 42.0 | 302 | 344.7 | 22.1 | 1.96e+36 | PN | CIA 165 | r3-21 |
| 164 | 344.7 | 00 42 52.26 | 41 21 42.3 | 27 | 23.7 | 7.6 | 1.75e+35 | X | ||
| 165 | 346.2 | 00 42 15.24 | 41 18 01.3 | 190 | 210.4 | 17.8 | 1.48e+36 | r3-49 | ||
| 166 | 348.8 | 00 43 13.23 | 41 18 13.5 | 418 | 473.5 | 25.8 | 2.67e+36 | RNova | CFN 26 | r3-13 |
| 167 | 350.4 | 00 42 16.98 | 41 18 56.4 | 54 | 51.6 | 10.2 | 3.24e+35 | r3-91 | ||
| 168 | 350.6 | 00 42 33.46 | 41 21 38.0 | 49 | 45.2 | 9.8 | 3.83e+35 | FGS | Bol B113 | X |
| 169 | 352.7 | 00 42 13.07 | 41 16 27.9 | 79 | 80.3 | 12.0 | 5.72e+35 | r3-53 | ||
| 170 | 358.9 | 00 42 34.17 | 41 21 49.7 | 267 | 302.6 | 20.9 | 2.38e+36 | r3-35 | ||
| 171 | 361.8 | 00 43 16.35 | 41 16 30.5 | 30 | 20.4 | 8.0 | 1.39e+35 | X | ||
| 172 | 362.0 | 00 43 07.50 | 41 20 19.9 | 550 | 632.5 | 29.4 | 3.51e+36 | GCC | Bol B150 | r3-18 |
| 173 | 366.3 | 00 42 40.73 | 41 10 05.3 | 33 | 25.8 | 8.3 | 2.24e+35 | X | ||
| 174 | 366.5 | 00 42 11.99 | 41 16 48.7 | 402 | 458.1 | 25.3 | 3.31e+36 | r3-55 | ||
| 175 | 368.7 | 00 42 40.92 | 41 22 16.1 | 52 | 48.9 | 10.0 | 3.51e+35 | r3-33 | ||
| 176 | 369.4 | 00 42 19.01 | 41 20 04.3 | 63 | 58.3 | 10.9 | 3.53e+35 | r3-90 | ||
| 177 | 369.5 | 00 42 18.37 | 41 12 23.8 | 3119 | 3651.3 | 68.2 | 3.50e+37 | r3-45 | ||
| 178 | 372.3 | 00 43 01.70 | 41 10 52.9 | 48 | 43.8 | 9.7 | 3.55e+35 | r3-96 | ||
| 179 | 378.3 | 00 42 12.18 | 41 17 58.7 | 1554 | 1800.7 | 48.5 | 1.20e+37 | GCC | Bol B078 | r3-54 |
| 180 | 378.6 | 00 43 03.31 | 41 21 21.7 | 1486 | 1745.3 | 47.5 | 1.34e+37 | FGS | Bol B147 | r3-19 |
| 181 | 380.7 | 00 42 13.16 | 41 18 36.5 | 6027 | 7031.2 | 94.3 | 4.91e+37 | FGS | Cra 13 | r3-52 |
| 182 | 383.1 | 00 43 15.06 | 41 13 26.6 | 44 | 31.8 | 9.4 | 1.82e+35 | X | ||
| 183 | 385.5 | 00 43 14.18 | 41 13 02.0 | 51 | 35.7 | 10.0 | 2.04e+35 | X | ||
| 184 | 388.1 | 00 42 10.29 | 41 15 09.9 | 555 | 640.8 | 29.5 | 4.99e+36 | r3-58 | ||
| 185 | 389.2 | 00 43 16.10 | 41 18 41.3 | 411 | 469.3 | 25.6 | 3.35e+36 | r3-9 | ||
| 186 | 390.0 | 00 42 49.36 | 41 22 35.2 | 45 | 38.4 | 9.4 | 2.99e+35 | X | ||
| 187 | 392.9 | 00 42 15.14 | 41 12 34.6 | 2746 | 3194.3 | 64.2 | 2.67e+37 | r3-50 | ||
| 188 | 393.2 | 00 42 25.35 | 41 10 39.4 | 33 | 16.3 | 8.4 | 1.59e+35 | X | ||
| 189 | 396.2 | 00 43 14.60 | 41 19 30.5 | 61 | 49.2 | 10.8 | 2.82e+35 | X | ||
| 190 | 403.9 | 00 42 09.51 | 41 17 45.6 | 1077 | 1244.1 | 40.6 | 8.92e+36 | GCC | Mita 140 | r3-59 |
| 191 | 404.3 | 00 42 54.26 | 41 09 41.0 | 29 | 22.5 | 7.9 | 1.91e+35 | X | ||
| 192 | 411.3 | 00 42 28.22 | 41 10 00.4 | 1989 | 2316.9 | 54.8 | 2.45e+37 | r3-36 | ||
| 193 | 411.5 | 00 42 12.69 | 41 12 44.1 | 62 | 51.9 | 10.9 | 4.14e+35 | r3-92 | ||
| 194 | 411.8 | 00 43 12.35 | 41 20 33.5 | 51 | 31.7 | 10.1 | 1.85e+35 | X | ||
| 195 | 412.7 | 00 43 03.13 | 41 10 15.6 | 561 | 643.6 | 29.7 | 5.25e+36 | GCC | Fan 37 | r3-20 |
| 196 | 417.2 | 00 42 15.51 | 41 20 31.5 | 570 | 655.6 | 29.9 | 4.67e+36 | GCC | Fan 16 | r3-48 |
| 197 | 420.2 | 00 43 21.57 | 41 15 57.4 | 52 | 37.0 | 10.1 | 2.37e+35 | r3-104 | ||
| 198 | 425.4 | 00 42 07.10 | 41 17 20.1 | 140 | 145.1 | 15.5 | 1.10e+36 | r3-79 | ||
| 199 | 426.1 | 00 42 11.00 | 41 12 48.3 | 270 | 296.3 | 21.0 | 2.34e+36 | r3-57 | ||
| 200 | 426.6 | 00 43 21.08 | 41 17 50.5 | 724 | 826.5 | 33.6 | 5.02e+36 | r3-7 | ||
| 201 | 430.6 | 00 42 07.77 | 41 18 14.9 | 4275 | 4995.6 | 79.7 | 3.72e+37 | r3-61 | ||
| 202 | 432.2 | 00 43 17.06 | 41 12 25.1 | 28 | 19.9 | 7.8 | 1.75e+35 | X | ||
| 203 | 438.5 | 00 42 32.04 | 41 23 05.5 | 68 | 66.5 | 11.3 | 5.82e+35 | r3-86 | ||
| 204 | 441.7 | 00 42 19.73 | 41 21 53.5 | 93 | 90.4 | 13.0 | 8.51e+35 | GCC | Mita 166 | r3-74 |
| 205 | 443.4 | 00 43 20.92 | 41 18 51.7 | 97 | 87.1 | 13.2 | 5.20e+35 | r3-66 | ||
| 206 | 448.6 | 00 42 59.00 | 41 09 12.6 | 43 | 32.3 | 9.3 | 2.76e+35 | X | ||
| 207 | 448.9 | 00 43 19.98 | 41 12 50.2 | 50 | 32.3 | 10. | 2.18e+35 | X | ||
| 208 | 451.6 | 00 43 15.42 | 41 11 25.3 | 167 | 182.8 | 16.8 | 1.57e+36 | GC | Bol B161 | r3-10 |
| 209 | 453.6 | 00 42 08.21 | 41 12 49.6 | 90 | 82.6 | 12.8 | 6.90e+35 | r3-93 | ||
| 210 | 453.8 | 00 42 15.06 | 41 21 21.4 | 55 | 46.2 | 10.3 | 5.13e+35 | GCC | Fan 15 | r3-51 |
| 211 | 454.4 | 00 42 04.14 | 41 15 32.6 | 164 | 174.2 | 16.7 | 1.42e+36 | r3-62 | ||
| 212 | 457.2 | 00 42 33.90 | 41 23 31.3 | 160 | 168.9 | 16.5 | 1.34e+36 | t | X | |
| 213 | 458.9 | 00 42 09.62 | 41 20 09.8 | 76 | 68.7 | 11.9 | 5.43e+35 | RAD | B90 34 | r3-102 |
| 214 | 461.6 | 00 43 18.89 | 41 20 17.0 | 170 | 169.1 | 17.0 | 1.07e+36 | r3-8 | ||
| 215 | 463.3 | 00 43 24.82 | 41 17 27.3 | 308 | 335.5 | 22.4 | 2.11e+36 | r3-6 | ||
| 216 | 463.5 | 00 42 05.72 | 41 13 29.9 | 64 | 45.6 | 11.1 | 3.86e+35 | t | r3-125 | |
| 217 | 464.3 | 00 43 19.54 | 41 20 10.1 | 94 | 80.2 | 13.1 | 4.93e+35 | X | ||
| 218 | 468.0 | 00 43 06.65 | 41 22 43.9 | 87 | 87.3 | 12.6 | 7.83e+35 | EmO | MLA 686 | r3-83 |
| 219 | 468.4 | 00 43 18.39 | 41 11 41.8 | 38 | 29.3 | 8.8 | 2.69e+35 | X | ||
| 220 | 469.6 | 00 43 22.34 | 41 12 58.3 | 61 | 42.5 | 10.8 | 2.76e+35 | r3-82 | ||
| 221 | 479.9 | 00 43 00.24 | 41 08 44.4 | 48 | 41.6 | 9.7 | 4.33e+35 | X | ||
| 222 | 480.5 | 00 43 17.95 | 41 11 14.7 | 42 | 33.0 | 9.2 | 3.33e+35 | X | ||
| 223 | 480.7 | 00 42 48.95 | 41 24 07.3 | 109 | 106.5 | 13.9 | 6.95e+35 | r3-84 | ||
| 224 | 482.1 | 00 43 24.13 | 41 13 14.3 | 79 | 60.5 | 12.1 | 4.02e+35 | r3-65 | ||
| 225 | 482.6 | 00 42 16.13 | 41 22 12.9 | 41 | 28.6 | 9.1 | 3.88e+35 | X | ||
| 226 | 484.8 | 00 42 09.10 | 41 20 48.0 | 698 | 799.3 | 33.0 | 7.81e+36 | r3-60 | ||
| 227 | 487.2 | 00 42 11.78 | 41 10 49.0 | 386 | 430.9 | 24.9 | 6.10e+36 | r3-56 | ||
| 228 | 493.0 | 00 43 18.73 | 41 21 13.8 | 48 | 41.3 | 9.7 | 4.07e+35 | X | ||
| 229 | 504.0 | 00 42 45.80 | 41 24 33.1 | 96 | 91.9 | 13.1 | 6.76e+35 | r3-72 | ||
| 230 | 507.5 | 00 43 26.34 | 41 19 11.6 | 151 | 152.5 | 16.1 | 1.25e+36 | RAD | GLG 005 | r3-64 |
| 231 | 511.2 | 00 43 27.92 | 41 18 29.9 | 583 | 654.2 | 30.3 | 5.39e+36 | SNR | B90 142 | r3-63 |
| 232 | 513.6 | 00 42 05.90 | 41 11 33.7 | 85 | 75.6 | 12.5 | 1.10e+36 | r3-80 | ||
| 233 | 521.7 | 00 42 24.51 | 41 24 01.1 | 58 | 43.6 | 10.6 | 4.12e+35 | X | ||
| 234 | 529.2 | 00 43 10.00 | 41 23 32.5 | 62 | 51.3 | 10.8 | 5.89e+35 | PN t | CIA 350 | r3-127 |
| 235 | 537.6 | 00 42 07.58 | 41 10 27.1 | 104 | 93.0 | 13.7 | 1.45e+36 | r3-94 | ||
| 236 | 548.6 | 00 42 40.98 | 41 07 02.0 | 59 | 49.5 | 10.6 | 7.54e+35 | r3-85 | ||
| 237 | 554.4 | 00 42 48.50 | 41 25 21.8 | 4302 | 5020.8 | 80.1 | 3.91e+37 | t | r3-25 | |
| 238 | 565.0 | 00 42 23.00 | 41 07 38.2 | 135 | 122.1 | 15.4 | 2.06e+36 | r3-73 | ||
| 239 | 571.6 | 00 43 33.83 | 41 14 07.3 | 70 | 46.2 | 11.5 | 4.29e+35 | X | ||
| 240 | 575.9 | 00 42 49.41 | 41 06 36.3 | 54 | 42.5 | 10.2 | 7.28e+35 | r3-98 | ||
| 241 | 585.2 | 00 43 08.89 | 41 07 34.2 | 38 | 34.9 | 8.8 | 8.72e+35 | X | ||
| 242 | 587.9 | 00 43 34.32 | 41 13 23.5 | 2185 | 2554.7 | 57.4 | 2.41e+37 | r3-2 | ||
| 243 | 589.9 | 00 43 35.92 | 41 14 32.8 | 446 | 431.6 | 27.0 | 2.54e+36 | X | ||
| 244 | 590.7 | 00 42 53.68 | 41 25 50.6 | 313 | 322.0 | 22.6 | 3.66e+36 | SNR | MG BA521 | r3-69 |
| 245 | 600.3 | 00 42 55.40 | 41 25 56.5 | 1483 | 1696.3 | 47.6 | 1.84e+37 | r3-23 | ||
| 246 | 600.7 | 00 41 51.65 | 41 14 38.7 | 385 | 426.6 | 24.9 | 5.60e+36 | r3-81 | ||
| 247 | 603.5 | 00 43 37.28 | 41 14 43.4 | 5112 | 5992.7 | 87.0 | 5.65e+37 | GC | Bol B185 | r3-1 |
| 248 | 617.2 | 00 42 26.26 | 41 25 52.2 | 581 | 660.6 | 30.2 | 9.26e+36 | EmO | W2 | r3-87 |
| 249 | 627.5 | 00 41 50.35 | 41 13 36.3 | 209 | 208.4 | 18.7 | 3.21e+36 | r3-110 | ||
| 250 | 627.5 | 00 43 14.38 | 41 07 21.6 | 1405 | 1650.1 | 46.2 | 6.12e+37 | GC t | Bol B158 | r3-112 |
| 251 | 630.4 | 00 42 51.60 | 41 26 34.5 | 95 | 100.0 | 13.0 | 1.47e+36 | RAD | GLG 011 | r3-70 |
| 252 | 634.1 | 00 43 32.38 | 41 10 41.0 | 1298 | 1503.3 | 44.5 | 3.12e+37 | r3-3 | ||
| 253 | 642.2 | 00 43 14.59 | 41 25 13.5 | 94 | 79.2 | 13.1 | 8.89e+35 | GC | Bol B159 | r3-105 |
| 254 | 645.6 | 00 43 33.58 | 41 21 39.1 | 70 | 73.3 | 11.4 | 1.38e+36 | X | ||
| 255 | 646.9 | 00 42 37.97 | 41 05 26.5 | 60 | 36.4 | 10.8 | 1.32e+36 | r3-100 | ||
| 256 | 660.4 | 00 43 41.75 | 41 14 00.9 | 79 | 50.7 | 12.2 | 5.81e+35 | X | ||
| 257 | 669.7 | 00 42 32.82 | 41 27 06.5 | 26 | 18.0 | 7.5 | 3.02e+35 | X | ||
| 258 | 676.4 | 00 42 10.90 | 41 06 47.8 | 151 | 103.2 | 16.4 | 1.95e+36 | r3-78 | ||
| 259 | 685.1 | 00 42 20.57 | 41 26 40.2 | 170 | 182.6 | 17.0 | 3.49e+36 | EmO | W2 | K |
| 260 | 691.1 | 00 41 55.15 | 41 23 02.8 | 87 | 57.2 | 12.8 | 2.40e+36 | r3-108 | ||
| 261 | 706.9 | 00 43 43.94 | 41 12 31.9 | 120 | 108.7 | 14.6 | 1.70e+36 | RAD | B90 166 | X |
| 262 | 715.3 | 00 42 28.98 | 41 04 35.4 | 785 | 807.6 | 35.1 | 2.45e+37 | r3-111 | ||
| 263 | 718.2 | 00 42 44.29 | 41 28 07.6 | 84 | 71.5 | 12.4 | 1.17e+36 | X |
(1) – The sequence number; (2) – Distance to the centre in arcsec; (3),(4) – Right ascension and declination of source; (5) – Source counts; (6) – Source counts after background subtraction; (7) – Statistical error on source counts after background subtraction; (8) – X-ray luminosity, 0.5-8 keV, assuming 780 kpc distance; (9) – Source Type: GC – confirmed globular cluster, GCC – globular cluster candidate, PN – planetary nebula, FGS – foreground star, Nova – nova, Rnova – Nova (random match), EmO – emission line object, RAD – radio source, SNR – supernova remnant, EXT – extended source, t – transient source; (10) – precise identification and reference: Bol – Galleti et al. (2004), Fan – Fan et al. (2005), Mita – Magnier (1993), MLA – Meyssonnier et al. (1993), W2 – Williams et al. (2004b), CIA – Ciardullo et al. (1989), CFN – Ciardullo et al. (1987), PIE – Pietsch et al. (2005a), SI – Shafter & Irby (2001), B68 – Börngen (1968), SIM – Simbad, GLG – Gelfand et al. (2004), B90 – Braun (1990), MG – Magnier et al. (1995), Cra – Crampton et al. (1984); (11) – Source name in Kong et al. (2002), Williams et al. (2004a) and Williams et al. (2006); Sources not included in these catalogues are marked with K if observed in Kaaret (2002), else with X, indicating that these are new sources.