Red Supergiants in the Disk of M81: Tracing the Spatial Distribution of Star Formation 25 Million Years in the Past 11affiliation: This publication makes use of data products from the Two Micron All Sky Survey, which is a joint project of the University of Massachusetts and the Infrared Processing and Analysis Center/California Institute of Technology, funded by the National Aeronautics and Space Administration and the National Science Foundation.
Abstract
Near-infrared images, obtained with the CFHTIR imager on the Canada-France-Hawaii Telescope, are used to investigate the brightest red stars in the disk of the nearby spiral galaxy M81. Red supergiants (RSGs) form a well-defined sequence on the color-magnitude diagrams (CMDs) that peaks near M; RSGs with this peak brightness are seen throughout all fields that were studied, indicating that star formation occured over a large part of the M81 disk only Myr in the past. The number of RSGs per unit integrated band light is compared at various locations in the disk. The number density of bright RSGs is similar in three of four fields, indicating that the bright RSGs tend to be well mixed with the older stellar populations that dominate the integrated light in the band. However, the density of bright RSGs in a northern disk field is higher than average, suggesting that the SFR in this part of the disk was higher than average Myr in the past. The northern disk field contains areas of on-going star formation, and it is suggested that it is a region of prolonged star-forming activity. The number density of RSGs that formed during the past Myr at galactocentric distances between and 7 kpc is also comparable with that which formed between and 10 kpc. We conclude that star-forming activity in M81 during the past Myr (1) was distributed over a larger fraction of the disk than it is at the present day, and (2) was not restricted to a given radial interval, but was distributed in a manner that closely followed the stellar mass profile. Star counts indicate that the mean SFR of M81 between 10 and 25 Myr in the past was M⊙ year-1, which is not greatly different from the present day SFR estimated from H and FUV emission.
1 INTRODUCTION
It is currently thought that large galaxies formed through the progressive merging of smaller units. The rate of galaxy assembly via merger activity was undoubtedly much higher during early epochs than at the present day, due to the higher density of objects. The intense merger activity that likely occured during early epochs is associated with the formation of spheroidal systems, and the luminosity-weighted old ages of the central regions of bulges (e.g. Sarzi et al. 2005) is consistent with this expectation. In contrast, disk formation may have been a more extended process, that continued to comparatively recent epochs (e.g. Hammer et al. 2004).
If the hierarchal merging model is correct then we would expect to see evidence of significant interactions between nearby spiral galaxies and their satellites. In fact, there are indications that the Milky-Way has interacted with, or is interacting with, some of its satellites. Tidal streams and related structures have been found in the outer regions of the Milky-Way (e.g. Ibata et al. 2001; Martinez-Delgado et al. 2001; Ibata et al. 2003), and it has been suggested that some Galactic globular clusters formed in dwarf galaxies (Bellazzini, Ferraro, & Ibata 2003; MacKey & Gilmore 2004), that have since been accreted by the Milky-Way. It has been suggested that some objects identified as globular clusters, but having extended sizes and/or evidence for complex star-forming histories, may instead be the remnants of the central cores of disrupted dwarf galaxies (Bekki & Freeman 2003; Mackey & van den Bergh 2005). Moving groups of metal-poor stars in the solar neighborhood may also be the dispersed remains of dwarf galaxies that were accreted along the disk plane (e.g. Meza et al. 2005).
Studies of the closest large external spiral galaxy have also found evidence of interactions between M31 and its satellites. Tidal structures have been discovered in the outer regions of M31 (e.g. Ibata et al. 2001; Zucker et al. 2004), and there are indications that many of the globular clusters in M31 may have formed in a system that had a chemical enrichment history that was distinct from that of the main body of the present-day galaxy (Beasley et al. 2005). There is also a population of objects that may be the remnants of disrupted systems (e.g. Bekki & Chiba 2004; Huxor et al. 2005). As has been suggested for the Milky-Way (e.g. Gilmore, Wyse, & Norris 2002), the interactions that generated the tidal streams in M31 likely occured well in the past, as they do not contain stars younger than 2.5 Gyr (Ferguson et al. 2005).
To study more recent interactions it is necessary to move beyond the Local Group. The star-forming galaxies NGC 3077 and M82 have been interacting with M81, which is the closest Sb galaxy after M31, for at least a few 100 Myr (e.g. Brouillet et al. 1991; Yun, Ho, & Lo 1994) and possibly for longer than 1 Gyr (Parmentier, de Grijs, & Gilmore 2003). The interactions continue to this day, with gas streams linking M81, NGC 3077, and M82 (Yun et al. 1994) and other members of the group (e.g. Boyce et al. 2001). Tidal interactions have affected the gas distribution in M81, with HI emerging from the south and east sides of the galaxy.
The interactions that induced star formation in M82 and NGC 3077 would also be expected to fuel elevated star formation rates (SFRs) in M81. Gordon et al. (2004) reviewed multi-wavelength observations of M81, spanning the far-ultraviolet to the radio, to compare various star formation indicators. These indicators probe relatively recent (i.e. within the past Myr) star-forming activity, and indicate that star formation is presently concentrated at intermediate galactocentric radii in the northern, western, and southern portions of M81. The SFR at the present day in M81 is M⊙ year-1 (Bell & Kennicutt 2001), which is roughly a third that in M31 (Williams 2003).
Efforts to probe star-forming activity in M81 during earlier epochs are of interest, as the interactions with NGC 3077 and M82 were likely more intense in the past. For example, the age distribution of star clusters in M82 suggest that the SFR in that galaxy peaked Gyr in the past (Parmentier et al. 2003). In fact, evidence for vigorous star formation in M81 during the past 1 Gyr is seen. Chandar, Ford, & Tsvetanov (2001) find compact clusters with blue B-V colors that extend out to galactocentric distances of at least Rkpc, and Chandar, Tsvetanov, & Ford (2001) estimate that these clusters have ages between 6 and 600 Myr. Swartz et al. (2003) find a population of centrally-concentrated low-mass x-ray binaries with an age of Myr, indicating that there was a significant episode of star formation in the M81 bulge during the past few hundred million years; residual star-forming activity might still be occuring near the center of M81 (Davidge & Courteau 1999).
Interactions between a large galaxy and its companions might also result in the formation of dwarf galaxies if gas that is pulled from the disk by tidal interactions cools sufficiently to form stars (e.g. Kroupa 1998), and it has been suggested that some dwarf galaxies that are close to M81 may have formed in this way. Based on its dynamical age, van Driel et al. (1998) argue that the Garland formed out of tidal material, while Boyce et al. (2001) suggest that some dwarf systems in the M81 group that are embedded in HI streams may have recently condensed out of this material. Makarova et al. (2002) examine the resolved stellar contents of four systems associated with tidal streams in the M81 group, and conclude that these may have condensed from tidal material during the past few hundred Myr. Sun et al. (2005) find possible evidence for a diffuse stellar component in the M81 group, which is likely tidal in origin.
As noted by Chandar et al. (2002), that the youngest compact clusters in the disk of M81 have ages of only 6 Myr suggests that vigorous star formation occured in M81 during the not-to-distant past. The star-forming history of a galaxy during the past few tens of millions of years can be probed by investigating the properties of RSGs. In the current paper, near-infrared images obtained with two instruments on the Canada-France-Hawaii Telescope (CFHT) are used to investigate the RSG and bright AGB content in the disk of M81. Observations in the near-infrared are important for studying and characterizing RSGs and AGB stars, as these objects form near-vertical sequences on infrared CMDs. Not only does this increase the contrast with respect to the fainter, predominantly blue, stellar substrate of the M81 disk, but it also simplifies the task of identifying the peak brightness of these components.
The main dataset used in this investigation was obtained with the CFHTIR imager, and consists of moderately deep images of four different locations in the M81 disk at intermediate galactocentric radii. Supplemental observations of a sub-region within one of the CFHTIR fields were obtained with the Canada-France-Hawaii Telescope (CFHT) adaptive optics (AO) system and KIR imager. The observations and the procedures used to process the data are described in §2. The photometric measurements and the CMDs are discussed in §3, while the specific frequency of RSGs and AGB stars, which is the number of these stars per unit integrated brightness per magnitude interval, is examined in §4. A summary and discussion of the results follows in §5.
2 OBSERVATIONS & REDUCTIONS
2.1 CFHTIR Data
Four fields that sample the outer disk of M81 were observed with the CFHTIR imager during the nights of November 21, 22, and 23 2002. The CFHTIR contains a HgCdTe array, with each pixel subtending 0.22 arcsec on a side. A arcmin2 field is thus imaged during each exposure, and this corresponds to a projected area of kpc2 at the distance of M81, which is assumed to be 3.55 Mpc (Freedman et al. 2001) throughout this study.
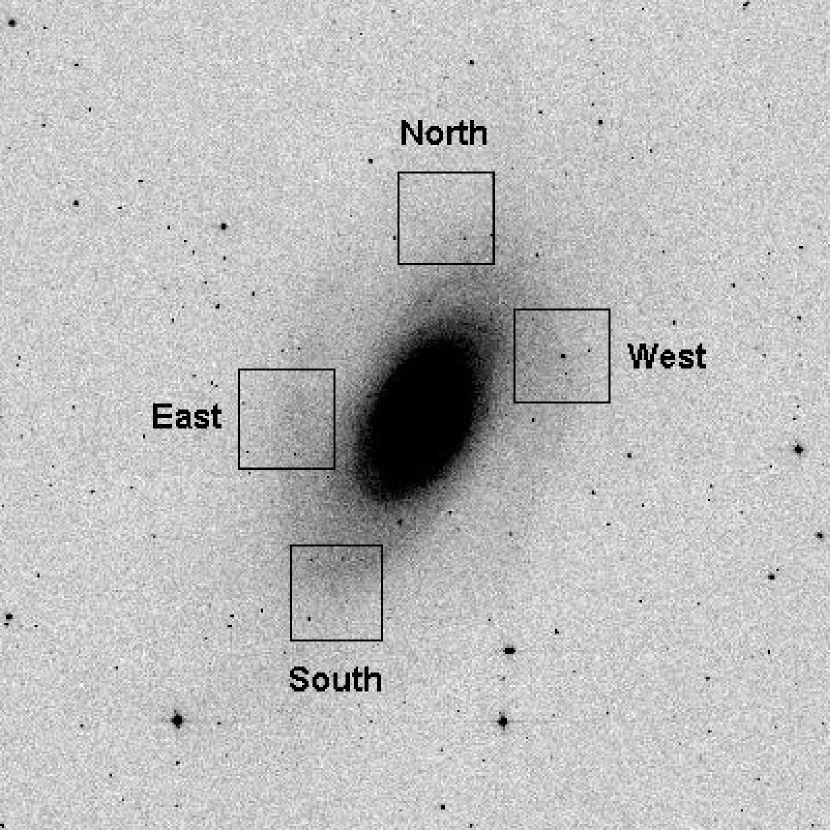
The CFHTIR images sample the spiral arms of M81 at intermediate galactocentric distances. The central co-ordinates of the fields are listed in Table 1, while their locations are indicated in Figure 1, which shows a portion of the band image of M81 from the 2MASS Large Galaxy Atlas (Jarrett et al. 2003). The data for each field were recorded as a series of second exposures at each point in a square dither pattern. All fields were observed through and filters, with a total exposure time of 12 minutes filter-1. The West field was also observed through continuum and CO filters, with a total exposure time of 12 minutes for the first filter and 18 minutes for the second.
The basic steps in the processing sequence were (1) dark subtraction, (2) division by flat-field frames, and (3) the removal of interference fringes and thermal emission from warm objects along the light path. The processed images were then spatially registered and median-combined on a field-by-field and filter-by-filter basis, after adjusting for variations in the DC sky level. The combined images of each field were then trimmed to the area common to all exposures of that field to create the final images used in the photometric analysis. Stars in the final images have FWHM between 0.7 and 1.1 arcsec FWHM.
2.2 AO Data
The area around the star GSC 04383–00308, which is at the center of the CFHTIR M81 West field, was observed with the CFHT AO system and KIR imager during the night of March 10 2001. The KIR imager contains a HgCdTe array, and each pixel subtends 0.034 arcsec on a side. The arcsec2 field that is imaged in each exposure covers a projected area of kpc2 at the distance of M81.
Images were recorded through , , and filters, with a total exposure time of 20 minutes filter-1. The CFHT AO system uses natural guide stars, and GSC 04383–00308 was used as the reference source for image corrections. The AO data were reduced using the procedures described in §2.1. The seeing was mediocre when these data were recorded, and was estimated to be 0.9 – 1.0 arcsec in . As a result, the angular resolution of the final images is poor by AO standards, with FWHM arcsec in each filter. Still, this is far superior to the angular resolution of the CFHTIR data, and the AO-corrected images are used to check if the star counts at the faint end of the CFHTIR data are affected by crowding.
3 RESULTS
The photometric measurements were obtained with the PSF-fitting routine ALLSTAR (Stetson & Harris 1988), using PSFs and star lists obtained from tasks in the DAOPHOT (Stetson 1987) package. The photometric calibration was defined using stars in the 2MASS Point Source Catalogue (Cutri et al. 2003). Only stars with were used as calibrators, as this is the magnitude range where the errors in the photometry are less than 10% in . The field-to-field scatter in the zeropoints computed individually for the North, South, and West fields is modest, with standard deviations about the mean zeropoint of mag in , mag in , and mag in . The zeropoints for the East field are magnitudes brighter than for the other fields, suggesting that thin clouds may have been present when these data were recorded.
The and CMDs of the CFHTIR fields are shown in Figures 2 and 3. The CFHTIR CMDs are similar in appearance to those of other star-forming galaxies (e.g. Davidge 2005; 2006), and four groups of sources are present: (1) foreground stars, (2) star clusters, some of which have been identified previously (§3.2), (3) RSGs, and (4) the brightest AGB stars. Foreground stars dominate the CMDs when , while globular clusters may be present over a range of brightnesses (see below). RSGs populate the vertical red sequence that runs from to , and the brightest AGB stars dominate the red clump of objects with . The CMDs of the various fields have similar appearances, and this foreshadows the main conclusion of this study, which is that the brightest evolved red stars tend to be uniformly mixed throughout the disk of M81 (§4).
Artificial star experiments were run to assess sample completeness in the CFHTIR data, which can affect field-to-field comparisons of objects near the faint limit. Artificial stars were assigned colors and brightnesses that are similar to the main locus of objects in the CMDs. These experiments reveal field-to-field differences in the magnitude at which incompleteness sets in, which are due to variations in image quality and sky transparency, with the latter likely being the dominant issue in the East field (see above). If an artificial star is assumed to be recovered if it is detected in both and , which is the criterion used to construct the LFs that serve as the basis for comparing star counts in §4, then 50 % completeness occurs when in the North and West fields. For comparison, 50% completeness occurs at in the South field, and in the East field.
The and CMDs of the AO field near the center of the CFHTIR West field are shown in the right hand panels of Figures 2 and 3. The AO data sample a much smaller field of view than the CFHTIR data, and so the number of sources in the AO-based CMDs is smaller than in the CFHTIR data. One impact of the modest sky coverage is that there is an absence of the brightest – and rarest – RSGs in the AO data, and the majority of objects in the right hand panels of Figures 2 and 3 are AGB stars.
The difference in the brightnesses of objects that are common to the CFHTIR West the AO fields were computed, and the standard deviation about the mean was found to be magnitudes in all three filters. This is an upper limit to the scatter that is due to random photometric errors, as many of the brightest AGB stars are long period variables, with amplitudes of up to magnitude in the near-infrared, and the two datasets were recorded almost twenty months apart. In fact, the artificial star experiments predict that the random uncertainities in the CFHTIR data are magnitudes for stars with between 18 and 18.5, and the predicted dispersion in the AO data is comparable to this. Consequently, much of the observed dispersion in the mean magnitude difference can be accounted for by random errors in the photometry. The comparatively good agreement between the measurements in the AOKIR and CFHTIR datasets indicates that the photometry of AGB stars in the CFHTIR data is not affected significantly by crowding.
3.1 Foreground Stars in the CFHTIR Images
The brightest RSGs in nearby galaxies have M (Rozanski & Rowan-Robinson 1994), which corresponds to at the adopted distance of M81. Few globular clusters are also brighter than M (e.g. Barmby, Huchra, & Brodie 2001). Therefore, the majority of objects with in the M81 CMDs are likely foreground stars, and this can be checked with star counts. Foreground stars will be uniformly distributed over degree scales on the sky, and their density can be measured at relatively large (i.e. a few tens of arcmin) angular offsets from M81. The density of objects with more than 20 arcmin from the center of M81 in the 2MASS Point Source Catalogue (Cutri et al. 2003) is arcmin-2, where the uncertainty is the standard deviation of measurements made in different locations. This corresponds to 4 – 5 stars per CFHTIR field. For comparison, there are 4 objects with in the East, South, and West fields, as expected if these are foreground stars, although there is only 1 star with in the North field.
The CO measurements of the M81 West field have a faint limit of , and so can be used to provide supplementary insight into the nature of the brightest objects in that field. Late-type dwarfs, which are expected to dominate the foreground star populations, have CO between 0 and 0.1 (e.g. Frogel et al. 1975). The mean CO index for objects with is , where the quoted error is the uncertainty in the mean. Thus, the brightest objects have CO indices that are consistent with them being late-type dwarfs.
3.2 Globular Clusters in the CFHTIR Images
The CFHTIR fields cover projected areas of kpc2. Given this spatial coverage, it is perhaps not surprising that a modest number of globular clusters are present in these data. Globular clusters may masquerade as bright, evolved stars, and so we examine the number of clusters that might be present and their photometric properties. This is done using the sample of objects identified by Perelmuter & Racine (1995), who used a combination of morphology and spectral-energy distributions at visible wavelengths to identify candidate clusters.
To identify candidate clusters it is assumed that the photometric properties of globular clusters in M81 are the same as those in M31, which appears to be the case based on existing spectroscopic (e.g. Perelmuter, Brodie, & Huchra 1995; Schroder et al. 2002), and photometric (Ma et al. 2005) information. The majority of globular clusters in the Milky-Way and M31 have between 2 and 2.5 (e.g. Barmby et al. 2000), and so the faint limit of the Perelmuter & Racine (1995) survey corresponds to , which is comparable to the faint limit of the CFHTIR data. Based on clusters in M31, the mean color of clusters in M81 will also be expected to be 0.67, with a standard deviation magnitudes (Barmby et al. 2000). Finally, if the M81 globular cluster luminosity function (GCLF) is like that in M31 (e.g. Barmby et al. 2001), then the peak of the M81 GCLF should occur near , with the majority of globular clusters having between 16 and 18.5. The vast majority of clusters in M81 will then likely (1) have brightnesses that fall within the detection limits of the CFHTIR data and (2) have , which is bluer than the brightest RSGs and AGB stars.
The number of objects with falling within the limits of the M31 cluster color distribution, as computed by Barmby et al. (2000), was counted in each of the CFHTIR fields. A total cluster number was then found by multiplying the result by 1.3 to account for objects with colors outside of the limits. Because the globular clusters in these fields are projected against – or seen through – the disk of M81 then they may have a range of reddenings. Two plausible extremes for are considered: (1) , which is the foreground value, and (2) , which is the mean value for objects in the M81 disk computed by Perelmuter & Racine (1995). With the lower reddening there is an average of objects per CFHTIR field, where the quoted uncertainty is the standard deviation about the mean. For the higher reddening the average number of objects is . The second number is higher than the first because there is contamination from RSGs and AGB stars. For comparison, there are 4 Perelmuter & Racine (1995) cluster candidates in the North and West fields, and 7 – 8 candidates in the East and South fields. The number of blue objects found here are thus in rough agreement with those expected if only foreground reddening is assumed. The exact number of clusters notwithstanding, it appears that globular clusters can account for many of the blue sources in the CMDs in Figures 2 and 3, and so must be considered when studying the properties of the brightest evolved stars in these data.
Samples of spectroscopically confirmed globular clusters have been discussed by Brodie & Huchra (1991), Perelmuter et al. (1995), and Schroder et al. (2002). Four of the globular clusters that were observed by Perelmuter et al. (1995) are in the East and West fields, and the infrared brightnesses and colors of these objects, along with selected entries from Table 4 of Perelmuter et al. (1995), are listed in Table 2. The colors and brightnesses in Table 2 have not been corrected for reddening.
Despite having a range of spectroscopic metallicities, the entries in Table 2 show only a modest spread in and colors, with values typical of those seen among globular clusters in other galaxies. While [Fe/H] for Id50415 and Id50552 differ by almost 3 dex, these objects have similar colors. The cluster Id50785 is bright enough to be detected in the CO observations, and the CO index is 0.19, with an estimated random error of magnitude. This is broadly consistent with the metallicity estimated for this cluster from visible light spectra.
3.3 Red Supergiants and Asymptotic Giant Branch Stars: Comparisons with Isochrones
The number of objects in the CFHTIR fields increases significantly when , as expected given the peak RSG brightness measured by Rozanski & Rowan-Robinson (1994). Thus, the majority of objects with in Figures 2 and 3 are almost certainly RSGs and – at fainter magnitudes – bright AGB stars. The red colors of the majority of objects with is consistent with them being highly evolved massive stars.
The CMDs of the East and North fields are compared with Z = 0.019 isochrones from Girardi et al. (2002) in Figure 4. A total line of sight reddening has been assumed (Perelmuter & Racine 1995), with a distance modulus of 27.75 (Freedman et al. 2001). The peak of the observed RSG sequence comes within magnitudes of matching the peak of the log(t) = 7.0 models, and the brightest RSGs have colors that agree with the log(t) = 7.0 isochrones to within magnitudes. It is also clear from Figure 4 that when M the RSG plume is populated with stars that have ages that do not exceed Myr. Thus, stars brighter than M can be used to probe the star-forming history of the galaxy during the past few tens of millions of years.
The color distribution near M widens in both fields, and RSGs and AGB stars both occur when M. The isochrones predict that these two sequences have different colors, such that the bluer stars in the CMDs are RSGs while the redder objects are evolving on the AGB. Hints of separate RSG and AGB sequences can be seen in the CMDs, although the errors in the photometry are such that it becomes difficult to distinguish between RSGs and AGB stars when M.
Older AGB stars dominate the faint end of the CMDs, forming a richly populated clump in the CMDs when . The main concentration of stars with M has an age log(t) . This age is significant, as it matches the epoch of peak star formation in M82 (Parmentier et al. 2003), which is attributed to the first interaction between M82 and M81. Thus, the CFHTIR data sample stars that span the time from within 10 Myr of the present day to the onset of interactions between M81 and its companions.
4 THE SPATIAL DISTRIBUTION AND SPECIFIC FREQUENCY OF RED SUPERGIANTS AND AGB STARS
4.1 The Spatial Distribution of RSGs
The comparisons with the isochrones in Figure 4 indicate that the majority of objects with MK between –10 and – 12 are RSGs. The spatial distribution of objects with in this brightness interval is investigated in Figure 5. The blue color cut-off was applied to avoid contamination from globular clusters. The panels in Figure 5 are positioned according to the actual location of each field on the sky, although the fields are shown 50% larger than there actual size to facilitate the identification of individual stars.
Broad trends can be seen in the spatial distribution of bright RSGs in Figure 5. In most fields there is a tendency for the number of RSGs to decrease with increasing distance from the center of M81, reflecting the overall distribution of stars in the disk. There is also a tendency for the RSGs to clump together, and a simple visual inspection suggests that this occurs on kpc spatial scales. This is not greatly different from the expected spatial distribution of stars with ages of Myr as they diffuse away from their place of birth (§5.1). The RSGs in the West field also appear to lie along a strip that runs diagonally across the field, which shows the spiral structure in this part of M81.
The evidence for the clustering of RSGs notwithstanding, the brightest RSGs appear to be distributed throughout the fields, indicating that star formation during the past 25 Myr has not been restricted to a handful of locations; the CFHTIR fields are not dominated by single star-forming regions, but sample large-scale regions of star formation. The dispersed nature of the bright RSG population, coupled with the observation that the number of RSGs in each field is roughly similar, motivates us to make a field-to-field comparison of the density of RSGs. This is done in §4.2, where the number of stars per brightness interval per unit integrated brightness, which we refer to as the specific frequency, is computed.
4.2 Field-to-field Comparisons of the Specific Frequency of RSGs
For this study, the specific frequency is defined as the number of objects per brightness interval in a system with a total integrated brightness M. The 2MASS Nearby Galaxy (Jarrett et al. 2003) band image of M81, which was smoothed with a arcsec median boxcar filter to suppress individual sources, was used to compute the total band magnitude in each field, and the results are listed in the last column of Table 1. The integrated brightnesses of the four fields agree to within a few tenths of a magnitude, and this is a consequence of the prejudiced ‘by eye’ procedure for selecting these fields, which identified regions of similar density near the edge of the M81 disk.
The specific frequencies of the brightest stars in the four fields are compared in Figure 6, which shows the MK LF of each field, as constructed from the CMDs. Objects with have not been counted to avoid contamination from globular clusters (§3.2). The LFs have been corrected for incompleteness using the results from the artificial star experiments, and the error bars show the combined uncertainties in the raw counts and the completeness corrections.
In §3.3 it was found that objects with M are expected to be RSGs, while objects with M may be either RSGs or AGB stars; these magnitude regimes are marked in Figure 6. The LFs follow a rough power-law from M to fainter magnitudes, although there is the hint of a discontinuity in the LF near , which corresponds to the clump of AGB stars that are seen at the faint end of the CMDs.
The specific frequency of RSGs is highest in the North field, where the density of objects with MK between –10 and –11.5 falls dex above the average of all four fields. While the error bars in the individual bins of the North field LF are such that the number counts do not differ significantly from that of the mean curve, the dex difference is systematic over the four bins that span the upper RSG sequence, strongly suggesting that it is not a consequence of random errors. The comparison in Figure 6 thus suggests that the SFR during the past Myr was higher in the North field than in the other fields.
The fractional contribution that AGB stars make to the star counts is expected to increase from M to –9, and the comparisons with the isochrones in Figure 4 indicate that the majority of objects in the last bin of the LFs, which have colors that are redder than those expected for RSGs, are evolving on the AGB. The rate at which AGB-tip brightness changes with age slows towards fainter magnitudes, and so the stars in the M LF bin span a wider range of ages than those in – say – the M bin. Because they contain stars covering a broader range of ages, the number counts in the faint bins probe a SFR that has been averaged over longer time scales than the LF bins that contain RSGs; thus, the faint end of the LFs in Figure 4 are less sensitive to temporal variations in the SFR, which one might expect to average out with time. In fact, there is a much smaller field-to-field dispersion in the specific frequencies of stars with M than at brighter magnitudes, as might be expected if the SFR is smoothed over long time intervals.
The specific frequencies of stars in the CFHTIR data can be checked by making comparisons with the specific frequency of stars in the AOB data, which are less prone to crowding. There are 17 stars with MK between –9.25 and –8.75 in the AOB field, which covers an area of 1150 arcsec2 in the West field. The band surface brightness in this portion of M81 was measured from the arcsec2 smoothed 2MASS band image of M81, and the specfic frequency of stars with MK between –9.25 and –8.75 is . For comparison, the specific frequency measured in the entire CFHTIR West field in this same brightness interval is , whereas the mean specific frequency in all four fields is . Thus, the specific frequency of AGB stars measured from the AOB data agrees with that measured from the CFHTIR data within the significance level.
4.3 The Specific Frequency of RSGs Within Fields
The disks of spiral galaxies appear to have age gradients, in the sense that the luminosity-weighted age becomes younger with increasing radius (e.g. Bell & de Jong 2000). Despite this trend, Davidge (2006) found that very young stars In the outer disk of NGC 247 eventually disappear at very large radii, and that beyond this point the ages of the youngest stars in a given distance interval increase with galactocentric distance. This could suggest that the SFR in the outer disk was higher in the past than at the present, or that stars that formed in the inner disk can be moved to larger radii on timescales of a few tens of Myr. To see if a similar trend occurs in M81, the East and West fields, where the greatest range of distances are sampled given the inclination of the M81 disk to the line of sight, were divided in half; in the subsequent discussion the half that is closest to the galaxy center is called the ‘inner’ portion of the field, while the half that is furthest from the galaxy center is called the ‘outer’ portion. In each field the inner portion samples galactocentric radii between 4 and 7 kpc, while the outer portion samples radii between 7 and 10 kpc.
The specific frequencies of stars in the inner and outer portions of the East and West fields are compared in Figure 7. The comparisons in Figure 7 reinforce the results from Figure 5, which indicate that RSGs are present in the outer portions of both fields; therefore, any edge to the young M81 disk occurs outside the range of radii covered in these fields. Moreover, when the summed data from the inner and outer portions of both fields are considered it can be seen that – with the exception of RSGs with M – the specific frequency of RSGs does not change with radius. The clear excess number of stars at M in the inner portion of both fields suggests that the SFR per unit disk mass was higher Myr in the past when R kpc than at larger radii.
5 DISCUSSION & SUMMARY
Near-infrared images that were recorded with the CFHT have been used to investigate the properties of RSGs and AGB stars in the disk of M81. Four fields that each subtend a projected area of kpc2 were observed. When considered together the four fields sample a total integrated brightness , which amounts to 13% of the light from M81. Thus, there is a reasonable expectation that these data sample areas that are representative of the M81 disk at intermediate galacocentric distances.
The densities of RSGs and AGB stars between and within the fields have been investigated by computing the number of objects per magnitude interval, normalized to a system with M, which is referred to as the specific frequency. RSGs with ages Myr are seen throughout the four fields. While the specific frequency of bright RSGS is similar in three of the four fields, the specific frequency of these objects is highest in the northern part of the galaxy. These results suggest that widespread star formation occured throughout much of the disk of M81 during the past Myr, with pockets of localized intense activity. This is very different from what is seen today, where star formation is clearly concentrated at intermediate distances along the spiral arms (Gordon et al. 2004).
5.1 Comparing the Locations of Star Formation in the Present and 25 Myr in the Past
Studies of resolved stars can be used to trace the star-forming histories of galaxies, and identify areas of on-going and past star formation; with information of this nature then the movement of star-forming activity throughout a galaxy can be charted. In the case of M81, widespread elevated levels of star formation are expected to have occured at the time when the interactions with M82 and NGC 3077 were most intense. Given that this likely happened at least a few hundred million years in the past and that the timescale for galaxy-wide star formation is Gyr (e.g. Efremov & Elmegreen 1998), then (1) the current SFR is almost certainly lower than the mean rate over the past few hundred million years, and (2) the areas of current active star formation may not be the same as during previous epochs.
Three of the CFHTIR fields sample areas of active star formation at the present day. The South field samples the dominant concentration of bright mid-IR flux found by Gordon et al. (2004) in the southern half of M81, and Figure 2 of Gordon et al. (2004) indicates that this is also an area of bright UV and H emission. The North field samples the portion of the northern spiral arm that is a strong source of mid-IR emission, as well as strong UV and H emission. The West field samples the next brightest region of mid-IR emission in M81, which is also an area of prominent UV and H emission. For comparison, only a few weak sources of mid-IR emission are located in the East field; while there is strong UV 1500Å emission in the East field, there is only weak emission at longer UV wavelengths and in H. The H image shown in Figure 3 of Lin et al. (2003) confirms the regions of star-forming activity indicated by the mid-IR images.
The mid-IR measurements made by Gordon et al. (2004) indicate that star formation at the present day tends to be concentrated at intermediate galactocentric radii in the northern and southern portions of M81. Boissier et al. (2003) investigated the radial distribution of matter in M81, and found that while M81 has a relatively high SFR, the radially-averaged gas density is subcritical for triggering star formation throughout the disk. The projected density of molecular material in M81 is also relatively low (Brouillet et al. 1998). The radially-averaged gas density in M81 comes closest to the critical threshold for star formation at a projected radius of kpc, and so this is where star-forming activity might be expected to peak. However, star-forming activity tends to occur at roughly one half this radius, and the areas of current star formation are likely regions where the local gas density breaches the critical threshold due to, for example, the passage of spiral density waves.
That RSGs with M are seen throughout each CFHTIR field suggests that star formation in the disk of M81 during the past Myr occured over larger areas than at present. The comparisons in Figure 6 indicate that the specific frequency of the brightest RSGs in the South, East, and West fields is very similar, indicating that the star-forming histories of these fields during the past Myr have also been similar, even though the present-day SFR in the East field appears to be much lower than in the South and West fields.
A smooth distribution of stars can be produced if they are scattered from their places of birth via interactions with massive gas clouds. However, the similar specific frequencies of bright RSGs in the East, South, and West fields is almost certainly not due to such a process. Consider the Galactic disk as an example. The velocity dispersion of solar neighborhood Cepheids, which have ages comparable to that of RSGs, is km sec-1 (Wielen 1974). Objects with this velocity will travel only kpc during 25 Myr. While the applicability of the dynamics of stars in the Galactic disk to M81 may seem dubious given the possible differences between the molecular cloud contents of the Milky-Way and M81 (Brouillet et al. 1998; Taylor & Wilson 1998), it is significant that the clustering size of bright RSGs in Figure 5 is not greatly different from the spatial scattering distance predicted from Milky-Way Cepheids.
Unless RSGs in the disk of M81 are dispersed much more quickly than stars in the Galactic disk then the uniform specific frequency of RSGs in three of the four CFHTIR fields suggests that the local SFR in the disk of M81 at a projected galactocentric radius of 5 kpc, normalized per unit projected mass density as probed by integrated band light, has been constant when averaged over Myr time spans. It should be emphasized that this conclusion likely holds only for a strip with a width of a few kpc at R kpc. Indeed, the comparisons in Figure 6 hint that there was more active star formation when R kpc, which presumably causes the high specific frequency of RSGs with M when R kpc. The absence of HII regions when R kpc (e.g. Lin et al. 2003) also indicates that star formation at the current day does not occur in the inner disk of M81.
Despite the tendency for more distributed star formation in M81 10 – 25 Myr in the past, there are areas of star formation that have stayed active for at least this period of time. Indeed, the specific frequency of RSGs in the North field, where there is vigorous star formation at the current day, is two times that in the other fields. This is thus an area of prolonged star-forming activity.
5.2 Estimating the SFR in M81 25 Myr in the Past
The data discussed in this paper suggest that M81 contains a rich population of very luminous RSGs. The specific frequency measurements indicate that RSGs brighter than M account for 1.5% of the band light. If M81 is assumed to be a typical Sb galaxy, with 16% of its light coming from the bulge (Perez-Gonzalez et al. 2001), then there should be RSGs with M in the disk of M81.
Using data listed in Table 4 of Bell & Kennicutt (2001), and the calibrations given in their Equations 2 and 3, the present-day SFR of M81 is 0.24 M⊙ year-1 based on the UV flux, and 0.36 M⊙ year-1 based on the H flux. How does this compare with the SFR Myr in the past? This question can be answered by estimating the mean SFR over the interval 10 – 25 Myr from the specific frequency of RSGs. If there are 3300 RSGs brighter than M in M81, and if these stars have progenitor masses between 10 and 20 M⊙, then the RSG progenitors had a total mass M⊙. An integration of the Kroupa et al. (1993) mass function with limiting masses of 0.08 and 100 M⊙ indicates that stars in the 10 – 20 M⊙ range account for of the total mass formed. The SFR for the disk of M81 between 10 and 25 Myr in the past is then M⊙ year-1. The estimated SFR does not change markedly if a Salpeter (1955) mass function is assumed. We conclude that while star formation may have been distributed over larger areas of M81 than today, the mean SFR in M81 was not markedly higher over the past 25 Myr.
| Field | RA | Dec | K |
|---|---|---|---|
| M81 West | 09:54:44 | 69:05:45 | 7.32 |
| M81 East | 09:56:24 | 69:03:54 | 7.65 |
| M81 North | 09:55:24 | 69:10:11 | 7.84 |
| M81 South | 09:56:04 | 68:58:16 | 7.39 |
| ID | [Fe/H] | ||||
|---|---|---|---|---|---|
| Id50401 | –0.04 | 17.10 | 0.18 | 0.76 | 2.83 |
| Id50415 | –1.90 | 17.00 | 0.19 | 0.74 | 2.24 |
| Id50552 | 0.98 | 17.18 | 0.18 | 1.08 | 2.34 |
| Id50785 | –0.72 | 16.24 | 0.28 | 1.06 | 2.84 |
References
- (1)
- (2) Barmby, P., Huchra, J. P., & Brodie, J. P. 2001, AJ, 121, 1482
- (3)
- (4) Barmby, P., Huchra, J. P., Brodie, J. P., Forbes, D. A., Schroder, L. L., & Grillmair, C. J. 2000, AJ, 119, 727
- (5)
- (6) Beasley, M. A., Brodie, J. P., Strader, J., Forbes, D. A., Proctor, R. N., Barmby, P., & Huchra, J. P. 2005, AJ, 129, 1412
- (7)
- (8) Bekki, K., & Chiba, M. 2004, A&A, 417, 437
- (9)
- (10) Bell, E. F., & de Jong, R. S. 2000, MNRAS, 312, 497
- (11)
- (12) Bell, E. F., & Kennicutt, R. C. 2001, ApJ, 548, 681
- (13)
- (14) Bellazzini, M., Ferraro, F. R., & Ibata, R. 2003, AJ, 125, 188
- (15)
- (16) Boissier, S., Prantzos, N., Boselli, A., & Gavazzi, G. 2003, MNRAS, 346, 1215
- (17)
- (18) Boyce, P. J. et al. 2001, ApJ, 560, L127
- (19)
- (20) Brodie, J. P., & Huchra, J. 1991, ApJ, 379, 157
- (21)
- (22) Brouillet, N., Baudry, A., Combes, F., Kaufman, M., & Bash, F. 1991, A&A, 242, 35
- (23)
- (24) Brouillet, N., Kaufman, M., Combes, F., Baudry, A., & Bash, F. 1998, A&A, 333, 92
- (25)
- (26) Chandar, R., Ford, H. C., & Tsvetanov, Z. 2001, AJ, 122, 1330
- (27)
- (28) Chandar, R., Tsvetanov, Z., & Ford, H. C. 2001, AJ, 122, 1342
- (29)
- (30) Cutri, R. M., et al. 2003, 2MASS All-Sky Catalogue of Point Sources (Amherst: Univ. Massachusetts Press)
- (31)
- (32) Davidge, T. J. 2005, ApJ, 622, 279
- (33)
- (34) Davidge, T. J. 2006, ApJ, 641, 822
- (35)
- (36) Davidge, T. J., & Courteau, S. 1999, AJ, 117, 2781
- (37)
- (38) Efremov, Y. N., & Elmegreen, B. G. 1998, MNRAS, 299, 588
- (39)
- (40) Ferguson, A. M. N., Johnson, R. A., Faria, D. C., Irwin, M. J., Ibata, R. A., Johnston, K. V., Lewis, G. F., & Tanvir, N. R. 2005, ApJ, 622, L109
- (41)
- (42) Freedman, W. L. et al. 2001, ApJ, 553, 47
- (43)
- (44) Frogel, J. A., Becklin, E. E., Neugebauer, G., Matthews, K., Persson, S. E., & Aaronson, M. 1975, ApJ, 195, L15
- (45)
- (46) Gilmore, G., Wyse, R. F. G., & Norris, J. E. 2002, ApJ, 574, L39
- (47)
- (48) Girardi, L., Bertelli, G., Bressan, A., Chiosi, C., Groenewegen, M. A. T., Marigo, P., Salsnich, B., & Weiss, A. 2002, A&A, 391, 195
- (49)
- (50) Gordon, K. D., et al. 2004, ApJS, 154, 215
- (51)
- (52) Hammer, F., Flores, H., Elbaz, D., Zheng, X. Z., Liang, Y. C., & Casarsky, C. 2005, A&A, 430, 115
- (53)
- (54) Huxor, A. P., Tanvir, N. R., Irwin, M. J., Ibata, R., Collett, J. L., Ferguson, A. M. N., Bridges, T., & Lewis, G. F. 2005, MNRAS, 360, 1007
- (55)
- (56) Ibata, R., Irwin, M., Lewis, G. F., & Stolte, A. 2001; ApJ, 547, L133
- (57)
- (58) Ibata, R., Irwin, M., Lewis, G., Ferguson, A. M. N., & Tanvir, N. 2001; Nature, 412, 49
- (59)
- (60) Ibata, R., Irwin, M., Lewis, G. F., Ferguson, A. M. N., & Tanvir, N. 2003; MNRAS, 340, L21
- (61)
- (62) Jarrett, T. H., Chester, T., Cutri, R., Schneider, S. E., & Huchra, J. P. 2003, AJ, 125, 525
- (63)
- (64) Kroupa, P. 1998, MNRAS, 300, 200
- (65)
- (66) Kroupa, P., Tout, C. A., & Gilmore, G. 1993, MNRAS, 262, 545
- (67)
- (68) Lin, W., et al. 2003, AJ, 126, 1286
- (69)
- (70) Ma, J., Zhou, X., Chen, J., Wu, Z., Yang, Y., Jiang, Z., & Wu, J. 2005, PASP, 117, 256
- (71)
- (72) Mackey, A. D., & Gilmore, G. F. 2004, MNRAS, 355, 504
- (73)
- (74) Mackey, A. D., & van den Bergh, S. 2005, MNRAS, 360, 631
- (75)
- (76) Makarova, L. N. et al. 2002, A&A, 396, 473
- (77)
- (78) Martinez-Delgado, D., Aparicio, A., Gomez-Flechoso, M. A., & Carrera, R. 2001, ApJ, 549, L199
- (79)
- (80) Meza, A., Navarro, J. F., Abadi, M. G., & Steinmetz, M. 2005, MNRAS, 359, 93
- (81)
- (82) Parmentier, G., de Grijs, R., & Gilmore, G. 2003, MNRAS, 342, 208
- (83)
- (84) Perelmuter, J-M., & Racine, R. 1995, AJ, 109, 1055
- (85)
- (86) Perelmuter, J-M., Brodie, J. P., & Huchra, J. P. 1995, AJ, 110, 620
- (87)
- (88) Perez-Gonzalez, P. G., Gallego, J., Zamorano, J., & Gil de Paz, A. 2001, A&A, 365, 370
- (89)
- (90) Rozanski, P., & Rowan-Robinson, M. 1994, MNRAS, 271, 530
- (91)
- (92) Salpeter, E. E. 1955, ApJ, 121, 161
- (93)
- (94) Sarzi, M., Rix, H-W, Shields, J. C., Ho, L. C., Barth, A. J., Rudnick, G., Filippenko, A. V., & Sargent, W. L. W. 2005, ApJ, 628, 169
- (95)
- (96) Schroder, L. L., Brodie, J. P., Kissler-Patig, M., Huchra, J. P., & Phillips, A. C. 2002, AJ, 123, 2473
- (97)
- (98) Stetson, P. B. 1987, PASP, 99, 191
- (99)
- (100) Stetson, P. B., & Harris, W. E. 1988, AJ, 96, 909
- (101)
- (102) Sun, W-H et al. 2005, ApJ, 630, L133
- (103)
- (104) Swartz, D. A., Ghosh, K. K., McCollough, M. L., Pannuti, T. G., Tennant, A. F., & Wu, K. 2003, ApJS, 144, 213
- (105)
- (106) Taylor, C. L., & Wilson, C. D. 1998, ApJ, 494, 581
- (107)
- (108) van Driel, W., Kraan-Korteweg, R. C., Binggeli, B., & Huchtmeier, W. K. 1998, A&AS, 127, 397
- (109)
- (110) Wielen, R. 1974, A&AS, 15 1
- (111)
- (112) Williams, B. F. 2003, AJ, 126, 1312
- (113)
- (114) Yun, M. S., Ho, P. T. P., & Lo, K. Y. 1994, Nature, 372, 530
- (115)
- (116) Zucker, D. B., et al. 2004, ApJ, 612, L117
- (117)