Old and young bulges in late-type disk galaxies111Based on observations with the NASA/ESA Hubble Space Telescope, obtained at the Space Telescope Science Institute, which is operated by AURA Inc, under NASA contract NAS 5-26555.
Abstract
We use HST ACS and NICMOS multi-band imaging to study the structure and the inner optical and
near-infrared colors of a sample of nine late-type spirals. We use a range of population-synthesis-based star formation histories to interpret the observed and colors.
We find:
A correlation between bulge and disks scale-lengths, and a correlation between the colors of the late-type bulges and those of the inner disks. Our data show a trend for the bulges to be more metal-enriched than their surrounding disks, but otherwise no simple age-metallicity connection between these systems. This suggests a complex relationship between the star formation and metal production histories of late-type bulges and their surrounding disks;
A large range in bulge color properties, indicating a large range in stellar population properties, and, in particular, in stellar ages. Specifically, in about a half of the late-type bulges in our sample the bulk of the stellar mass was produced rather recently. This indicates that, in a substantial fraction of the disk-dominated bulged galaxies, bulge formation occurs after the formation/accretion of the disk;
In about a half of the late-type bulges in our sample, however, the bulk of the stellar mass was produced at early epochs, as is found for the early-type, massive spheroids;
Even the “old” late-type bulges host a significant fraction of stellar mass in a young(er) component, indicating that, in contrast with the very massive bulges, possibly all late-type bulges are rejuvenated at later times. This is similar to what is found for the Milky Way Bulge;
A correlation for bulges between stellar age and stellar mass, in the sense that more massive late-type bulges are older than less massive late-type bulges. Since the overall galaxy luminosity (mass) also correlates with the bulge luminosity (mass), it appears that the galaxy mass regulates not only what fraction of itself ends up in the bulge component, but also “when” bulge formation takes place.
Our result extends to the smallest bulge mass scales –bordering with the typical masses of nuclear star cluster– previous findings on the ages of stellar spheroids. The variety, and the likely multi-burst nature, of the star formation histories of late-type bulges could be naturally explained by several processes contributing, at different epochs and on different time-scales, to the formation of low-mass spheroids. On the other hand, the scalings between bulge stellar age and bulge/galaxy mass, and between bulge and disk scale lengths, hint at similar processes for all, and suggest that late-type bulges of all (masses and) stellar ages result from the internal evolution of the parent disks. We show that dynamical friction of massive clumps in gas-rich disks is also, together with well-known bar-driven mechanisms, a plausible disk-driven mode for the formation of late-type bulges, especially for those that are older than their surrounding disks. If disk evolutionary processes are indeed responsible for the formation of the entire family of late-type bulges, CDM simulations need to produce a similar number of initially bulgeless disks in addition to the disk galaxies that are observed to be bulgeless at .
1 Introduction
The late-type bulges of disk-dominated galaxies differ significantly from merger remnants: They show disk-like cold kinematics (Kormendy 1993), and Sersic profiles with values substantially smaller than the deVaucouleur value typical of an elliptical galaxy, and very close to the that describes a disk-like, exponential profile (see e.g., Kormendy & Kennicutt 2004, Wyse, Gilmore & Franx 1997 and Carollo 2004 for reviews and references therein).
Whether externally- or internally-triggered, disk evolution is thought to be likely responsible for the formation of these disk-like bulges. Interactions with companion galaxies are for example observed , statistically, to induce a redistribution of gas within a disk, which could lead to the formation of bulges (e.g. Kannappan et al. 2004). Although quantitative predictions are scarce, the accretion of small satellite galaxies onto a pre-existing galaxy disk could also drive gas into the central regions (e.g. Hernquist & Mihos 1995) and contribute to the formation of a central bulge. Within a disk, a fire-hose (or buckling) instability can scatter the stars originally in a stellar bar above the plane of the disk, into what resembles a bulge-like structure (Raha et al. 1991; Debattista et al. 2004; 2006). A stellar bar can also be transformed into a three-dimensional bulge-like system by the accumulation of a large enough mass concentrated in the center, which can disrupt the regular orbits supporting the bar (Norman et al. 1996; the most recent simulations however indicate that a rather large central mass is required for the process to be effective; see Shen & Sellwood 2004). Bulge formation via bar instability is furthermore indirectly supported by arguments relating a disk surface density threshold to the onset of AGN activity (Wyse 2004). Since several secular process could induce gas flows towards the galaxy center, the resulting bulges could be even younger than the surrounding disks. Phase space density arguments favor dissipative mechanisms to form bulges at late times (Wyse 1998), although collisionless disk evolution does not violate phase-space density constraints if it occurs at early times (Aliva-Reese et al. 2005). Numerical simulations of bar-driven disk evolution with and without gas show that the resulting bulges are not only structurally, but also dynamically , similar to the bulges of disk-dominated galaxies (e.g., Debattista et al. 2004; 2006). If late-type bulges were the outcome of such processes acting after the formation of the disk, about 30-40% of today’s galaxies – that percentage being late-type disk galaxies in the local Universe – should have been born as pure (bulgeless) disks. This would be an important constraint on galaxy formation models.
The breaking of degeneracies amongst possible formation processes requires both quantitative predictions on the statistical properties of bulges that form through different mechanisms, and observational diagnostics capable of breaking such degeneracies. Qualitatively, one might expect that e.g., thick disks with properties related to those of the bulge (unfortunately measurable only in edge-on systems) might be a signature of bulge formation by satellite accretion (e.g., for the Milky Way, see Wyse 2001), while e.g., internal secular evolution of the parent disks might be a more natural explanation for correlations between the stellar populations and the scale lengths of bulges and disks. Studying the properties of late-type bulges is however rather difficult on account of their small sizes, which are typically barely resolved in seeing-blurred, ground-based images. The spatial resolution of ground-based images is non-optimal to mask out dust features and star forming regions, which affect the measurements of the properties of the underlying stellar populations, and to disentangle cleanly from each other the light contributions arising from different galactic subcomponents. In contrast, the high spatial resolution achievable with the Hubble Space Telescope (HST) allows the exploration of nearby disk galaxies on 10pc scales. Our HST WFPC2 and NICMOS survey of disk galaxies (Carollo et al. 1997, 1998, 2001, 2002; Carollo 1999; Seigar et al. 2002) has for example unveiled that about of these systems host massive star clusters in their isophotal centers, whose light contribution needs to be masked out prior to the analysis of the bulge and disk components (see Appendix A).
This and a companion papers (Paper 1 and Paper 2, respectively) continue our previous observational efforts to investigate the properties of the late-type galaxy population with the HST, and specifically present new data which set additional constraints on the structural and stellar population properties of these systems. In this Paper 1 we focus on the late-type bulges, and on their relation with the properties of their host galaxies, with emphasis on their stellar population properties. While generally less sensitive to the mass assembly process, photometric stellar population diagnostics are key to test the epoch and timescales for the formation of the stars that are locked in bound structures. In Carollo et al. (2001) we showed that the colors of late-type bulges are on average bluer by mag than the colors typical of the massive spheroids. We have interpreted these blue colors as indicative that many late-type bulges are made of stellar populations which are, on average, significantly younger than those of the massive early-type bulges and of the elliptical galaxies. A single color is however notoriously degenerate towards stellar age, metallicity, dust and contamination by emission lines.
To characterize more accurately the properties, and in particular the metallicities and stellar ages of the central sub-galactic components of late-type disk galaxies, we have followed up our previous HST survey by acquiring new ACS data in , and for eleven galaxies in our original WFPC2+NICMOS sample, nine of which have bulge surface brightness distributions well fitted by an almost exponential profile; the latter nine galaxies are thus those that we discuss in this first paper. Only the and images have enough signal-to-noise ratio in the continuum to allow the study of the bulges and inner disks. In this Paper 1 we therefore focus on combinations of data in , and filters (the latter available from our previous survey); these have different sensitivities to effects of dust, metallicity and recent star formation, and thus help to break the degeneracy in these parameters (e.g., Knapen et al. 1995).
This paper is structured as follow. Section 2 and Appendix 1 provide information on the sample and the data reduction and analysis. In the Appendix we also present a discussion of the possible effects of dust reddening on our analysis, and tabulate the structural parameters for the galaxies (as obtained through ellipse fitting). The surface brightness radial profiles are made available in electronic tabular form. In Section 3 we present and discuss the (structural and) stellar population properties of the bulges and inner disks, their relationships, and their dependence on the properties of the host galaxies. In Section 4 we discuss possible implications of our results for the formation of the local disk galaxy population. We summarize our main conclusions in Section 5. Throughout the paper we adopt km s-1 Mpc-1.
We postpone the investigation –which we started in Carollo 1999 and Carollo et al. 2001,2002– of the properties and scaling laws of the nuclear star clusters, and their relation with the host bulges and disks, to Paper 2 (Carollo et al. 2006, in preparation).
2 The sample and data analysis
The nine galaxies of the present sample were selected from our WFPC2 and NICMOS survey. All galaxies have kms-1 and inclination , to avoid strong obscuration of the nucleus by the disk. Table 1 lists their coordinates and some of their global properties. The nine targets are rather typical late-type disk galaxies in terms of bulge Sersic index (i.e., their bulges have almost-exponential light profiles with 2), disk scalelengths, rotational velocities, densities, and total magnitudes; on the other hand, they probe the small-size end of the bulge population, which is not easy to investigate at ground-based resolution (see Appendix A.1 for further details).
The galaxies were observed with the ACS-WFC in each of the F435W () and F814W () filters (and with the F330W filter in the ACS-HR channel - but the S/N of these UV images is too low for studying the diffuse stellar components; the UV data are thus not considered in the present discussion). The standard ACS pipeline was used to perform the basic data reduction, followed by cosmic-ray rejection, correction for hot pixels and sky subtraction. Image alignment was checked before combining the individual images in each filter; we also checked the alignment between images in the two different filters. A photometric calibration was applied to convert the instrumental magnitudes into VEGA magnitudes. These were corrected for Galactic extinction following Schlegel, Finkbeiner & Davis (1988).
For each galaxy, we computed radial surface brightness profiles in and by fitting ellipses to the final images with the IRAF222IRAF is distributed by the National Optical Astronomy Observatories, which is operated by the Association of Universities for Research in Astronomy, Inc. (AURA) under cooperative agreement with the National Science Foundation. program ELLIPSE. Star-forming regions/knots and dust lanes and patches were masked out before performing the fits. The profiles are plotted and reported in electronic tabular form in the Appendix. For easy reference, the band NICMOS profiles of Seigar et al. (2002), which are used in the current analysis, are also given in the Appendix (augmented in radial extent, when possible, using the 2 Micron All Sky Survey data (2MASS; Jarrett 2004).
The band surface brightness profiles were derived with a PSF–convolved, Sersic bulge plus exponential disk model. The innermost radial points in the profiles were excluded when performing the analytical fits for eight of the nine galaxies, as the light emission is there dominated by the nuclear star clusters which have been previously identified in the galaxy centers. In ESO 499G37, the closest galaxy in our sample (at a nominal distance of only 14Mpc), the size/mass of the well-resolved ”bulge” reaches the typical scales that are observed for the nuclear star clusters in the other more distant galaxies in the sample. In the latter galaxies, the nuclear clusters are found in addition to a bulge component; in ESO 499G37, the cluster-sized bulge is the only central structure detected in addition to the disk. It is an interesting question whether ESO 499G37 is a bulge-less disk with a nuclear star cluster (for which we resolve its spatial structure), or a disk galaxy with a small bulge and no central star cluster. In Paper 2 we show that, in terms of surface mass density versus stellar mass, the central structure in this galaxy can be considered as a ”transition object” between bulges and nuclear star clusters. We have opted for including the cluster-sized ”bulge” of ESO 499G37 in the current analysis, and treating this structure similarly to the other bulges. With the ”bulge” of ESO 499G37 we extend the study of bulges of late-type galaxies down to the M⊙ scales; we will discuss further in Paper 2 the relationship between nuclear clusters and host bulges, and what can be learned about this relationship from the special case of ESO 499G37.
Tables 2 and 3 list the main model parameters derived for each of the galaxies from the images. Since the -band surface brightness profiles show more features than the -band profiles, and the -band profiles are typically noisier and less extended than the -band profiles, we used the structural parameters of the -band best-fit analytical models to derive the and bulge total/central magnitudes, which are also listed in the Tables (see also Appendix A.2). We stress that this is equivalent to setting to zero, by construction, any possible color gradient in the bulges (which are thus not addressed in this paper); these are expected to be smaller than the color gradients between bulges and disks (Kormendy & Kennicutt 2004), which we measured after accounting for the differences in the PSFs of the various passbands. In Table 4 we list the differences between the bulge colors, derived from the photometric decompositions as discussed above, and the colors of the disks, as estimated at a galactocentric distance of 5 bulge half-light radii. Since the bulges are best fit by close-to-exponential profiles, and the half-light radius for an exponential is equal to 1.67 scale-lengths, this thus corresponds to measuring the disk colors at more than 8 bulge scale-lengths, i.e., at a distance equal to a large fraction of the disk scale length, and thus well into the disk-dominated regions.
3 Stellar populations in the centers of late-type disk galaxies
3.1 Two caveats
We stress two issues that in principle might have some impact on our conclusions, before presenting our results on the colors and thus stellar populations in the centers of the late-type galaxies of our sample:
-
•
Even with the availability of several passbands, disentangling the effects of stellar ages, metallicities, dust and emission lines remains a non-trivial task. The high spatial resolution that is achieved with the ACS allows us to easily mask out sharp dust features or compact sources such as regions of very recent star formation. This allows us to measure reliable colors of the diffuse, underlying stellar populations. A smoothly distributed dust distribution , however, would remain undetected in our analysis (as in any other study based on broad-band colors). We discuss in the Appendix what the impact of any such a diffuse dust component would be on our main results. This impact is mainly to render the absolute stellar population ages and metallicities rather uncertain. Furthermore, if galaxies with larger stellar mass and thus higher metallicity had more dust (as suggested by, e.g., Tully et al. 1998), the ages of their stellar populations could be systematically overestimated, a bias that could affect the comparison between the stellar population properties of galaxies with very different metal content and stellar masses.
-
•
There are substantial differences between different population synthesis models, which hamper the determination of absolute ages and metallicities of integrated stellar populations. As an example, in Figure 1 we show, on the versus color-color plane that we use below as our main disgnostic, a grid of simple stellar population (SSP) models extracted from the Bruzual & Charlot compilation (2001, hereafter BC01; web publication; dashed black lines). The almost-horizontal, dashed lines are isometallicity tracks with metallicity ranging from Z=2.5 to from top to bottom; for each metallicity, ages range from 0.5 to 12 Gyrs from left to right. The grid is obtained using a Salpeter (1955) stellar initial mass function (IMF) with a lower and upper mass cut-offs of 0.1 and 100, respectively. The use of a Salpeter IMF all the way to the brown dwarf limit is a choice of convenience that does not significantly affect our ”comparative” results. A similar grid is reproduced for the models of Bruzual & Charlot (2003, hereafter BC03; black dotted lines). Finally, an equivalent grid is shown using the Maraston (1998) models (hereafter M98; color solid lines). Their metallicities are 2Z⊙, , 0.5 and 0.05 from top to bottom, and the stellar ages range, as before, between 0.5 and 12 Gyr from left to right. The reason why we choose to compare these specific models is that there are substantial technical differences between them, e.g., the BC01 and BC03 models are based on an “isochrone synthesis” approach and the M98 models are based on the “fuel consumption” approach introduced by Renzini (1981; see Maraston 1998 for an extensive discussion). For our discussion, however, the most significant difference between the Bruzual & Charlot models and the M98 models is a different recipe for the inclusion of a thermally-pulsing Asymptotic Giant Branch, which substantially changes the SED properties of intermediate-age stellar populations.
This is evident from the Figure, which shows substantially different predictions for the colors of stellar populations of about 2 Gyr or younger. For reference, we also plot on the diagram the measurements for our late-type bulges (grey circles) and for the massive early-type bulges of Peletier et al. 1999 (grey squares; see below for details on the measurements). From the Figure, it is clear that there is a large uncertainty, associated with the models, in deriving absolute ages and, in particular, absolute metallicities. However, the relative ranking remains robust, especially for the stellar ages.
In the analysis that we present below, we adopt the BC01 models to set quantitative constraints on the stellar population properties of the late-type bulges and their surrounding disks in comparison with each other and with the properties of the more massive early-type bulges.
While being aware of the caveats discussed above, we trust that the main results of our work, due to the size of the effects that we discuss and to the comparative nature of our statements, are not strongly affected by either an invisible diffuse dust component or the particular choice of population synthesis models.
3.2 The bulges
3.2.1 The simplest analysis: Comparison with SSP models
The simplest assumption concerning the stellar population properties of a stellar structure is that this is made of stars with identical ages and metallicities. While this is unlikely a good approximation of reality, most studies perform such a comparison between the observed colors of integrated stellar population and the SPP models describing such a scenario. The - grid of BC01 SSP models of Figure 1 is again reproduced in Figure 2, with overplotted the measured central colors of the low-Sersic-index, late-type bulges of our study (blue solid circles), and isochrones of ages ranging from 0.5 to 12 Gyr (almost-vertical dashed lines). The bulge colors are computed using the Sersic fits to the observed bulge brightness radial profiles (adopting the -band analytical best fit structural parameters for all passbands). Assuming that the real disks are exponential, as used in our analytical descriptions, this should eliminate any contribution to the color estimates arising from the disk component; if the stellar disks were more concentrated than an exponential profile, subtracting the latter would leave a residual contamination from the disk component to the light attributed to the bulge, but would nonetheless minimize such contamination. The fact that a significant fraction of nearby stellar disks has a perfectly-exponential profile from the many kpc scales down to the innermost point sampled by the HST (Böker et al 2003) suggests that an exponential profile for the underlying disk components is most likely an accurate description for real disks.
In Figure 2 the early-type, massive bulges studied by Peletier et al. (1999) are also plotted for comparison (black squares). Their bulge colors were derived on the basis of NICMOS-F160W, WFPC2-F450W, and WFPC2-F814W images; the conversion to our filter set was derived by using a 10 Gyr SSP of solar metallicity, and is: ; . No disk subtraction was attempted in these measurements. However, in early-type disk galaxies, the bulge strongly dominates the light budget in the galaxy centers; therefore, the disk contribution in the Peletier et al. measurements is almost negligible. The colors that we adopt for these massive bulges are those measured at one half-light radii from the galaxy centers, as the nuclear colors are affected by the presence of dust, nuclear point sources and/or stellar clusters. As visible in Figure 2 of Peletier et al. the color gradients of these systems outside of these affected nuclear regions are much smaller than the effects that we discuss in this paper; therefore, we trust the color comparisons between the late-type bulges and the massive bulges to be robust.
The colors of the massive, early-type bulges are well reproduced by old ( Gyrs) and metal-rich stellar populations, in agreement with the original analysis of Peletier and collaborators. The two samples that we are comparing clearly cover, on average, different regions of the - color-color diagram, suggesting different stellar ages and metallicities. While the early-type, massive bulges are concentrated in a region of parameter space corresponding to old and metal-rich stellar populations, the late-type bulges cover a wide range of observed and colors. Using the SSP models as a benchmark to infer from the observed colors the stellar population properties of the late-type bulges, stellar population ages ranging from less than 1 Gyr up to Gyrs and a large spread in metallicity are indicated for these systems. This comparison, at face value, would support previous work concluding that late-type bulges are, on average, younger and more metal poor than massive, early-type bulges.
A few late-type bulges lie, on the color-color diagram, well outside the region covered by the grid of SSP models, requiring dust-reddening effects in order to reconciliate the observed colors with SSP models. The reddening vectors for an absorption of mag are shown for the triplex model of Disney et al. (1989, red) and for an idealized uniform foreground screen model (black) in the upper–left quadrant of the Figure. The two reddening vectors run almost parallel to each other, and indicate that reddening effects could likely produce the observed discrepancy between observations and the SSP models. If dust affects the observed colors of the late-type bulges, it would most likely work in the direction of reddening their intrinsically bluer colors, and it would thus imply even younger and less metal-enriched stellar populations for these systems. In Table 5 we summarize the stellar population properties of the bulges in our sample that are derived from the comparison with the SSP models.
The SSP models are however most likely inadequate to describe the star formation histories (SFHs) of the late-type bulges. In particular, they do not provide information as to whether the colors of the late-type bulges arise from mostly old stellar structures that are slightly rejuvenated by minor (in terms of stellar mass) recent star formation events, or whether it is the bulk of the stellar mass in the late-type bulges that is relatively young - and younger than the stellar populations of the massive, early-type spheroids. We therefore adopt below two different SFHs for the late-type bulges, and use these more realistic models to set constraints on the age of the bulk of the stars in these systems. For only one galaxy, NGC 3259, do the arguments favoring the presence of dust remain supported even when using more realistic star formation histories; for all other galaxies in our sample, the composite stellar population model grids can explain the observed colors of their bulges. It might be worth noting that NGC 3259 is the only galaxy in our sample with a spatially unresolved central compact ”object” (at HST resolution; see Carollo et al. 2002), in contrast with all other galaxies in which, at similar distance, the distinct photometric nucleus is resolved into a nuclear star cluster.
3.2.2 Comparison with Composite Stellar Population models
The simplest approach to quantify the presence of an old stellar population component in relatively blue stellar systems , such as the late-type bulges of our study , is to adopt a model in which their stars were born in two distinct starbursts events, the first taking place early-on in the life of the universe, and the second one occurring at a later time.
We created such composite stellar population (CSP) models by adding, to 12 Gyr old SSP models, a fraction of the total stellar mass in young stars. We considered young components with ages of , and 8 Gyrs, with metallicities ranging from 0.2 to 2.5. The fraction of young stars ranged from , reproducing a 12Gyr-old SSP, up to , reproducing a SSP model of age equal to that of the young component.
We show in Figure 3 the vs color-color diagram of our sample bulges, with overplotted the grid of CSP models for three different ages of the young stellar component, namely 100 Myr (top), 1 Gyr (middle) and 3 Gyr (bottom). In each panel of Figure 3 only the mass fraction and metallicity of the young stellar component are varied. For clarity, only tracks corresponding to and 2.5 are plotted for the young stellar component (cyan, black and magenta tracks, respectively); the same metallicity range is more densely sampled for the old stellar population (black labels to the right of the almost-horizontal isometallicity tracks).
As evident in Figure 3, in principle a small () fraction of the stellar mass with a stellar age of order 100Myr could reproduce the observed blue colors of the late-type bulges. However, the relaxation time for these systems is typically of order several hundred million years; therefore, stellar populations that are significantly younger than such timescale would possibly be not dynamically-relaxed, and would likely appear as clumped star forming regions. Thanks to the resolution achievable with the HST, we were able in our analysis to mask out bright knots of recent star formation. We therefore consider this interpretation for the blue colors of the underlying diffuse stellar populations of the late-type bulges as unlikely.
At the other extreme, should the late-type bulges host a 12 Gyr-old underlying stellar population, Figure 3 shows that, consistently with the stellar ages inferred from the SSP analysis of Figure 2, a stellar component substantially younger than 3 Gyr would be required to explain their blue colors, as none of the late-type bulges overlaps with the theoretical models in the case of a 3 Gyr-old “young” stellar component.
We therefore adopt the 1 Gyr-old stellar population as a benchmark to discuss the properties of the late-type bulges based on the CSP models. If the most recent burst of star formation in the late-type bulges occurs about 1 Gyr ago, a substantial (%) fraction of the stellar mass in such young stars is required to explain the blue colors of about a half of the late-type bulges in our sample. In contrast, however, the other half of our sample of late-type bulges are well described by CSP models with less than about 10% of the mass in 1Gyr-old stars (where 10% is the upper limit derived by considering the most metal-rich tracks for the 1Gyr-old stellar component). In fact, in about a half of the late-type bulges in our sample the colors are consistent with their stellar mass budget being dominated by a very old stellar population.
This variety of stellar population properties unveiled in the late-type bulges highlights the complexity in the star formation histories of these stellar systems.
3.2.3 Comparison with exponential star formation history models
The second approach that we use to investigate the presence of an old stellar component in the late-type bulges allows us to explore the effects on the colors of an extended period of continuous star formation (as opposed to the “two bursts” model described above). Here we assume that the late-type bulges have SFHs that are well described by an exponentially decreasing star formation rate (SFR). The bulges SFRs are parametrized by the folding time of star formation, . We label these models exponential star formation history (ESFH) models. Under the assumption that the IMF does not depend on time, and that the stellar metallicity remains constant with time, the integrated spectrum at time of a stellar population characterized by a star formation rate can be written as:
| (1) |
where is the time-evolving spectrum of a single stellar population of age , and is the SFR of the galaxy as a function of time. Assuming that all bulges started to form stars at a fixed time, variations in their observed colors depend on their e-folding time and on the metallicity of their stellar population. Their SFHs are thus described by these two parameters. A SFH–weighted average age () of the composite stellar population can be defined as (see, e.g., MacArthur et al. 2004):
| (2) |
where is the age of the oldest stars, namely when the star formation started, which we assumed equal to 12 Gyr ago for all models. In this formulation, the metallicity is kept constant during the entire star formation history, which is of course a rather coarse approximation. This has the advantage however of avoiding introducing further assumptions on specific chemical evolution models.
In Figure 4 we show the vs color-color diagram of Figure 2 , with overplotted the theoretical grid computed assuming these ESFH models. The e-folding time of star formation is used to label the almost-vertical isochrone curves. The metallicity of the different models varies from 0.2 to 2.5 , and it is indicated on the right side of the grid to label the almost-horizontal isometallicity curves. Table 6 summarizes the stellar population properties of the late-type bulges that are derived from the comparison with the ESFH models.
Figure 5 visualizes the main difference in average stellar population properties between the early-type massive bulges of Peletier et al. (1999; grey shaded area), and the late-type bulges in our sample (histograms). In contrast with the old and broadly-speaking coeval, highly-enriched massive bulges, the bulges of disk-dominated galaxies are indeed a much less coherent population, covering a wide range in stellar metallicities and ages.
In Figure 6 we show the SFH (i.e., SFR as a function of time) that better reproduces the observed colors for each late-type bulge in our sample. In this figure, zero represent the redshift z=0 point. Some of the late-type bulges , such as NGC 2758, are well reproduced by an almost-constant SFH. However, other late-type bulges , such as ESO 498G5, are better described by a SFH which peaks several Gyr ago, suggesting that a substantial fraction of stellar mass in these systems is in old stars.
Using the derived SFHs, we quantify the amount of stellar mass in the late-type bulges of our sample that formed in the first and in the last three billion years, respectively. In particular, Figure 6 shows, for the nine late-type bulges of our sample, the distribution of mass fraction which formed between 12 and 9 Gyr ago (red histogram), and the stellar mass which formed from 3 Gyr ago to today (blue histogram; see also Table 6).
About a half of the late-type bulges in our sample formed a non-negligible fraction of their stellar mass in the last 3 Gyr. Since the disks will have been in place by then, this supports that secular evolution processes play an important role in building up additional stellar mass in the centers of the galaxy after the assembly of the disk itself. However, in the remaining late-type bulges, the colors are consistent with these bulges having formed more than of their stellar mass more than 9 Gyr ago, similar to the conclusions concerning massive, early-type bulges and elliptical galaxies (e.g., Thomas et al. 2005; Thomas & Davies 2006).
Figure 7 shows the dependences of the derived stellar ages and metallicities of our late-type bulges, obtained from their best-fit ESFH models, on the stellar mass of the bulges, obtained from their absolute magnitude. We report no significant dependence between the metallicity of the model that provide the best fit to the color of a late-type bulge, and the bulge stellar mass (although, as suggested by the referee, the assumption of a constant metallicity in our models may contribute to dilute a correlation between bulge stellar mass and metallicity, if this were present). Despite a large scatter in stellar age, we find instead a clear correlation between bulge mass and age, in the direction that more massive late-type bulges are on average older stellar systems than the less massive ones. This result has previously been presented concerning the comparison between massive early-type bulges and less massive late-type bulges (e.g., Carollo et al. 2001; Thomas & Davies 2006). However, we show here that such a trend remains valid within the family of late-type disk galaxies, i.e., the relatively more massive late-type bulges are older than the smallest members of their own family. Our statistics is inadequate to explore whether important factors such as environment induce or contribute to this trend. The luminosities -good proxy for (stellar) masses- of bulges and host galaxies are found to correlate however quite well, down to the faintest luminosities probed by our late-type bulges (see left panel of Figure 8). It would thus appear that the galaxy mass is influential in establishing not only what fraction of itself ends up in a central bulge component, but also at what epoch this happens during the lifetime of the galaxy.
3.3 The inner disks
The analysis of ground-based imaging data has shown that the massive bulges and their inner disks have similar stellar populations (Peletier & Balcells 1996). The photometric decompositions that we have performed on the ACS surface brightness profiles allow us to compare the colors of the (smaller) late-type bulges with those of their surrounding disks.
In the left panel of Figure 9 we plot the color of the late-type bulges (small symbols) and of their surrounding disks (large symbols). The color of the disks are those of the analytic disk components, as measured at five half-light bulge radii from the galaxy centers (see also Figure 10, which shows the and color profiles). Different symbols refer to different galaxies. The vertical axis is used to arbitrarily shift the points relative to each galaxy, to avoid overlap. Only as a benchmark, we indicate on the top axis the stellar age that is associated with the corresponding color that is reported on the bottom axis, as derived from SSP models of solar metallicity. On average, the majority of the late-type bulges have redder colors than their surrounding disk. The bulge-to-disk color difference varies significantly from galaxy to galaxy, ranging from mag in NGC 2082, the only galaxy in our sample with a bulge bluer in than the disk, to magnitudes. The average value of color difference between the bulge and the disk is .
The right panel of Figure 9 shows the color of the bulge plotted versus the of the disk. The red solid line is the best fit to the observed values []. As a benchmark to illustrate the effects of reddening on this relationship, the arrows indicate the change in the bulges’ colors that is required in order to bring the observed points to the margin of the theoretical SSP grid (see Figure 2 and Table 5); the dashed red line represents the best fit derived to the relation as derived by using these estimate of the de-reddened colors []. The use of the CSP or ESFH models would require reddening only for one galaxy, NGC 3259, in an amount similar to the one derived from the SSP models. Thus, the adoption of the reddening values derived from the SSP grid allows us to show that the correlation between bulge and inner disk colors is robust towards the application of some reasonable reddening corrections.
The observed correlation between the colors of bulges and inner disks in late-type galaxies supports previous suggestions, also based on a single broad-band color, of a connection between the SFHs of these systems. This connection, however, appears to be more complex than previously suggested. It is in fact difficult to interpret a single (e.g., the ) color in terms of stellar population properties: the point is made by e.g., NGC 2082, which, in contrast with what is observed in , in has a bulge that is redder than the inner disk (Figure 10). When more than one color becomes available, it is clear that the link between the stellar population properties of bulges and inner disks in late-type spirals is not a trivial one. This is shown on the - plane of Figure 11, where the arrows describe the inner disk (end of arrows) and bulge (start of arrows) colors for the five galaxies for which we have extended enough measurements in all passbands. The bulges appear to be generally more metal-enriched than their surrounding disks; however, the age-metallicity relationship between bulges and their inner disks is rather complex and varies from galaxy to galaxy, in no systematic way. For example, in NGC 2082, the bulge is more enriched but younger than the surrounding disk, suggesting the occurrence of gas inflow and the generation of new stars in the center of this galaxy.
This complex situation, also found by Moorthy & Holtzman (2005) on the basis of dust-independent line strengths analysis, is at variance with what is found for the color differences between bulges and inner disks in early-type spirals, which are known to be not only small but also rather homogeneous (see e.g., Balcells & Peletier 1996). This can be seen from the gray shaded area in the Figure, which shows the scatter around the color differences between early-type bulges and their surrounding disks. The data are taken from Peletier & Balcells (1996), who published the average color difference (bulge-disk ) and of a sample of early-type spirals; we have converted these colors on our - diagram by adopting ; and . These relations were computed using SYNPHOT in STSDAS, for a 12 Gyr old stellar population with solar metallicity and exponential SFH with Gyr (parameters that are adequate to describe the stellar populations of massive bulges).
4 Discussion: Late-type bulge formation through cosmic history
While it is widely accepted that massive bulges are metal-rich and old stellar structures, it is often forgotten that a similar statement is true for their inner disks. The tight relation discussed above between ages and metallicities of bulges and inner disks in the early-type massive spirals indicates that the formation of these galactic subcomponents is highly correlated. There are several plausible scenarios to explain this, at least on a qualitative level, e.g., the inner disks in massive spirals might be either the high angular momentum left-overs of the mergers that formed the massive bulges, or the remnants of early dense disks within which instabilities led to the massive bulges (e.g., Avila-Reese et al. 2005). The large spread in stellar population properties unveiled in the central regions of the late-type spirals, instead, and, in particular, the spread in bulge stellar ages and the complex relationship between bulge and inner disk population properties, highlight more complex star formation histories for the late-type disk galaxies. An important question is whether the diverse star formation histories of the late-type bulges and inner disks are due to a variety of mechanisms acting over cosmic history, or to a single mechanism capable of acting at different epochs, and possibly over different timescales and with different efficiencies. The combination of stellar population and structural diagnostics can set some constraints.
4.1 Young late-type bulges
First, our results indicate that, in several late-type bulges, a substantial fraction of the stellar mass has a stellar age that is comparable with, or even younger than, the surrounding inner disks: In the universe, bulge formation –or at least bulge growth– can take place together with (or even after) the formation/accretion of the disk.
To be more specific, we compare the observed color distribution of our late-type bulges with the theoretical predictions of Bouwens et al. (1999). This comparison does not aim at a quantitative interpretation of the observed colors (as any model makes of course specific assumptions on several key factors), but rather to illustrate some global trends which can be trusted to be robust against variations in the model details. The Bouwens et al. models assume a fiducial disk evolution model that is constructed assuming that: (i) The formation times are identically distributed as in Lacey & Cole (1993), with the exception that the halo formation time is set equal to the time over which 25% (instead of 50%) of the final halo mass is assembled. The formation time of galaxies of a given luminosity is derived assuming a constant M/L ratio and the CDM power spectrum of White & Frenk (1991). (ii) Star formation in the disk starts at the halo formation time, and has an folding time Gyr. The latter is constrained by fitting the redshift color-magnitude relationship. (iii) The disk evolution in metallicity is given by the standard equations by Tinsley (1980), with the yields tuned, for each luminosity separately, to reproduce the observed disk metallicities. (iv) Dust is described by a screen model with an optical depth consistent with the observational constraints. (v) The stellar disk is well described by an exponential profile with a central surface brightness consistent with the Freeman (1970) law.
The bulge component is then added assuming three different prescriptions for bulge formation, namely: (1.) A secular evolution scenario (SE), in which bulges form dissipatively, after the disks, due to central star bursts generated by bar-driven inflow of gas into the galaxy centers; (2.) A simultaneous formation scenario (SF), in which the high angular momentum gas collapses to form the disk, while the low angular momentum gas, which sits closer to the center of the dark halo, forms the bulge; and (3.) An early formation scenario (EF), in which bulges form through mergers of disk galaxies, and the disk is then re-accreted at later times. For the three different families of bulge-formation models, spectra are computed using the Bruzual & Charlot instantaneous-burst metallicity-dependent spectral synthesis tables in order to determine the colors of bulges and disks.
In Figure 12, the solid, dotted and dashed lines represent, respectively, the predicted age-sensitive color distribution at z=0 for the SE, the SF and the EF models. The theoretical colors have been obtained by converting the colors originally published by Bouwens et al. (1999; the conversion takes into account a small contribution that is introduced by the adoption of the 2001 version of the B&C models). Since the color transformation depends on the SED of the object, we considered two bracketing cases, i.e., a 10 Gyr-old SSP with , for which we obtain , and a 1 Gyr-old SSP with , which gives . We adopt the relation , and associate with it an uncertainty of 0.1 magnitudes.
In the Figure, the models are normalized to the total number of galaxies in our sample, whose color distribution is represented by the solid histograms. Following Figure 6, we identify in Figure 12 the bulges that formed more than 50% of their stellar mass in the first 3 Gyrs of their SFH (red histogram), and those that formed less than 50% of their mass in stars in the same period (blue histogram). The Figure shows that the SF and EF models of Bouwens et al. cannot reproduce bulge colors bluer than . We have shaded this color-threshold to help visualizing the transition between red colors, that can be explained with any of the models, and blue colors that, within this set of models, are inconsistent with a bulge formation which is simultaneous or preceding the formation of the disks.
In principle, it could be argued that late halo formation times might remain an alternative explanation for the young ages of these blue systems; however, such late halo –and thus thin disk– formation times are not favored by realistic disk-heating arguments, and by observations of the number density evolution up to redshifts of disk galaxies of different sizes (Lilly et al. 1998; Sargent et al. 2006). Furthermore, different choices for the model parameters, e.g., a longer for the star formation in the disk, can of course alter the exact value of the color-threshold. At least qualitatively, however, it is reasonable to conclude that only bulge formation via secular evolution of the disks can explain the colors of the bluest late-type bulges.
Further indirect evidence in support of an internal origin rather than an external trigger for late bulge formation process that builds up the (blue) late-type bulges possibly comes from the correlation between the bulge half-light radii and the disk scalelengths which we show in the right panel of Figure 8 for the nine galaxies of our sample (see also, e.g., Graham 2001). It is not clear whether a satellite-accretion scenario could reproduce such a correlation; in contrast, numerical simulations of disk evolution driven by internal dynamical instabilities can reproduce this scaling law between the inner and outer regions of disk galaxies (e.g., Debattista et al. 2004).
4.2 Old late-type bulges
Not all late-type bulges in our sample argue however for a disk-first-bulge-after formation scenario. In fact, several of them have colors and thus stellar populations which are consistent with the more “classical” bulge-first-disk-after picture for the formation of bulges (e.g., Renzini 1999a,b; Renzini 2002). The mass assembly history of these old bulges is not strongly constrained by the observations. The old late-type bulges could well be the low-mass end of the merger remnants sequence. Given however that old and young late-type bulges appear to be one family, at least in terms of the bulge-disk size scaling relation, it is tempting to consider the possibility that even the old late-type bulges are, as it is plausible for their younger counterparts, the outcome of (likely internal) disk evolution processes.
Dissipationless evolution of early, dense stellar disks could be a viable process for the formation of old late-type bulges: the expected higher density of seed stellar disks in the early Universe provides favorable conditions for the development of dynamical instabilities that lead to the old bulges, and the younger disks that surround the late-type bulges today could have been easily accreted after the bulge formation event (see, e.g., Avila-Reese et al. 2005).
Another mode of disk evolution that can lead to the formation of bulges early-on in the history of the Universe is the fragmentation of gas-rich disks into massive dumps of subgalactic size, whose subsequent dynamical friction leads to spheroidal bulges embedded in exponential disks. In Debattista et al. (2006) we present SPH numerical simulations of live dark matter halos plus a baryonic stars+gas disk component that we performed with GASOLINE (Wadsley, Stadel & Quinn 2003). These simulations show that a gas-rich disk can become violently gravitationally unstable if it cools efficiently by radiation. The disk fragments into gaseous massive ( M⊙) clumps. Star formation is enhanced in these clumps, which spiral in towards the center, dragging with them the associated stellar clumps. The mergers of clumps produce a bulge component on a time scale of 10 inner disk orbital times, i.e., of at most a couple of Gyr.
The ability of the disk to fragment depends on the surface density of the gas component, which in turn scales as the virial mass in currently favored galaxy formation models (e.g., Mo, Mao & White). With a typical disk mass fraction relative to the halo mass, and a typical spin parameter of , a disk with km/s will fragment into clumps when about 70% of its mass is in the gas component (which guarantees a Toomre [1964] parameter Q approximately , a condition necessary for fragmentation of self-gravitating disks, Mayer et al. 2004). Given the typical circular velocities of our sample galaxies, it is thus possible that these became clump-unstable at early times, when most of their disk mass was in the gaseous form.
We illustrate the evolution of such a Milky-Way-like progenitor in Figure 13, where we show the face-on projected view of the gaseous and stellar densities of one of the SPH simulations of Debattista et al. (2006; see this paper for further details). In this specific simulation we sample the dark matter halo, the stellar disk and the gaseous disk using respectively , and particles, i.e., 50% of the baryonic mass is initially in the form of diffuse gas, which represents the partially ionized hydrogen component of the galaxy. The time interval between the top and the bottom images in the left panel of the Figure, during which this numerical model of a Milky-Way-like galaxy first forms the massive clumps and then transfers them to the center, and thus transitions from its smooth exponential initial conditions to its final, bulge+disk configuration, is about 1 Gyr. The final system is a late-type spiral with an old and almost exponential bulge (see the projected density profile shown in the bottom right panel of Figure 13), i.e, a system quantitatively similar to several of the galaxies that we have analyzed in this work, and similar to our own Galaxy.
Similar results have been found by Wada & Norman (2002), who use multi-phase grid-based simulations which includes supernovae heating in a small sub-volume of a galactic disk, and by Noguchi (1998), who use different numerical techniques as well as different models for the galaxies, and also finds fragmentation of gaseous disks into massive dumps of subgalactic size that ultimately leads to structures resembling present-day galaxies, with a spheroidal bulge and an exponential disk. It is interesting to note that images of high-z galaxies reveal morphologies which match astonishingly well the clumpy density distribution of Figure 13 (see e.g. Elmegreen et al. 2004). This provides further indirect evidence that this mechanism, together with the classical halo-mergers, monolithic collapse, and, possibly, even bar-driven secular evolution of dense seed disks, is a possible channel for the formation of old late-type bulges.
5 Concluding remarks
The main conclusions of our work are:
(1.) In our sample, several late-type bulges have underlying, diffuse stellar populations with optical/near-infrared blue colors that strongly support a bulge-after-disk formation scenario.
While satellite accretion onto the disk might be a player in forming bulges at late times, the correlation between disk and bulge scalelengths is possibly more naturally explained by bulge formation via disk instabilities (although it is not excluded that these might possibly be triggered by interactions). Observations of the high redshift universe show that the size-luminosity function of disk galaxies remains constant up to redshift of (Lilly et al. 1998; Sargent et al. 2006), and that a comparable fraction of bars is observed in disk galaxies at redshift (Eskridge 2002) and at redshift (Jogee et al. 2004; Sheth et al. 2006). Indeed the disks appear, rather early-on in their lives, to be massive enough and capable of forming bars. It is thus possibly not surprising that real barred disks are then able to become unstable to bar dissolution, and/or of fueling the galaxy centers of bulge-building dissipative material, as it is observed in computer models of disk galaxy evolution.
While our sample is too small to draw firm statistical conclusions, our results nonetheless suggest that a large fraction of the late-type galaxies that at host a bulge must have formed as pure bulgeless disks, and developed a bulge at later times. This population of pure-disks that has evolved into bulged-disks at later epochs adds to the pure exponential disk galaxies which are also observed at ; these alone account for at least of the galaxies classified as Sd and later types (Boeker et al. 2003). The sum implies that there must have been is a large population of bulgeless disk galaxies at high redshift, one that CDM cosmological simulations of galaxy formation at present do not predict, but must become able to provide. To date, cosmological simulations have not been able to produce realistic disks with a pure exponential profile.
(2.) The bulk of the stellar mass in the remaining late-type bulges in our sample is in old stellar populations, indicating that in some cases late-type-bulge formation can occur before the formation of the disks.
The old late-type bulges in our sample are very similar to the Milky Way Bulge in all respects: Not only most of their stellar mass in rather old stars (for the Milky Way, 10Gyr: Ortolani et al. 1995; Renzini 1999a, 2002; Zoccali et al. 2003), but also they show a similar relationship between disk and bulge scale-lengths, and have suffered from some rejuvenation at later times (see van Loon et al. 2003 for evidence for young stars in the Galactic Bulge). This result extends other recent work on the ages of spiral bulges (Thomas & Davies 2006) down to the smallest bulge masses. The Milky Way Bulge is thus not an exceptional late-type bulge, but rather a representative of the old-end-side of the distribution that is observed in the local population.
(3.) It is intriguing that, down to the mass scales of ”transition” between nuclear star clusters and bulges, the stellar age of the late-type bulges correlates with the bulge mass, which also however correlates with the galaxy mass. The current data are compatible with the galaxy mass governing the fraction of stellar mass that ends up in a bulge component, as well as the epoch of bulge formation. A question that we are currently investigating is whether there are also environmental effects that lead to an early or delayed formation of bulges in the Universe. To achieve this goal we are undertaking the Zurich ENvironmental survey (ZENs), to study galaxies that are known members of 185 nearby galaxy groups (selected from the 2PIGG galaxy group catalogue, Eke et al. 2004, which has been constructed starting from the 2dFGRS, Colless et al. 2001). The ZENs groups cover a large range of group masses, virial radii, densities, and location relative to the filamentary large-scale-structure in which they are embedded; the groups are also being observed with the GBT at radio wavelengths to map their HI content. We expect that the ZENs systematic census at redshift zero of bulge properties as a function of group environment, coupled with our ongoing numerical experiments of disk evolution, which we are now extending to explore a range of environmental conditions, will be able to establish the role of the local and large-scale-structure environment in the development of the central regions of disk galaxies.
Finally, an important question that we have left open is how the properties of the late-type bulges and inner disks that we have presented here relate to the properties of the nuclear star clusters that sit in the centers of these galaxies. We address this issue in Paper 2.
References
- Avila-Reese et al. (2005) Avila-Reese, V., Carrillo, A., Valenzuela, O., & Klypin, A. 2005, MNRAS, 361, 997
- Benedict et al. (2002) Benedict, G. F., Howell, D. A., Jørgensen, I., Kenney, J. D. P., & Smith, B. J. 2002, AJ, 123, 1411
- Bevington & Robinson (1992) Bevington, P. R. & Robinson, D. K. 1992, New York: McGraw-Hill, 1992, 2nd ed.
- Böker, Stanek, & van der Marel (2003) Böker, T., Stanek, R., & van der Marel, R. P. 2003, AJ, 125, 1073
- Bouwens et al. (1999) Bouwens, R., Cayón, L., & Silk, J. 1999, ApJ, 516, 77
- Bruzual & Charlot (2003) Bruzual, G., & Charlot, S. 2003, MNRAS, 344, 1000
- Bruzual & Charlot (1993) Bruzual A., G., & Charlot, S. 1993, ApJ, 405, 538
- Caon et al. (1993) Caon, N., Capaccioli, M., & D’Onofrio, M. 1993, MNRAS, 265, 1013
- Cardelli, Clayton, & Mathis (1989) Cardelli, J. A., Clayton, G. C., & Mathis, J. S. 1989, ApJ, 345, 245
- Carollo et al. (1997) Carollo, C. M., Stiavelli, M., de Zeeuw, P. T., & Mack, J. 1997, AJ, 114, 2366
- Carollo et al. (1998) Carollo, C. M., Stiavelli, M., & Mack, J. 1998, AJ, 116, 68
- Carollo & Stiavelli (1998) Carollo, C. M. & Stiavelli, M. 1998, AJ, 115, 2306
- Carollo (1999) Carollo, C. M. 1999, ApJ, 523, 566
- Carollo et al. (2001) Carollo, C. M., Stiavelli, M., de Zeeuw, P. T., Seigar, M., & Dejonghe, H. 2001, ApJ, 546, 216
- Carollo et al. (2002) Carollo, C. M., Stiavelli, M., Seigar, M., de Zeeuw, P. T., & Dejonghe, H. 2002, AJ, 123, 159
- Carollo (2004) Carollo, C.M., 2004, in “ Coevolution of Black Holes and Galaxies”, Cambridge University Press, as part of the Carnegie Observatories Astrophysics Series. Ed. L. C. Ho, p. 231.
- (17) Colless, M., et al., 2001, MNRAS, 328, 1039
- Debattista, Carollo, Mayer, & Moore (2004) Debattista, V., Carollo, C. M., Mayer, L., & Moore, B. 2004, ApJ, 604, L93
- (19) Debattista, V., Carollo, C. M., Mayer, L., & Moore, B. 2005, ApJ, 628, 678
- (20) Debattista, V., Mayer, L., Carollo, C. M., & Moore, B. 2006, ApJ, in press (astroph/0509310)
- de Vaucouleurs et al. (1991) de Vaucouleurs, G., de Vaucouleurs, A., Corwin, H., Buta, R. J., Paturel, G., & Fouque, P. 1991, Third Reference Catalogue of Bright Galaxies, New York: Springer–Verlag
- (22) Disney, M., et al., 1989, MNRAS, 239, 939
- (23) Eke, V.R., et al. 2004, MNRAS, 348, 866
- (24) Elmegreen, D., et al. 2004, ApJ, 603, 74
- Eskridge et al. (2002) Eskridge, P. B., et al. 2002, ApJS, 143, 73
- Freeman (1970) Freeman, K. C. 1970, ApJ, 160, 811
- Graham (2001) Graham, A. W. 2001, AJ, 121, 820
- (28) Hernquist, L. & Mihos, J.C. 1995, ApJ, 448, 41
- Hughes et al. (2003) Hughes, M. A., et al. 2003, AJ, 126, 742
- Jarrett (2004) Jarrett, T. 2004, Publications of the Astronomical Society of Australia, 21, 396
- Jedrzejewski (1987) Jedrzejewski, R. I. 1987, MNRAS, 226, 747
- Jogee et al. (2004) Jogee, S., et al. 2004, ApJ, 615, L105
- Kannappan et al. (2004) Kannappan, S. J., Jansen, R. A., & Barton, E. J. 2004, AJ, 127, 1371
- (34) Kauffmann, G. 1996, MNRAS, 281, 487
- Kilborn et al. (2002) Kilborn, V. A., et al. 2002, AJ, 124, 690
- (36) Knapen, J.H. et al. 1995, ApJ, 443, L73
- (37) Kormendy, J., 1993, in Galactic Bulges, Eds. H. Dejonghe & H. Habing, Kluwer, p.209
- Kormendy & Kennicutt (2004) Kormendy, J. & Kennicutt, R., 2004, ARA&A 42, 603
- Krist & Hook (2001) Krist, J. & Hook, R. 2001, The TinyTim User’s Guide, Version 6.0 (Baltimore: STScI)
- Lacey & Cole (1993) Lacey, C., & Cole, S. 1993, MNRAS, 262, 627
- Lilly et al. (1998) Lilly, S., et al. 1998, ApJ, 500, 75
- MacArthur et al. (2004) MacArthur, L. A., Courteau, S., Bell, E., & Holtzman, J. A. 2004, ApJS, 152, 175
- (43) Masters, K., et al. 2003, AJ, 126, 158
- Mayer et al. (2004) Mayer, L., Quinn, T., Wadsley, J., & Stadel, J. 2004, ApJ, 609, 1045
- (45) Moorthy, B.K., Holtzman, J.A., 2005, astro-ph/0512346
- Noguchi (1998) Noguchi, M. 1998, Nature, 392, 253
- Norman, Sellwood, & Hasan (1996) Norman, C. A., Sellwood, J. A., & Hasan, H. 1996, ApJ, 462, 114
- (48) Ortolani, S., et al., 2005, Nature, 377, 701
- Paturel et al. (2003) Paturel, G., Petit, C., Prugniel, P., Theureau, G., Rousseau, J., Brouty, M., Dubois, P., & Cambrésy, L. 2003, A&A, 412, 45
- Pavlovsky et al. (2005) Pavlovsky, C., et al. 2005, ”ACS Data Handbook”, Version 4.0, (Baltimore: STScI).
- Peletier & Balcells (1996) Peletier, R. F., & Balcells, M. 1996, AJ, 111, 2238
- Peletier et al. (1999) Peletier, R. F., Balcells, M., Davies, R. L., Andredakis, Y., Vazdekis, A., Burkert, A., & Prada, F. 1999, MNRAS, 310, 703
- (53) Renzini, A., 2002, in Chemical Enrichment of Intracluster and Intergalactic Medium, Eds. R. Fusco-Femiano & F. Matteucci, ASP, p.331
- (54) Renzini, A., 1999a, Ap&SS, 267, 357
- (55) Renzini, A., 1999b, in The formation of galactic bulges, Eds. C.M. Carollo et al. CUP, p.9
- Salpeter (1955) Salpeter, E. E. 1955, ApJ, 121, 161
- Sargent et al. (2006) Sargent, M., et al. 2006, ApJ, submitted
- Scarlata et al. (2004) Scarlata, C., et al. 2004, AJ, 128, 1124
- Schlegel et al. (1998) Schlegel, D. J., Finkbeiner, D. P., & Davis, M. 1998, ApJ, 500, 525
- Seigar et al. (2002) Seigar, M., Carollo, C. M., Stiavelli, M., de Zeeuw, P. T., & Dejonghe, H. 2002, AJ, 123, 184
- Sersic (1968) Sersic, J.-L. 1968, Atlas de Galaxias Australes (Cordoba: Obs. Astron.)
- Shen & Sellwood (2004) Shen, J., & Sellwood, J. A. 2004, ApJ, 604, 614
- Sirianni et al. (2005) Sirianni, M., Jee, M.J., Benítez, N., Blakeslee, J.P., Martel, A.R., Clampin, M., de Marchi, G., Ford, H.C., Gilliland, R., Hartig, G.F., Illingworth, G.D., Mack, J., McCann, W.J., & Meurer, G. 2005, PASP, 117, 1049
- (64) Thomas, D., et al. 2005, ApJ, 621, 673
- (65) Thomas, D., & Davies, R., 2006, astroph/0512415
- (66) Tinsley, B., 1980, Fundamentals of Cosmic Physics, Volume 5, pp. 287
- Toomre (1964) Toomre, A. 1964, ApJ, 139, 1217
- Tully et al. (1998) Tully, R. B., Pierce, M. J., Huang, J.-S., Saunders, W., Verheijen, M. A. W., & Witchalls, P. L. 1998, AJ, 115, 2264
- van Loon et al. (2003) van Loon, J. T., et al. 2003, MNRAS, 338, 857
- (70) Xilouris, E., et al. 1999, A&A, 344, 868
- (71) Wada, K. & Norman, C., 2002, ApJ, 577, 197
- (72) Wadsley, J., Stadel, J., & Quinn, T., 2004, New Astronomy, 9, 137
- White & Frenk (1991) White, S. D. M., & Frenk, C. S. 1991, ApJ, 379, 52
- Wyse et al. (1997) Wyse, R., Gilmore, G., Franx, M., 1997, ARAA, 35, 637
- Wyse (1998) Wyse, R. F. G. 1998, MNRAS, 293, 429
- (76) Wyse, R. F. G. 2001, in ‘Galaxy Disks and Disk Galaxies’, ASP Conference series volume 230, eds J.G. Funes & E.M. Corsini (San Francisco: ASP) p71
- Wyse (2004) Wyse, R. F. G. 2004, ApJ, 612, L17
- Zoccali et al. (2003) Zoccali, M., et al. 2003, A&A, 399, 931
APPENDIX A: Observations, data reduction and analysis
A.1 The sample properties, the data and the data reduction
To illustrate the properties of our small sample relative to the entire late-type disk galaxy population, Figure 14 shows the comparison between disk scale lengths, rotational velocities, densities, and total magnitudes for our nine galaxies (black points) and for the 172 objects of the ground–based sample of MacArthur et al. (2004) (shaded grey area); Figure 15 shows the distribution of bulge Sersic indices and bulge half-light radii for our galaxies (shaded histograms) and for the MacArthur et al. sample.
The galaxies were observed with the ACS in the F435W () and F814W () filters using the WF camera. The pixel scale the WF camera is of 005 px-1, providing a total field of view of 3434. We also observed our sample galaxies with the F330W () filter using the ACS HR channel, whose pixel scale is 0027 px-1, for a total field of view of . The images had too low a signal to noise in the continuum to perform, e.g., isophotal fits (see Appendix A.2.1); they were thus not used to investigate the properties of the bulges and inner disks, which constitute the focus of this paper. We were able however to use the ACS data to study the compact sources in the galaxies, including the nuclear star clusters located in the isophotal centers. We postpone to Paper 2 a detailed discussion of the photometrically-distinct sources detected in the images, and their relation to the host galaxies.
Details of the observations, including the number of single exposures and exposure times are listed in Table 7 (for completeness, also for the -band data). The raw data were processed with the standard ACS pipeline (CALACS) in order to use the best reference files available at the time of reduction for flat-field, bias and dark frames, and distortion correction tables. For each filter, the relative alignment of the individual exposures was checked to be better than 0.2 pixels. The individual exposures were then added together using the IRAF333IRAF is distributed by NOAO, which is operated by AURA Inc., under contract with the National Science Foundation. STSDAS task ACSREJ, in order to obtain a cosmic-ray cleaned image in each filter. Hot and cold pixels were partly removed during the combination process, and some remaining hot pixels were identified and then removed from the final images by interpolation.
No sky was subtracted from the images due to the small field of view. Sky subtraction was however carried out for all galaxies in the and images. We first computed the median of the pixel distribution of each image (). Contamination by the galaxy and other astronomical sources was removed by means of a multi-step procedure. We first rejected all the pixels with flux greater than from . After this cutoff, the background was measured by fitting a Gaussian to the distribution of values in the remaining pixels. We compared the results obtained using this method with measurements of the sky level in apertures of pixels located far from obvious galaxy emission and other sources. We found very good agreement between the two sky estimates. For the few cases where it was possible, we checked the accuracy of our sky subtraction by comparing the outer parts of our radial surface brightness profiles with published ground-based photometry, and found good agreement.
The photometric calibration was done by converting instrumental magnitudes to the VEGAMAG magnitude systhem by applying the phototmetric zeropoints derived from Pavlovsky et al. (2005). We used: 25.770 for WFC-F435W images, 25.487 for WFC-F814W, and 22.927 for HRC-F330W. All magnitudes were corrected for Galactic extinction following Schlegel, Finkbeiner & Davis (1988). Since the ACS filters differ from the Johnson-Cousins bandpasses, reddening corrections were computed using the effective transmission curve for each ACS filter created with the task CALCBAND in the SYNPHOT package.
A.2 The basic analysis
A.2.1 Isophotal fits
For each galaxy, surface brightness profiles in and were extracted by fitting ellipses to the isophotes using the IRAF isophote-fitting program ELLIPSE (Jedrzejewski 1987).
Masks were used in the isophotal fits so as to cover stars, star forming regions, star clusters, as well as dust patches and lanes. The masks were obtained by means of an iterative procedure applied to the images. Specifically, for each galaxy we performed an isophotal fit to the image without constraining the center, the ellipticity, and the position angle of the ellipses. The resulting smooth galaxy model was subtracted from the original data, and the difference-image was normalized by dividing it by the original image. A mask frame was then obtained from the normalized difference-image by setting to 1 all the pixels for which the difference between the model and the data was greater than a given threshold between 30% and 70%, depending on the galaxy, and setting to zero all other pixels. This procedure was reiterated until an acceptable mask was obtained, as judged by visual inspection. Masks created with this technique are able to mask the vast majority of contaminating sharp features, but would of course not affect any smooth component, e.g., a smooth dust distribution, which would remain undetected.
For each galaxy, the best fit isophotal parameters (center, ellipticity, position angle) were obtained from the masked -band images. The morphological parameters obtained from the images were then kept fixed in performing the final isophotal fits to the images.
The and surface brightness and morphological profiles for the sample galaxies are presented in Figures 16 and 17, respectively. All profiles are available in electronic tabular form from the ApJ database (Tables 8 to 28; these also include extended -band NICMOS+2MASS profiles, see below).
A.2.2 Bulge-Disk photometric decomposition
The wide field of view of the ASC-WFC allowed us to extract relatively extended radial surface brightness profiles up to 50 arcseconds from the center, i.e., well into the disk component for the majority of the galaxies. This allows us to perform more accurate bulge-disk decompositions than previously obtained for these galaxies by using the WFPC2 data (Carollo et al. 1997; Carollo et al. 1998).
The surface brightness profiles where modeled with a bulge plus disk model. We assumed an exponential radial profile for the disk component (), while we used the general Sérsic profile (, Sersic 1968) for the bulge component. The analytical expression used for the Sérsic profile is given by:
| (3) |
where is the Sérsic index, is the bulge effective surface brightness, is the bulge half-light radius, and (Caon et al. 1993). When the Sérsic profile corresponds to an exponential law, when it corresponds to a de Vaucouleurs profile. The two parameters describing the shape of the exponential disk profile are the disk central surface brightness and the disk scale length .
In order to derive the five parameters describing the galaxy profiles we iteratively fitted the two-component analytical model to the observed surface brightness profiles using a non–linear minimization based on the Levenberg–Marquardt method (e.g., Bevington & Robinson 1992). The band profiles were chosen as they are less affected by spurious ripples and structures induced by residual dust or star formation features. For each galaxy, the analytical fits to the observed profile were performed over an optimized radial range and after convolving the model with the appropriate instrumental PSF. The structural parameters derived from the analytical -band fits were then kept constant when fitting the and surface brightness profiles.
The presence of the nuclear star clusters is a source of uncertainty in deriving the parameters describing the underling galaxy light (e.g., Carollo e al. 1998). As in our previous analyses (Carollo et al. 1998; Carollo & Stiavelli 1998; Scarlata et al. 2004), we fitted the galaxy model outside the radial region affected by the nuclear source, and estimated the uncertainties in the derived parameters by changing the radial range over which the fit was performed by 01. The range of radii explored for each individual galaxy is listed in Table 2.
The PSF-convolved best fit models are overplotted on the observed ACS surface brightness profiles in Figures 16, 17. To show the consistency of the derived models with the NICMOS -band profiles of Seigar et al. we present them overplotted on the data in Figure 18. When possible, we extended the radial coverage of the NICMOS data by adding properly matched surface brightness profiles derived by fitting ellipses to the public 2MASS data (Jarrett 2004). For NGC 2758, ESO498G5 and ESO499G37 the 2MASS data had too low S/N and were thus not considered. For all galaxies, disk and bulge profiles are represented with dotted and dashed lines, respectively; the total profiles are indicated by a solid line. The combined NICMOS+2MASS surface brightness profiles are also available in electronic tabular form.
In Tables 2 and 3 we report the best-fit parameters for the bulge and the disk components of each galaxy. For the bulges, these are the bulge half–light radius , the bulge total apparent magnitude , the bulge Sersic index . For the disk, the listed parameters are the disk scale length , and the central surface brightness .
Consistent with other studies (see Kormendy & Kennicutt 2004, and references therein), the Sersic indices of the nine galaxies are significantly smaller than the value which identifies a deVaucouleur’s profile, and are close to the value which describes an exponential profile.
A.2.3 The color profiles
The HST/ACS Point Spread Function (PSF) varies with wavelength, field position, and time, due to a combination of defocus, coma, astigmatism, and jittering of the telescope (Sirianni et al. 2005). Since no point sources were available near the nucleus of the observed galaxies, we created the appropriate and PSFs for each galaxy using the TinyTim software (Krist & Hook 2001). We first computed geometrically distorted PSFs in the observed position of the center of each galaxy. The distorted PSF was then corrected for geometric distortion and rotated using DRIZZLE with the same parameters we used to combine the galaxy exposures. With this procedure, the spikes of the synthetic PSF are aligned with those of the science images.
We used the PSFs to convolve the analytical models to the surface brightness profiles before performing the fits (as this procedure is more stable to PSF uncertainties than deconvolving the data). Furthermore, for the purpose of deriving the color profiles, the and final frames were matched to the same PSF by convolving each band with the PSF of the other band. We then derived the and surface brightness profiles on these PSF-convolved images, by performing the same isophotal analysis described in the previous section, and the color profiles by subtracting the PSF--convolved surface brightness profiles from the PSF--convolved profiles.
Figure 10 (discussed in the main text) show the color profiles as a function of distance to the center normalized to the bulge effective radius . In order to increase the signal–to–noise ratio of the color profiles, we binned the surface brightness profiles of the PSF–crossconvolved images in steps of 1 .
In Figure 10, the innermost points of the color profiles corresponds to the average bulge color as derived from the photometric decomposition discussed above. The observed color profiles have different properties from galaxy to galaxy. However, a general feature of the color profiles is the similarity of the color of the bulge with respect to the colors of the inner disk, which we discuss in Section 3.3.
A.3 The effects of dust
Although scattering from dust is expected to be small in galaxies with a relatively low inclination as in our sample (as the probabilities that photons are scattered into or out the line of sight are similar; Byun et al. 1994), there is no doubt that extinction by dust can alter the colors and color gradients that we are using as diagnostics of stellar population properties. However, in contrast with ground-based studies of color images, in which sharp dust lanes and patches would be smeared out at the typical seeing, our analysis, conducted at the resolution of the ACS camera, allows us to resolve these sharp features, which are masked out in our analysis. Of course, a dust component that would appear as smooth and diffuse at the ACS resolution would remain undetected. If such a component is present, its spatial distribution and effective optical depth remain unconstrained. We therefore investigated its impact on our main conclusions, for two different dust models.
In the first place we adopted a simple foreground screen model to quantify the effects of dust extinction on colors, using the extinction curve from Cardelli et al. (1989). Although the approximation of a foreground screen is clearly unrealistic, such a model is used in most of the literature, and it is thus convenient to consider it here as well, for a straightforward comparison with other works. We show, in the Figures reporting our analysis, the foreground-screen reddening vector for an extinction in the band of 0.5 magnitudes.
A more realistic dust model has been discussed in Disney et al. (1989). This model assumes that the stars and dust have exponential distributions in both the radial and vertical directions with radial scale lengths and , and vertical scale lengths and ; the model has also been adopted by MacArthur et al. to discuss their results on late-type galaxies. These authors adopt the same vertical and radial scale length ratios for the dust and stars, and a central band optical depth of , in agreement with multi-band surface brightness profile modeling of massive edge-on disks and 2MASS analyses of disk galaxies (Xilouris et al. 1999; Masters et al. 2003). In Figure 2 we plot the reddening vector for this realistic dust model as obtained using a similar set of parameters as in McArthur et al. This reddening vector lies rather close to parallel to the one obtained for the foreground screen model, indicating that our main conclusions are valid independent of which of the two dust model distributions that we have discussed is considered.
Two final considerations alleviate our concerns regarding the possible impact of diffuse dust on our results. First, there appears to be some consensus that dust does not play a major role in establishing the colors in late-type spiral galaxies. Specifically, the comparison of optical/near-infared colors of edge-on and face-on spiral galaxies indicates that dust plays little role in the color properties of disk galaxies with km s-1 (Dalcanton & Bernstein 2002), which is the case for the majority of the galaxies in our sample. Second, in order to explain as purely dust effects the red colors of some of the bulges, or the color variations between bulges and inner disks, an average central optical depth of would be required. This is significantly larger than the value estimated on average for late-type disk galaxies (Xilouris et al. 1999). Of course, future high-resolution ultraviolet and infrared data are ultimately awaited to confirm (or deny) these expectations.
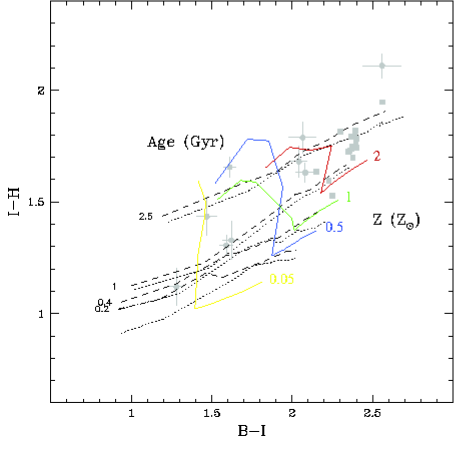
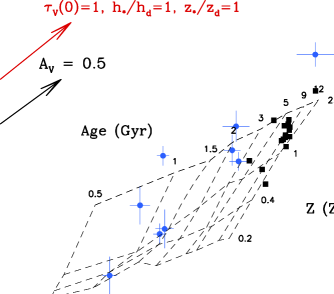
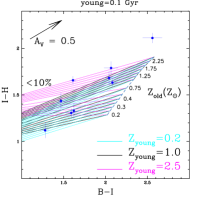
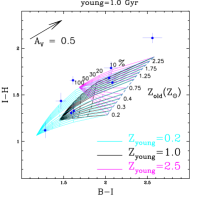
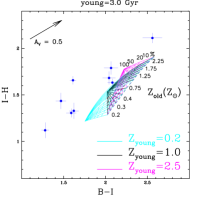
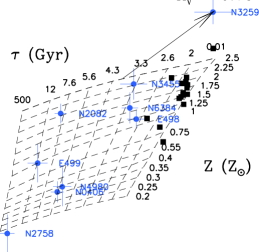
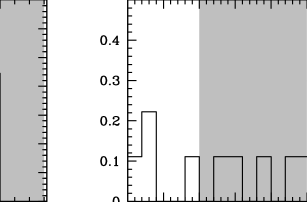
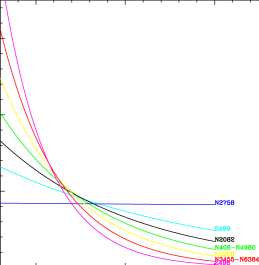


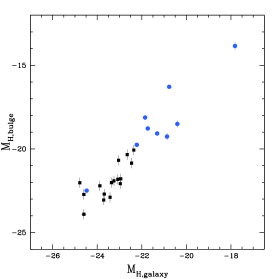
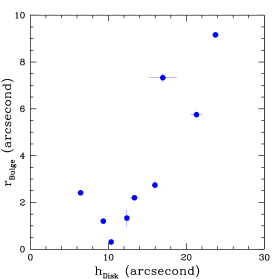
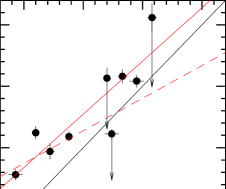
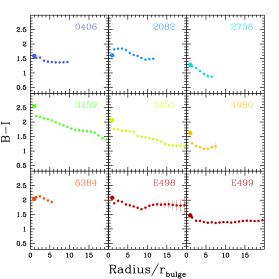
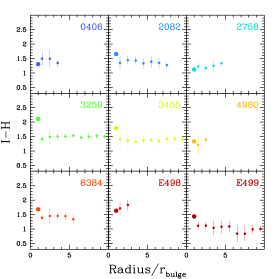
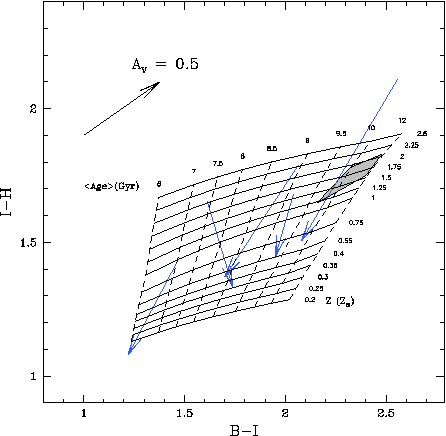
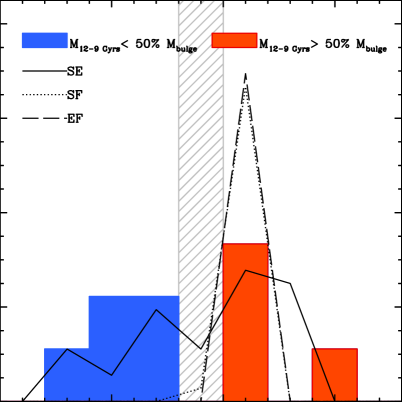
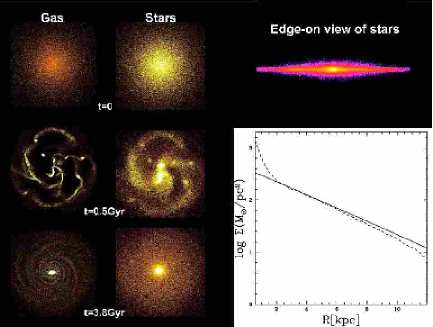


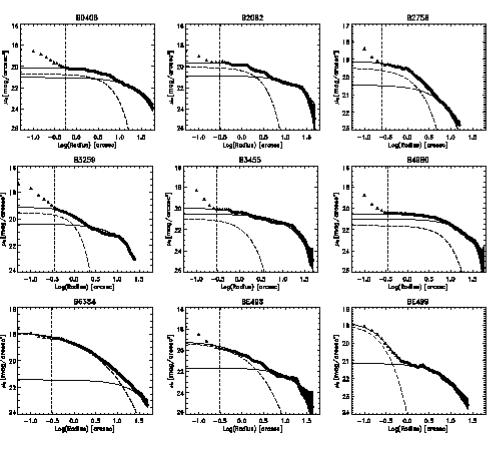
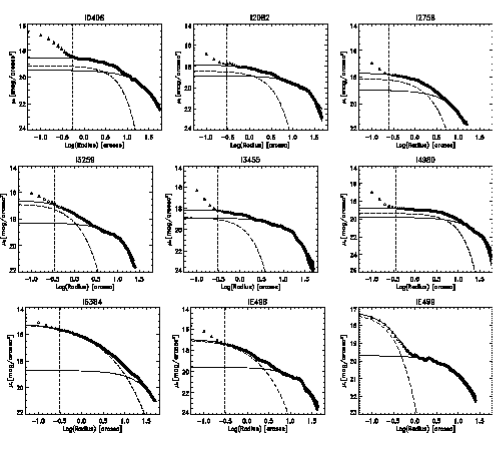
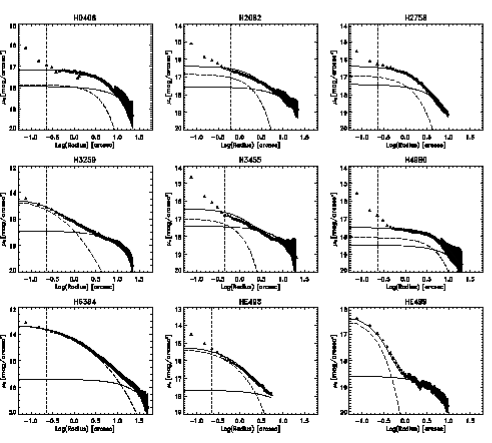
| Name | (J2000) | (J2000) | D | Type | E() | MH | ||
|---|---|---|---|---|---|---|---|---|
| (h m s) | (deg ′ ′′) | (mag) | (Mpc) | (mag) | (mag) | (km s-1) | ||
| [1] | [2] | [3] | [4] | [5] | [6] | [7] | [8] | [9] |
| NGC 0406 | 01 07 24.10 | 69 52 35.0 | 13.10 | 23 | SAS5*/Sc | 0.024 | ||
| NGC 2082 | 05 41 51.20 | 64 18 04.0 | 12.62 | 19 | SBR3/SBb | 0.057 | ||
| NGC 2758 | 09 05 30.80 | 19 02 38.0 | 13.46 | 30 | PSB.4P?/Sbc | 0.129 | ||
| NGC 3259 | 10 32 34.68 | 65 02 26.8 | 12.97 | 27 | SXT4*/SBbc | 0.011 | ||
| NGC 3455 | 10 54 31.20 | 17 17 02.8 | 12.87 | 19 | PSXT3/… | 0.027 | ||
| NGC 4980 | 13 09 10.20 | 28 38 28.0 | 13.19 | 22 | SXT1P?/SBa | 0.077 | ||
| NGC 6384 | 17 32 24.42 | 07 03 36.8 | 11.14 | 26 | SXR4/SBbc | 0.150 | ||
| ESO 0498G5 | 09 24 41.10 | 25 05 33.0 | 13.96 | 37 | SXS4P/SBbc | 0.107 | - | |
| ESO 0499G37 | 10 03 42.10 | 27 01 39.0 | 13.15 | 14 | SXS7*/SBc | 0.075 |
Note. — Right ascension, Declination, and total blue magnitude are from the RC3 catalog (deVaucouleurs et al. 1991). Morphological classification are from the RC3 (left) and from the UGC (right) catalogs. The color excess B-V is taken from Schlegel et al. (1988). The galaxy absolute -band magnitude MH is computed using the 2-MASS observed magnitude and the listed distance. The last column lists from Paturel et al. (2003), except for NGC 2082 for which was derived from (H I line velocity width at 20% of the maximum) taken from Kilborn et al. (2002).
| r0-r | mB,bulge | mI,bulge | mH,bulge | Sersic | ||
|---|---|---|---|---|---|---|
| Name | (′′) | (mag) | (mag) | (mag) | (′′) | |
| NGC 0406 | 0.55–57 | 15.61 0.05 | 14.020.04 | 12.720.05 | 5.75 0.06 | 0.73 0.07 |
| NGC 2082 | 0.30–47 | 16.51 0.01 | 14.900.04 | 13.240.03 | 2.74 0.18 | 0.80 0.08 |
| NGC 2758 | 0.25–16 | 16.21 0.03 | 14.930.03 | 13.810.08 | 2.41 0.08 | 0.96 0.07 |
| NGC 3259 | 0.35–25 | 18.04 0.10 | 15.480.05 | 13.370.01 | 1.20 0.11 | 1.04 0.10 |
| NGC 3455 | 0.30–50 | 18.95 0.06 | 16.890.07 | 15.100.03 | 1.33 0.34 | 0.80 0.24 |
| NGC 4980 | 0.35–57 | 15.36 0.03 | 13.740.05 | 12.410.07 | 7.33 0.18 | 0.76 0.06 |
| NGC 6384 | 0.30–50 | 13.22 0.05 | 11.180.06 | 9.490.03 | 9.16 0.01 | 1.96 0.01 |
| ESO 498G5 | 0.30–43 | 16.74 0.06 | 14.660.01 | 13.030.04 | 2.20 0.03 | 1.55 0.03 |
| ESO 499G37 | 0.05–25 | 19.75 0.06 | 18.280.02 | 16.840.08 | 0.31 0.01 | 0.96 0.04 |
Note. — Best–fit parameters for the bulge component of each galaxy. Specifically, listed are the bulge half–light radius , the bulge total apparent magnitude , and the bulge Sersic index . The range of radii used for the fits are listed in the second column.
| r0-r | |||||
|---|---|---|---|---|---|
| Name | (′′) | (′′) | (mag/”2) | (mag/”2) | (mag/”2) |
| NGC 0406 | 0.55–57 | 21.300.70 | 21.09 0.02 | 19.480.01 | 17.93 0.12 |
| NGC 2082 | 0.30–47 | 15.970.36 | 20.88 0.03 | 18.860.03 | 17.55 0.13 |
| NGC 2758 | 0.25–16 | 6.440.36 | 20.57 0.08 | 18.960.15 | 17.41 0.12 |
| NGC 3259 | 0.35–25 | 9.350.12 | 20.37 0.01 | 18.280.01 | 16.90 0.05 |
| NGC 3455 | 0.30–50 | 12.380.24 | 20.55 0.01 | 18.900.01 | 17.40 0.06 |
| NGC 4980 | 0.35–57 | 16.981.80 | 21.17 0.08 | 19.800.30 | 18.46 0.04 |
| NGC 6384 | 0.30–50 | 23.730.42 | 21.43 0.40 | 18.710.03 | 17.37 0.85 |
| ESO 498G5 | 0.30–43 | 13.340.54 | 21.75 0.03 | 19.570.03 | 17.66 0.70 |
| ESO 499G37 | 0.05–25 | 10.360.27 | 21.11 0.01 | 19.700.01 | 18.55 0.07 |
Note. — Best–fit parameters for the disk components of each galaxy. The listed parameters are the disk scale length , and the central surface brightness . The range of radii used for the fits are listed in the second column.
| Name | (mag) | (mag) |
|---|---|---|
| NGC 0406 | 0.211 | - |
| NGC 2082 | 0.128 | 0.325 |
| NGC 2758 | 0.35 | - |
| NGC 3259 | 0.479 | 0.607 |
| NGC 3455 | 0.366 | 0.418 |
| NGC 4980 | 0.522 | - |
| NGC 6384 | 0.092 | 0.239 |
| ESO 498G5 | 0.252 | - |
| ESO 499G37 | 0.249 | 0.357 |
Note. — Color differences between the bulge colors, derived using the bulge-disk photometric decompositions based, for all bands, on the shapes of the -band analytical fits to the surface brightness profiles, and the colors of the disks, as estimated at a galactocentric distance of 5 bulge half-light radii. The colors are corrected for Galactic extinction.
| Name | Z | Bulge Mass | ||
|---|---|---|---|---|
| (Gyr) | () | (/) | () | |
| NGC 0406 | 1.5 | 0.75 | 0.65 | |
| NGC 2082a | 0.5 | 2.0 | 0.36 | |
| NGC 2758 | 1.0 | 0.4 | 0.58 | |
| NGC 3259b | 0.5 | 2.0 | 0.36 | |
| NGC 3455c | 1.0 | 2.0 | 0.48 | |
| NGC 4980 | 1.5 | 1.0 | 0.70 | |
| NGC 6384 | 2.0 | 2.0 | 0.70 | |
| ESO 498G5 | 3.0 | 1.5 | 0.71 | |
| ESO 499G37 | 1.0 | 1.5 | 0.54 |
Note. — The first two columns list the best fit age and the metallicity of the bulge stellar population derived using the BC01 SSP models. The remaining columns list the the mass-to-light ratio in the band , and the mass of the bulge.
a Assumed .
b Assumed .
c Assumed .
| Name | Z | % | % | |
|---|---|---|---|---|
| (Gyr) | () | () | () | |
| NGC 0406 | 5.6 | 0.35 | 47 | 9 |
| NGC 2082 | 7.6 | 2.00 | 41 | 12 |
| NGC 2758 | 500 | 0.20 | 25 | 25 |
| NGC 3259a | 4.3 | 2.50 | 53 | 7 |
| NGC 3455 | 3.3 | 2.25 | 61 | 4 |
| NGC 4980 | 5.6 | 0.35 | 47 | 9 |
| NGC 6384 | 3.3 | 1.50 | 61 | 4 |
| ESO 498G5 | 2.6 | 1.25 | 69 | 2 |
| ESO 499G37 | 12. | 1.00 | 35 | 16 |
Note. — Metallicity and folding time describing the best fit ESFHs of the galaxies. The last two columns list the fraction of mass formed between 12 and 9 Gyrs ago, and in the last 3 Gyrs, respectivelly.
a Assumed .
| tf330w | tf435w | tf814w | |
|---|---|---|---|
| (s) | (s) | (s) | |
| NGC 0406 | |||
| NGC 2082 | |||
| NGC 2758 | |||
| NGC 3259 | , | ||
| NGC 3455 | |||
| NGC 4980 | |||
| NGC 6384 | |||
| ESO 498G5 | |||
| ESO 499G37 |
Note. — Number of exposures and exposure times of the ACS observations in the filters F330W, F435W, and F814W. All the observations were taken with gain 2 with both HRC–F330W and WFC–F814W images, and with gain 1 for WFC–F435W (except for NGC 3259 which was observed with gain).