Protoclusters associated with radio galaxies ††thanks: Based on observations carried out at the European Southern Observatory, Paranal, Chile, programs 66.A-0597, LP167.A-0409, 68.B-0295 and 70.A-0589. Also based on data obtained at the W.M. Keck Observatory, which is operated as a scientific partnership among the California Institute of Technology, the University of California and the National Aeronautics and Space Administration. The Observatory was made possible by the generous financial support of the W.M. Keck Foundation.
We present the results of a large program conducted with the Very Large Telescope and augmented by observations with the Keck telescope to search for forming clusters of galaxies near powerful radio galaxies at . Besides MRC 1138–262 at , the radio galaxy observed in our pilot program, we obtained narrow- and broad-band images of eight radio galaxies and their surroundings. The imaging was used to select candidate Ly emitting galaxies in Mpc2 areas near the radio galaxies. A total of 300 candidate emitters were found with a rest-frame Ly equivalent width of EW Å and significance EWEW. Follow-up spectroscopy was performed on 152 candidates in seven of the radio galaxy fields. Of these, 139 were confirmed to be Ly emitters, four were low redshift interlopers and nine were non-detections. With the adopted criteria the success rate is %. In addition, 14 objects with EW and/or were confirmed to be Ly emitters. Combined with the 15 Ly emitters near MRC 1138–262, we have determined Ly redshifts for 168 objects near eight radio galaxies.
At least six of our eight fields are overdense in Ly emitters by a factor 3–5 as compared to the field density of Ly emitters at similar redshifts, although the statistics in our highest redshift field () are poor. Also, the emitters show significant clustering in velocity space. In the overdense fields, the width of the velocity distributions of the emitters is a factor 2–5 smaller than the width of the narrow-band filters. Taken together, we conclude that we have discovered six forming clusters of galaxies (protoclusters). We estimate that roughly 75% of powerful ( erg s-1 Hz-1 sr-1) high redshift radio galaxies reside in a protocluster. The protoclusters have sizes of at least Mpc, which is consistent with the structure sizes found by other groups. By using the volume occupied by the overdensities and assuming a bias parameter of , we estimate that the protoclusters have masses in the range M☉. These protoclusters are likely to be progenitors of present-day (massive) clusters of galaxies. For the first time, we have been able to estimate the velocity dispersion of cluster progenitors from to . The velocity dispersion of the emitters increases with cosmic time, in agreement with the dark matter velocity dispersion in numerical simulations of forming massive clusters.
— cosmology: large scale structure of Universe
Key Words.:
galaxies: active — galaxies: clusters: general — cosmology: observations — cosmology: early Universe1 Introduction
Clusters of galaxies are the largest and most massive gravitationally bound structures in the Universe. They are interesting objects to study for many reasons.
First, clusters contain large numbers of galaxies at specific redshifts, making them excellent laboratories with which to investigate the formation and evolution of galaxies. For example, the analysis of galaxies in clusters showed that the stars in massive, early-type galaxies formed at (e.g., Ellis et al., 1997; Stanford et al., 1998; Blakeslee et al., 2003; van Dokkum & Stanford, 2003; Holden et al., 2005). Investigating the galaxy population of (forming) clusters at could provide knowledge of the formation process of such massive galaxies (e.g., Eggen et al., 1962; Larson, 1974). Also because clusters are the most extreme overdense regions in the Universe, they allow an efficient investigation of the interaction between galaxies and their environment (e.g., Miles et al., 2004; Tanaka et al., 2004; van Zee et al., 2004; Goto, 2005; Nakata et al., 2005; Tran et al., 2005).
A second reason to study clusters is that they can place constraints on cosmology. The number density of massive clusters is a strong function of the fundamental cosmological parameters and , and the evolution of cluster abundances with redshift depends primarily on (e.g., Eke et al., 1996). The number density of rich clusters at has already been successfully used to constrain the values of cosmological parameters (e.g., Bahcall et al., 1997; Bahcall & Fan, 1998; Ettori et al., 2003).
Several studies of massive clusters with redshifts up to have found little evolution in the cluster properties (e.g., Tozzi et al., 2003; Hashimoto et al., 2004; Maughan et al., 2004; Rosati et al., 2004; Mullis et al., 2005). Despite the large lookback times, clusters at appear to be very similar to local clusters. For example, the cluster RDCS 1252.9-2927 has thermodynamical properties and metallicity that are very similar to those of lower redshift clusters (Rosati et al., 2004). To study when and how clusters and their galaxies formed, a sample of clusters at is needed.
Unfortunately, conventional methods for finding distant clusters become impractical at . Searches for extended X-ray sources are difficult because the surface brightness of the X-ray emission fades as . Although large optical surveys have been successful in finding galaxy clusters at by searching for concentrations of red galaxies (e.g., Gladders, 2002), the detection of clusters with the same method requires sensitive, wide field near-infrared cameras which are not yet available. In the future, surveys exploiting the Sunyaev-Zeldovich (SZ) effect (e.g., Carlstrom et al., 2002) will be able to detect clusters of galaxies at . However, at this moment the sensitivity of SZ surveys is not sufficient to detect any of the known clusters at (Carlstrom et al., 2002; Rosati et al., 2004). In recent years, several distant forming clusters (protoclusters) have been serendipitously discovered in field surveys (e.g., Steidel et al., 1998, 2005; Shimasaku et al., 2003; Ouchi et al., 2005). For example, Steidel et al. (1998) found a large scale structure of Lyman Break galaxies (LBGs) at in one of their fields. This single discovery demonstrated the power of such structures as it could be derived that LBGs must be very biased tracers of mass.
A different approach to find (forming) clusters is to search for a galaxy concentration near a presumed tracer of high density regions. There is considerable evidence that powerful high redshift radio galaxies might be such tracers, as they are forming massive galaxies in dense environments (e.g., Carilli et al., 1997; Dey et al., 1997; Athreya et al., 1998; Pentericci et al., 1998; Papadopoulos et al., 2000; Pentericci et al., 2000b; Archibald et al., 2001; Jarvis et al., 2001; De Breuck et al., 2002, 2003a, 2003b; Stevens et al., 2003; Zirm et al., 2003; Reuland et al., 2004, see e.g. Carilli et al. 2001 for a review). Targeted searches for companion galaxies near powerful radio sources at have long yielded promising results (e.g., Le Fèvre et al., 1996; Pascarelle et al., 1996; Keel et al., 1999; Sánchez & González-Serrano, 1999, 2002; Best, 2000; Hall et al., 2001; Nakata et al., 2001; Best et al., 2003; Wold et al., 2003; Barr et al., 2004).
We therefore started a large program with the Very Large Telescope (VLT) to systematically search for galaxy overdensities near radio galaxies in the redshift range . This program was initiated after a successful pilot project in which the environment of the radio galaxy MRC 1138–262 at was investigated. Deep narrow-band images of the radio galaxy and the surrounding field were obtained to search for an excess of Ly emitting galaxies (Kurk et al., 2000). The imaging and follow-up spectroscopy resulted in candidate Ly emitters (Kurk et al., 2000, 2004b) of which 15 were confirmed at (Pentericci et al., 2000a; Croft et al., 2005). The presence of a forming cluster associated with MRC 1138–262 was firmly established by the subsequent discovery of significant populations of (spectroscopically-confirmed) H emitters (Kurk et al., 2004a, b), QSOs (Pentericci et al., 2002; Croft et al., 2005) and extremely red objects (Kurk et al., 2004b). The VLT large program was augmented by observations with the Keck telescope, to take advantage of the excellent UV throughput of LRIS-B for spectroscopy and imaging below the Lyman break of some of the objects.
In this paper, we present the results of our program to search for forming clusters (protoclusters) near radio galaxies up to . Early results of the program, the discovery of galaxy overdensities at and , have been presented in Venemans et al. (2002) and in Venemans et al. (2004). A detailed analysis of the field towards the radio galaxy MRC 0316–257 at is given in Venemans et al. (2005, hereafter V05). In V05 the data reduction steps, selection procedure of candidate Ly emitters and the assessment of the data quality are described in detail. Here we will follow the same steps as V05 for the data reduction and analysis of the other fields. While in this paper we will focus on the environment of radio galaxies, in the second paper of this series we will describe the properties of the individual Ly emitting galaxies discovered in our program.
The structure of this paper is as follows: in Sect. 2.1 we present the targets of our program, and in Sect. 2.2–2.4 we give the details of the imaging observations, the selection of candidate Ly emitters and follow-up spectroscopy. In Sect. 3, the results of the imaging and spectroscopy are described for each individual field. A summary of the results and the evidence for the presence of protoclusters near the radio galaxies are given in Sect. 4. The properties of the protoclusters are presented in Sect. 5, followed by a discussion of our results in Sect. 6 and a summary in Sect. 7.
In this article, we adopt a -dominated cosmology with H km s-1 Mpc-1, , and . Magnitudes are given in the AB system (Oke, 1974).
2 Observations
2.1 Sample selection
| Name | ||||
|---|---|---|---|---|
| BRL 1602–174 | 16 05 01.7 | 17 34 18.4 | 2.04 | |
| MRC 2048–272 | 20 51 03.5 | 27 03 04.1 | 2.06 | |
| MRC 1138–262 | 11 40 48.2 | 26 29 09.5 | 2.16 | |
| MRC 0052–241 | 00 54 29.8 | 23 51 31.1 | 2.86 | |
| MRC 0943–242 | 09 45 32.7 | 24 28 49.7 | 2.92 | |
| MRC 0316–257 | 03 18 12.0 | 25 35 10.8 | 3.13 | |
| TN J2009–3040 | 20 09 48.1 | 30 40 07.4 | 3.16 | |
| TN J1338–1942 | 13 38 26.1 | 19 42 30.8 | 4.11 | |
| TN J0924–2201 | 09 24 19.9 | 22 01 42.0 | 5.20 |
a Radio luminosity at a rest-frame frequency of 2.7 GHz in
erg s-1 Hz-1 sr-1
The targets for our program were selected from a list of approximately 150 radio galaxies with known redshifts of . Our targets were chosen to have large radio luminosities ( erg s-1 Hz-1 sr-1). Because our goal was to search for companion Ly emitting galaxies near the radio sources, the radio galaxies had to have redshifts optimum for imaging with the narrow-band filters that were available at the VLT. Also, the radio sources need to lie in the southern hemisphere () to allow deep imaging of the source with the VLT. Applying these criteria to the list of radio sources reduced the number of possible targets for our program to 16 of which nine are at (this includes the target of our pilot project, MRC 1138–262 at ), three are at and four are at . Given the relatively small number of radio sources at that could be observed with the VLT, we did not apply other criteria. To extend the redshift range, we purchased narrow-band filters that were centred on the wavelength of the Ly line at a redshift of and . The following nine radio sources were chosen as targets for our program: BRL 1602–174 (hereafter 1602), MRC 2048–272 (2048) and MRC 1138–262 (1138, all three at ), MRC 0052–241 (0052) and MRC 0943–242 (0943, both at ), MRC 0316–257 (0316) and TN J2009–3040 (2009, both at ), TN J1338–1942 (1338, ) and TN J0924–2201 (0924, ). Because these targets were selected only on the basis of their radio luminosity and position on the sky, we regard our sample as representative of luminous radio sources. The position, redshift and radio power of the targets are given in Table 1. Individual radio galaxies are briefly described in Sect. 3.
2.2 Imaging observations
| Date | Telescope | Instrument | Field | Filter | (Å) | (Å) | Seeing | Depthd | |
|---|---|---|---|---|---|---|---|---|---|
| 2001 Mar 24 & 25 | VLT UT2 | FORS2 | 1338-1e | FILT_621_5 | 6199 | 59 | 06 | 33 300 | 28.2 |
| 2001 Mar 24 & 25 | VLT UT2 | FORS2 | 1338-1e | Special | 6550 | 1650 | 06 | 6 300 | 28.9 |
| 2001 Mar 24–26 | VLT UT2 | FORS2 | 0943 | HeII/6500 | 4781 | 68 | 07 | 22 500 | 28.6 |
| 2001 Mar 25 & 26 | VLT UT2 | FORS2 | 0943 | Bessel | 4290 | 880 | 09 | 4 500 | 28.7 |
| 2001 Mar 25 & 26 | VLT UT2 | FORS2 | 1602 | OII | 3717 | 73 | 08 | 15 000 | 26.6 |
| 2001 Mar 26 | VLT UT2 | FORS2 | 1602 | Bessel | 4290 | 880 | 065 | 2 700 | 27.6 |
| 2001 May 21–23 | VLT UT2 | FORS2 | 2048 | OII | 3717 | 73 | 095 | 25 200 | –f |
| 2001 May 22 & 23 | VLT UT2 | FORS2 | 2048 | Bessel | 4290 | 880 | 105 | 3 600 | –f |
| 2001 Sep 20–22 | VLT UT4 | FORS2 | 2048 | OII | 3717 | 73 | 095 | 25 200 | 27.9 |
| 2001 Sep 20 & 21 | VLT UT4 | FORS2 | 2048 | Bessel | 4290 | 880 | 105 | 3 000 | 28.8 |
| 2001 Sep 20 & 21 | VLT UT4 | FORS2 | 0316 | OIII/3000 | 5045 | 59 | 07 | 23 400 | 28.4 |
| 2001 Sep 20 & 21 | VLT UT4 | FORS2 | 0316 | Bessel | 5540 | 1115 | 07 | 4 860 | 28.9 |
| 2001 Sep 22 | VLT UT4 | FORS2 | 0052 | HeII | 4684 | 66 | 075 | 5 400 | –f |
| 2001 Oct 20 | VLT UT4 | FORS2 | 0052 | HeII | 4684 | 66 | 075 | 18 000 | 28.3 |
| 2001 Oct 20 | VLT UT4 | FORS2 | 0052 | Bessel | 4290 | 880 | 08 | 4 800 | 29.0 |
| 2002 Mar 8 | VLT UT4 | FORS2 | 0924 | FILT_753_8 | 7528 | 89 | 08 | 14 400 | –f |
| 2002 Mar 8 | VLT UT4 | FORS2 | 0924 | Bessel | 7680 | 1380 | 08 | 2 700 | –f |
| 2002 Apr 17–19 | VLT UT4 | FORS2 | 0924 | FILT_753_8 | 7528 | 89 | 08 | 28 800 | 28.1 |
| 2002 Apr 17–19 | VLT UT4 | FORS2 | 0924 | Bessel | 7680 | 1380 | 08 | 8 640 | 28.5 |
| 2002 Apr 17–19 | VLT UT4 | FORS2 | 1338-2e | FILT_621_5 | 6199 | 59 | 075 | 25 200 | 28.2 |
| 2002 Apr 17–19 | VLT UT4 | FORS2 | 1338-2e | Special | 6550 | 1650 | 075 | 4 500 | 28.9 |
| 2002 Apr 17–19 | VLT UT4 | FORS2 | 2009 | OIII/3000 | 5045 | 59 | 09 | 21 600 | –f |
| 2002 Apr 17–19 | VLT UT4 | FORS2 | 2009 | Bessel | 5540 | 1115 | 085 | 4 800 | –f |
| 2002 Apr 19 | VLT UT4 | FORS2 | 0924 | Bessel | 5540 | 1115 | 105 | 3 600 | 28.6 |
| 2002 Sep 6–8 | VLT UT4 | FORS2 | 0316 | Bessel | 7680 | 1380 | 07 | 4 680 | 28.7 |
| 2002 Sep 8 | VLT UT4 | FORS2 | 2009 | OIII/3000 | 5045 | 59 | 09 | 7 200 | 28.0 |
| 2002 Sep 8 | VLT UT4 | FORS2 | 2009 | Bessel | 5540 | 1115 | 085 | 2 400 | 28.6 |
| 2002 Sep 8 | VLT UT4 | FORS2 | 0052 | Bessel | 5540 | 1115 | 075 | 5 400 | 29.2 |
| 2002 Sep 8 | VLT UT4 | FORS2 | 0052 | Bessel | 7680 | 1380 | 055 | 4 800 | 28.5 |
| 2003 Jan 31 | Keck I | LRIS-B | 0316 | 3550 | 600 | 125 | 4 050 | –f | |
| 2003 Feb 1 & 4 | Keck I | LRIS-B | 0316 | 3550 | 600 | 125 | 9 000 | 29.8 | |
| 2003 Feb 4 | Keck I | LRIS-B | 0943 | 3550 | 600 | 12 | 9 600 | –f | |
| 2003 Feb 4 | Keck I | LRIS-R | 0943 | 5473 | 948 | 125 | 5 600 | 29.4 | |
| 2004 Jan 19 | Keck I | LRIS-B | 0943 | 3550 | 600 | 12 | 7 000 | 29.8 | |
| 2004 Jan 19 | Keck I | LRIS-R | 0943 | 8331 | 3131 | 090 | 6 000 | 28.4 |
a Central wavelength of the filter in Å.
b Full width at half maximum (FWHM) of the filter in Å.
c Total exposure time in seconds.
d 1 depth of the resulting image in mag per
″.
e The field towards TN J1338–1942 was observed at two different
pointings, see Sect. 3.8.
f For images obtained during two different observing sessions,
only the total depth is listed in the final entry.
To search for structures of Ly emitting galaxies near the radio galaxies, the fields surrounding the radio galaxies were observed in a narrow-band filter and at least one broad-band filter. The narrow-band filters were chosen to encompass the Ly line at the redshift of the radio galaxy, and the broad-band filters were selected to measure the UV continuum redward of the Ly line.
All the narrow-band imaging and most of the broad-band imaging obtained in the large program were performed with the FOcal Reducer/ low dispersion Spectrograph 2 (FORS2; Appenzeller & Rupprecht, 1992) in imaging mode. Before 2002 April, the detector in FORS2 was a SiTE CCD with 20482048 pixel2 and a pixel scale of 02 pixel-1. In 2002 April, the SiTE CCD was replaced by two MIT CCDs each with 20482048 pixel2 with a scale of 0125 pixel-1. The pixels were binned by , which decreases the readout time by a factor of 2 and gives a pixels scale of 025 pixel-1. The field of view, which is restricted by the geometry of the Multi-Object Spectroscopy unit, is 6868.
Additional (broad-band) imaging was obtained using the Low Resolution Imaging Spectrometer (LRIS, Oke et al., 1995) on the Keck I telescope. LRIS has two arms: a blue channel which is optimised for observations in the blue part of the optical spectrum (LRIS-B, see McCarthy et al., 1998; Steidel et al., 2004, for more information) and a red channel for observing in the red (LRIS-R, Oke et al. 1995). The red arm is equipped with a Tektronix CCD with 20482048 pixel2. The pixel scale is 021 pixel-1, resulting in a field of view of 7373. The blue channel has two 20484096 Marconi CCDs with a pixel scale of 0135 pixel-1. There is a small gap between the CCDs of roughly 135. The field of view is 8′8′111The specifications for the blue channel detectors given here apply for data taken after 2002 June..
Observations were split into separate exposures of typically 1200–1800 s in the narrow-band and 240–800 s in the broad-band. Individual exposures were shifted 10″–15″ with respect to each other to facilitate the identification of cosmic rays and the removal of residual flat-field errors. The data were reduced using standard routines within the reduction software package IRAF222IRAF is distributed by the National Optical Astronomy Observatories, which are operated by the Association of Universities for Research in Astronomy, Inc., under cooperative agreement with the National Science Foundation.. These routines included bias subtraction using either bias frames or the overscan region of the CCD, flat fielding with twilight sky flats and illumination correction using the unregistered science frames.
All science images were registered on the ICRF astrometric frame of reference (Ma & Feissel, 1998), using the USNO-A2.0 catalogue (Monet et al., 1998; Monet, 1998). The relative positions of objects in the fields are accurate to 01–02. The absolute accuracy is dominated by the uncertainty in the USNO-A2.0 catalogue of 025 (Deutsch, 1999).
The photometric calibration was performed using several photometric and spectrophotometric standard stars from the catalogues of Stone & Baldwin (1983), Baldwin & Stone (1984), Oke (1990) and Landolt (1992). The magnitude zero-points derived from these standard stars are consistent with each other within 2–3%. Zero-points in the Vega system are converted to the AB system using the transformations of Bessell (1979) and Smith et al. (2002). The zero-points were corrected for galactic extinction as estimated by Schlegel et al. (1998).
2.3 Candidate selection
| Field | Nd | Areae | |||
|---|---|---|---|---|---|
| erg s-1 cm-2 | erg s-1 | arcmin2 | |||
| 1602 | 24.4 | 2 | 42.3 | ||
| 2048 | 25.4 | 10 | 43.6 | ||
| 1138 | 25.2f | f | f | 37f | 46.6f |
| 0052 | 26.1 | 57 | 44.9 | ||
| 0943 | 26.1 | 65 | 46.5 | ||
| 0316 | 26.3 | 77 | 45.8 | ||
| 2009 | 25.7 | 21 | 46.7 | ||
| 1338-1 | 26.0 | 31g | 40.1 | ||
| 1338-2 | 26.2 | 33g | 48.9 | ||
| 0924 | 25.5 | 14 | 46.8 |
a Magnitude at which 50% of artificial and real point sources that were
added to the narrow-band image, were recovered.
b Line flux of an emitter with no continuum
that is detected at the 5 level in an aperture with a diameter
twice that of the seeing disc.
c Line luminosity of an emitter with no continuum that
is detected at the 5 level in an aperture with a diameter
twice that of the seeing disc.
d Number of candidate Ly emitters that fulfils the selection
criteria EW Å and EW0/EW.
e Imaging area useful for selection of Ly emitters.
f Values taken from Kurk et al. (2004b).
g The 1338-1 and 1338-2 fields overlap and have an area of 9.3
arcmin2 in common. The total number of unique candidate emitters
in the two fields is 54 in an area of 79.7 arcmin2.
Objects in the images were detected using the program SExtractor (Bertin & Arnouts, 1996). The narrow-band images were taken to detect objects, and aperture photometry was subsequently performed on both the narrow-band and the broad-band images.
To assess the completeness of the source detection, artificial and real point sources were added to the narrow-band image and recovered. The completeness limit was defined as the narrow-band magnitude at which 50% of the added sources was recovered (see V05 for details).
Detected objects were required to have a signal-to-noise of in the narrow-band image. The colors of the detected objects were measured in circular apertures, while the “total” flux was measured in an elliptical aperture. A correction was made to the “total” flux to account for the flux outside the elliptical aperture. More details on the object detection, completeness assessment, aperture sizes for the photometry and “total” flux correction can be found in V05.
Following Venemans et al. (2002) and V05, we selected objects with a rest-frame equivalent width EW Å and a significance EW0/EW0 as good candidate Ly emitters. In V05 a detailed description is presented on how EW0 and EW0 are computed from the available photometry. For two fields that are imaged in at least two broad-band filters, the 0316 and 0052 fields, the UV continuum slope () of candidate emitters was also computed. For the other fields, a “flat” continuum slope was used to select the candidates, which is close to the median of confirmed Ly emitters in the 0316 field (, V05). In each field the candidate emission line galaxies were visually inspected and spurious sources (like spikes of bright, saturated stars) were removed from the catalogues. The resulting lists should have a very low fraction of contaminants, such as low redshift interlopers (% as esimated by V05).
2.4 Spectroscopic observations
| Date | Telescope | Instrument | Field | Modea | Grism name | Dispersionb | Resolutionc | t |
|---|---|---|---|---|---|---|---|---|
| 2001 May 20 & 22 | VLT UT2 | FORS2 | 1338-1 | MXU, mask A | GRIS_600RI | 1.32 | 260 10 | 31 500 |
| 2001 May 21 & 22 | VLT UT2 | FORS2 | 1338-1 | MXU, mask B | GRIS_600RI | 1.32 | 265 10 | 35 100 |
| 2001 Sep 22 | VLT UT4 | FORS2 | 0316 | MOS | GRIS_1400V | 0.50 | 130 15 | 12 600 |
| 2001 Oct 18 & 19 | VLT UT4 | FORS2 | 2048 | MXU | GRIS_600B | 2.40 | 410 10 | 16 200 |
| 2001 Oct 18 | VLT UT4 | FORS2 | 0316 | MXU, mask A | GRIS_1400V | 1.00 | 140 10 | 10 800 |
| 2001 Oct 18–20 | VLT UT4 | FORS2 | 0316 | MXU, mask B | GRIS_1400V | 1.00 | 140 10 | 29 100 |
| 2001 Nov 15 & 16 | VLT UT3 | FORS1 | 0316 | PMOS | GRIS_300V | 2.64 | 630 08 | 19 800 |
| 2002 Jan 14 | Keck I | LRIS | 0943 | MSS, mask A | 600/4000 | 1.01 | 310 085 | 10 800 |
| 2002 Jan 15 | Keck I | LRIS | 0943 | MSS, mask B | 600/4000 | 1.01 | 325 09 | 9 000 |
| 2002 Sep 6 & 7 | VLT UT4 | FORS2 | 2009 | MXU | GRIS_1400V | 0.62 | 110 075 | 19 800 |
| 2002 Sep 6 | VLT UT4 | FORS2 | 0052 | MXU, mask A | GRIS_1400V | 0.62 | 100 065 | 8 400 |
| 2002 Sep 6 & 7 | VLT UT4 | FORS2 | 0052 | MXU, mask B | GRIS_1400V | 0.62 | 100 065 | 17 550 |
| 2002 Sep 7 | VLT UT4 | FORS2 | 0052 | MXU, mask C | GRIS_1400V | 0.62 | 95 06 | 10 800 |
| 2002 Sep 8 | VLT UT4 | FORS2 | 0052 | MOS | GRIS_1400V | 0.62 | 95 06 | 9 600 |
| 2003 Jan 31 | Keck I | LRIS | 0943 | MSS, mask C | 600/4000 | 0.61 | 205 07 | 7 200 |
| 2003 Feb 1 | Keck I | LRIS | 0943 | MSS, mask D | 600/4000 | 0.61 | 215 075 | 7 200 |
| 2003 Feb 1 & 4 | Keck I | LRIS | 1338-2 | MSS | 400/8500 | 1.85 | 320 075 | 9 000 |
| 2003 Mar 3 & 4 | VLT UT4 | FORS2 | 0924 | MXU | GRIS_600RI | 1.66 | 225 085 | 20 676 |
| 2003 Mar 4 | VLT UT4 | FORS2 | 1338-2 | MXU | GRIS_1200R | 0.76 | 125 085 | 18 600 |
a Explanation of the different observing modes:
MOS: Multi-object spectroscopy mode of FORS2, performed with 19
movable slitlets with lengths of 20″–22″.
MXU: Multi-object spectroscopy mode of FORS2 with a user-prepared mask.
PMOS: Spectropolarimetry mode of FORS1 using 9 movable slitlets of
20″.
MSS: Multi-slit spectroscopy mode of LRIS, which uses a custom laser-cut
mask.
b Dispersion in Å pixel-1.
c The resolution is given for both the dispersion and spatial
axis. The units are [km s-1] [″].
d Total exposure time in seconds.
To confirm whether the candidate emission line objects are located at the redshift of the radio galaxy, spectra were taken of candidate emitters. Priority was given to the most luminous candidates. In Table 4 a summary is given of the spectroscopic observations of candidate emitters in the radio galaxy fields.
Most of the spectroscopic observations were performed using user-defined masks (the multi-object spectroscopy (MXU) mode of FORS2 and multi-slit spectroscopy (MSS) modes of LRIS in Table 4). This mode allowed us to observe between 20 and 40 objects per slitmask. The slits typically had a length of 10″–12″ and a width of 10–14. The grisms used were selected to have the highest throughput at the wavelength of the Ly line of the radio galaxy and a resolution that matches the width of the Ly lines ( km s-1, V05) to maximize the confirmation rate.
Individual exposures were typically 1800–2700 s, which ensured that the spectra were limited by the sky noise. Between the exposures the pointing of the telescope was shifted 2″–5″ along the slits to enable more accurate sky subtraction. For the flux calibration long slit exposures of (at least) one of the following spectroscopic standard stars EG 274, Feige 67, Feige 110, GD 108, LTT 377, LTT 1020, LTT 1788, LTT 6248 and LTT 7987 (Stone & Baldwin, 1983; Baldwin & Stone, 1984; Oke, 1990) were used. The flux calibration is accurate to about %. This does not take into account the uncertainties due to slit losses. Because we calculated the total flux of the emission lines using the imaging photometry, we did not attempt to correct the spectra for flux falling outside the slit.
The details of the reduction of the spectroscopic data is given in V05. In the next section, we will describe the results in the individual fields.
3 Results
In this section we describe the results of the imaging, candidate selections and follow-up spectroscopy of the Ly emitters in each of the nine radio galaxy fields, followed by a description of the diffuse Ly halos of the radio galaxies. For the details of the results in the 1138, 0316 and 0924 fields we refer to Kurk et al. (2000), Pentericci et al. (2000), Venemans et al. (2004), Kurk et al. (2004b), V05 and Croft et al. (2005). Below a brief summary of the results in these fields is given.
Redshift and Ly line properties were measured by fitting a Gaussian function to the emission line. If absorption features were present, a combination of a Gaussian and a Voigt absorption profile was fitted. The properties of the confirmed Ly emitters in the various fields are summarized in Tables 7–11. In the Tables, the objects are ordered on increasing right ascension.
3.1 BRL 1602–174,
The radio source BRL 1602–174 was optically identified with a galaxy with m object along the radio axis. A spectrum of this galaxy yielded a redshift of based on four emission lines (Best et al., 1999). This places the Ly line of the radio galaxy in the lowest wavelength narrow-band filter available for FORS2, the O ii filter. The field was imaged for 250 minutes in the narrow-band and for 45 minutes in the -band. Due to the high extinction towards this field (, Schlegel et al., 1998) and the low quantum efficiency at wavelengths Å of the FORS2 detector, only two candidate Ly emitters were found. No spectra were taken in this field.
3.2 MRC 2048–272,
MRC 2048–272 was listed in the 408 MHz Molonglo Reference Catalogue
(Large et al., 1981) and identified with a object by
McCarthy et al. (1996). High resolution imaging in the infrared with the HST revealed three separate components within 3″ (Pentericci et al., 2001), of which the central object was identified as the radio
galaxy. The surface brightness of the central object could be well fit by a
de Vaucouleurs profile, indicating that a dynamically relaxed stellar
population is in place in this radio galaxy (Pentericci et al., 2001).
Imaging observations
We observed the field in 2001 May under moderate seeing conditions
(1″) for 7 hours in the O ii narrow-band filter
and for 1 hour in the -band. Because of the low efficiency of the
detector at Å and the high extinction towards the
field of (Schlegel et al., 1998), the field was imaged again in 2001
September. The combined 14 hours of narrow-band observations of this
field have a depth comparable to that of the field surrounding MRC
1138–262 (Kurk et al., 2000, Table 3). In total 10 candidate
Ly emitters were found in this field. The number of contaminants is
expected to be low in this field, because the only strong line that
falls in the filter is [O ii] at a redshift of
.
Spectroscopic observations
Due to geometrical constraints only three of the candidate emitters
could be observed at the same time. Additional targets were included
on the slitmask, including objects with a low equivalent width EW Å. Two of the three candidates and the radio galaxy
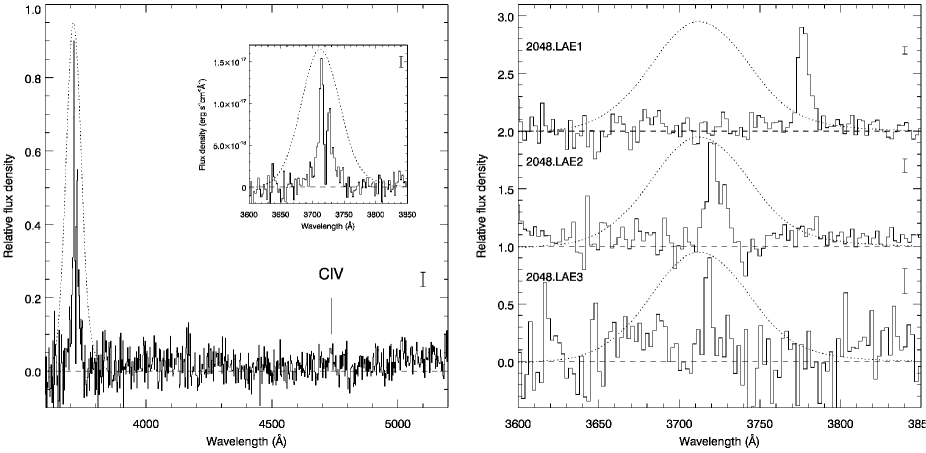
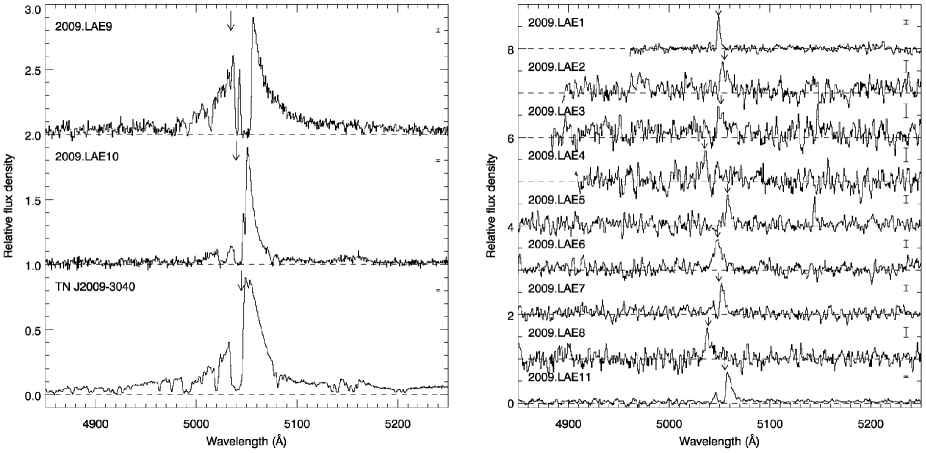
show a line in a 4 hr spectrum (see Table 7 and Fig. 1). The third emitter has most likely an emission line
that is too faint ( erg s-1 cm-2) to be confirmed in a 4
hr spectroscopic observation with FORS2 at blue wavelengths
( Å). The two confirmed emitters have a redshift
very close to that of the radio galaxy with relative velocities of 100
and 10 km s-1. A third Ly emitter was found among the candidate
emitters with a lower equivalent width. This galaxy is a bright Ly emitter located km s-1 away from the radio galaxy, with the
emission line at the edge of the narrow-band filter (Fig. 1).
Volume density
Kurk et al. (2004b) found that the 1138 field is overdense in Ly emitters by a factor of compared to the field (volume) density of Ly emitters as derived by Stiavelli et al. (2001). Comparing the volume density of Ly emitters near MRC 2048–272 to that of emitters near MRC 1138–262 (Kurk et al., 2004b), the density in the 2048 field is a factor 3.4 smaller. The errors are based on Poisson statistics in the small numbers regime (Gehrels, 1986). Using this factor, the volume density of emitters near 2048 is times the field density of emitters. A direct comparison with Stiavelli et al. (2001) gives a similar density (). The small difference between the two density estimates (at the level) is due the small numbers of galaxies involved in the comparison. The density in the 2048 field is consistent with no overdensity of emitters near the radio galaxy.
3.3 MRC 1138–262,
This radio galaxy was the target of our pilot project (see also Sect. 1). Narrow- and broad-band imaging with FORS1 on the VLT resulted in the detection of 37 candidate Ly emitters (Kurk et al., 2000, 2004b). Subsequent spectroscopy confirmed 15 Ly emitters to be near the radio galaxy at (Pentericci et al., 2000a). The density of Ly emitters in this field is roughly a factor 4 higher as compared to field studies (Pentericci et al., 2000a; Kurk et al., 2004b). This field is also overdense in X-ray sources (Pentericci et al., 2002) and extremely red objects (EROs, Kurk et al., 2004b). In total, four of the X-ray sources are confirmed to be members of the protocluster (Pentericci et al., 2002; Croft et al., 2005). Also, nine H emitters were spectroscopically confirmed to be associated with the radio galaxy (Kurk et al., 2004a, b), increasing the number of confirmed protocluster members to 25.
3.4 MRC 0052–241,
The optical counterpart of the radio source 0052–241 from the
Molonglo Reference Catalogue (Large et al., 1981) was found by McCarthy et al. (1996)
to be a object. A spectrum of this object showed strong
Ly emission at a redshift of (McCarthy et al., 1996).
Imaging and spectroscopic observations
At the Ly line is shifted into the FORS2 narrow-band He ii filter. The field was imaged for 390 min in this narrow-band and for 80, 90 and 80 min in the -band, -band and -band respectively (Table 2). Analysis of these data resulted in a list of 57 candidate Ly emitters with EW Å and EW0/EW (Sect. 2.3).
Follow-up spectroscopy of candidate emitters was carried out in 2002
September at the VLT. 36 candidates were observed in four masks with
individual exposure times between 140 and 292.5 min under
good seeing conditions (06–065, see Table
4). The resolution of the grism that we used (the 1400V
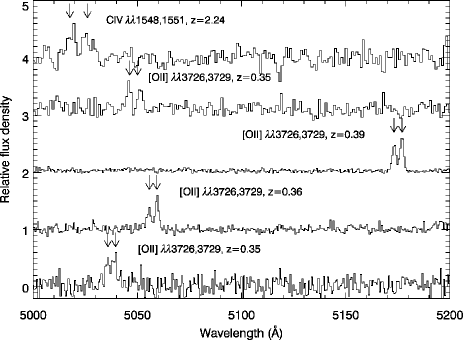
grism) is , which is high enough to resolve the [O ii]
and C iv
doublets (see Fig. 2 for a few examples). Objects with
these emission lines in their spectrum are the main contaminants in
searches for Ly emitters (e.g., Fynbo et al., 2003). The high
resolution of the 1400V grism allows us to discriminate high redshift
Ly emitters from low redshift interlopers.
Results
Of the 36 objects observed 35 were confirmed to be Ly emitters at a
redshift . The 36th candidate was most likely too faint
to be detected. This candidate had the smallest line flux of the
objects in the mask. In addition to the 36 good candidates, four
objects from a list with 20 candidate line emitters with Å
EW Å were observed. Two of them were confirmed to be
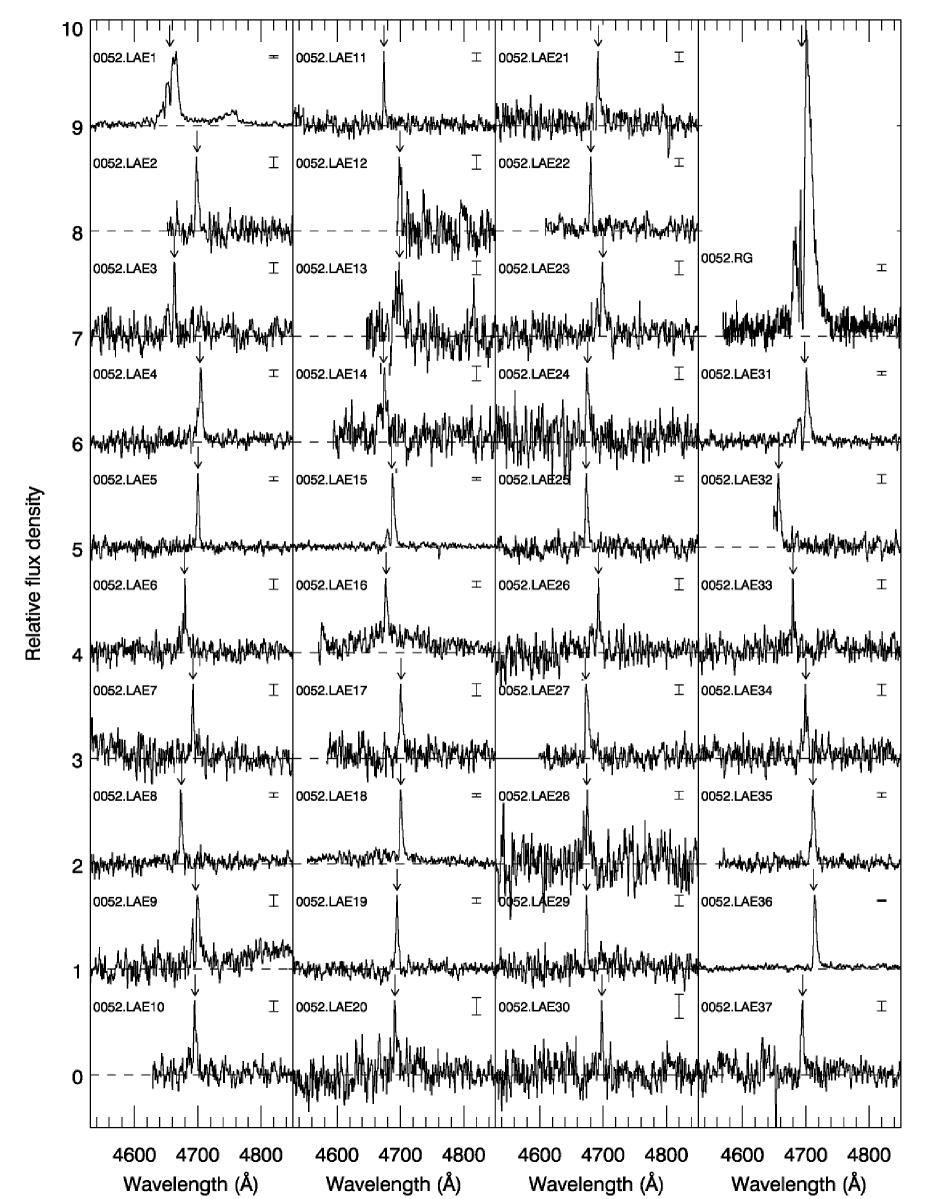
Ly emitters at . One of these, emitter 0052.LAE36, has a
Ly line that falls at the red edge of the filter. Using the
measured redshift ( instead of ) the calculated
equivalent width is EW Å. The spectra of the 37
confirmed Ly emitters and that of the radio galaxy are shown in
Fig. 3.
Volume density
The density of Ly emitters can be compared directly to the field density of emitters. Fynbo et al. (2003) used the same narrow-band filter at the VLT to observe a field which contains a damped Ly absorber. The depth they reach in their images is approximately 0.7 mag deeper compared to our narrow-band image, making their observations suitable for comparison. Fynbo et al. (2003) find 14 emitters (of which 13 are spectroscopically confirmed) with a Ly flux erg s-1 cm-2 and a rest-frame equivalent width Å. To the same limit and in the same field of view, we find 48 (candidate) emitters. This implies that the overdensity in the 0052 field is .
Due to cosmic variance, the uncertainty in the number density of Ly emitters in a small field of view like that of the VLT images is generally higher than the uncertainty derived assuming Poisson statistics (e.g., Somerville et al., 2004). To overcome this, a comparison can be made with the density of Ly emitters at in a 0.13 deg2 field as found by Ciardullo et al. (2002). This comparison gives a volume density of Ly emitters in the 0052 field of times the field density. The large (Poisson) errors are due to the small number statistics. More recently, Hayashino et al. (2004) measured the blank field space density of Ly emitters at using the Suprime-Cam on the Subaru telescope. In a 0.17 deg2 field, they find 55 candidate Ly emitters with an observed equivalent width Å down to a narrow-band magnitude of 25.3. Applying the same equivalent width and magnitude criteria to our field and taking into account the difference in luminosity distance gives 11 sources. The resulting density of emitters near MRC 0052–241 is a factor higher than the field density. The weighted average of the three estimates of the overdensity is .
It is interesting to compare the density of Ly emitters in the 0052
field with the density of emitters near the radio galaxy MRC 0316–257
at (V05). The depth and sensitivity of the imaging of the
two fields are very similar (see Tables 2 and
3). There are 52 candidate emitters in the 0052 field with
a narrow-band magnitude brighter than 26.1, against 59 in the 0316
field. Taking into account the difference in the volume probed by the
narrow-band images, the ratio of the number density is
. Because the 0316 field is
overdense in Ly emitters by a factor (V05),
this means that the 0052 field has an overdensity of Ly emitting
galaxies of , which is consistent within the errors
with the other estimates.
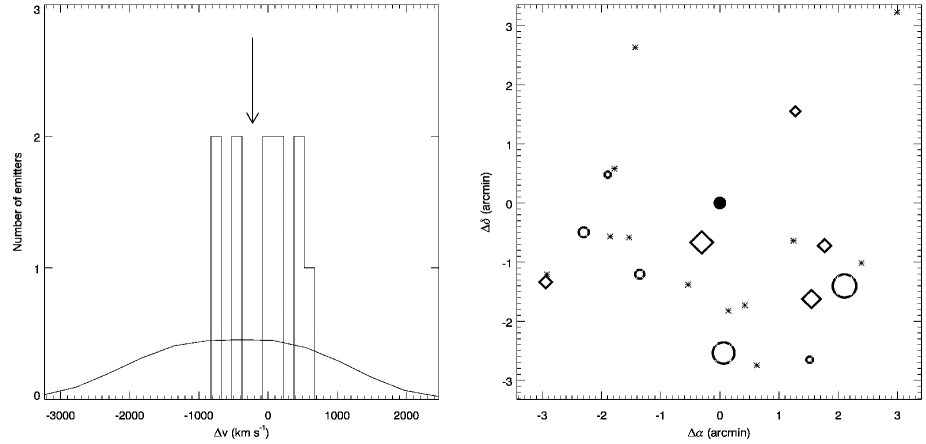
Velocity and spatial distributions
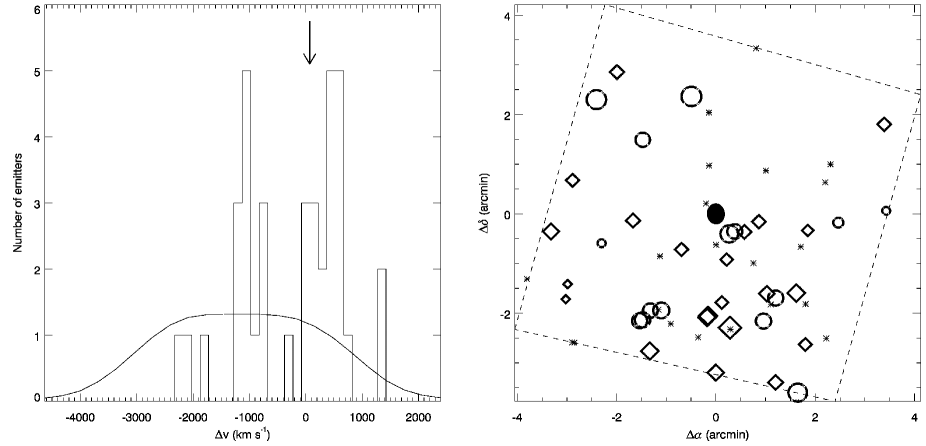
The velocity histogram and the spatial distribution of the candidate and confirmed emitters are shown in Fig. 4. The redshifts of the confirmed emitters are not uniformly distributed throughout the narrow-band filter (solid curve in Fig. 4). Instead, the majority of the emitters (31 out of the 37) appear to be clustered in two groups with velocity dispersions of 180 and 230 km s-1. Interestingly, a similar redshift distribution was found near the radio galaxy MRC 1138–262 (Pentericci et al., 2000a). The velocity of the radio galaxy lies 70 km s-1 from the median redshift of the emitters and falls inside the larger of the two groups. The combination of the observed overdensity of Ly emitters with the clumpy redshift distribution provides evidence that the Ly emitters near MRC 0052–241 are part of a forming cluster of galaxies at . The properties of this structure will be discussed in Sect. 5.
In contrast to the velocity distribution, the emitters do not have a preferred location on the sky. The structure of emitters appears not to be bounded by the image, indicating that the overdensity seen in this field extends beyond the edges of our field of view.
3.5 MRC 0943–242,
This powerful radio source with a flux density of 1.1 Jy at
408 MHz has a redshift of (Röttgering et al., 1995, 1997). The radio
galaxy is surrounded by a metal-enriched, low surface brightness gas
halo extending for at least 8″ (67 kpc, Villar-Martín et al., 2003). The
estimated dynamical mass of the gas halo is
M☉ (Villar-Martín et al., 2003; Jarvis et al., 2003). This could be an indication that we are
witnessing the formation of a massive galaxy.
Imaging and spectroscopic observations
The field surrounding the radio galaxy was observed with the VLT in 2001 March. Images were taken in the narrow-band for 375 min and 75 min in the -band (Table 2). A part of the field (1.1 arcmin2) was not usable to search for Ly emitters due to the presence of a bright star ( magnitude of 8.7) located 25 to the north-west of the radio galaxy. A total of 65 emission line candidates with EW Å and is found in the images.
Additional images of the field were taken in 2003 February and 2004 January with the LRIS instrument on the Keck I telescope. Observations were done in the -band (for 277 min), -band (93 min) and -band (100 min). The main purpose of these images is to search for Lyman-break galaxies in the field. In this paper we use the images only to separate possible Ly emitters at from low redshift line emitters.
Follow-up spectroscopy was carried out during two observing sessions
with LRIS on Keck I. In total, four user-defined slitmasks were
observed with exposure times between 120 and 180 min (Table
4). In the four masks, 30 of the 65 candidate Ly emitters were observed. Of these 30 objects, 26 showed an emission
line at the wavelength expected for Ly at , the remaining
four did not show a line (or continuum) in their spectrum. These four
unconfirmed emitters were among the five faintest emitters observed. Most
likely, the emission lines of the four objects are too faint to be
detected.
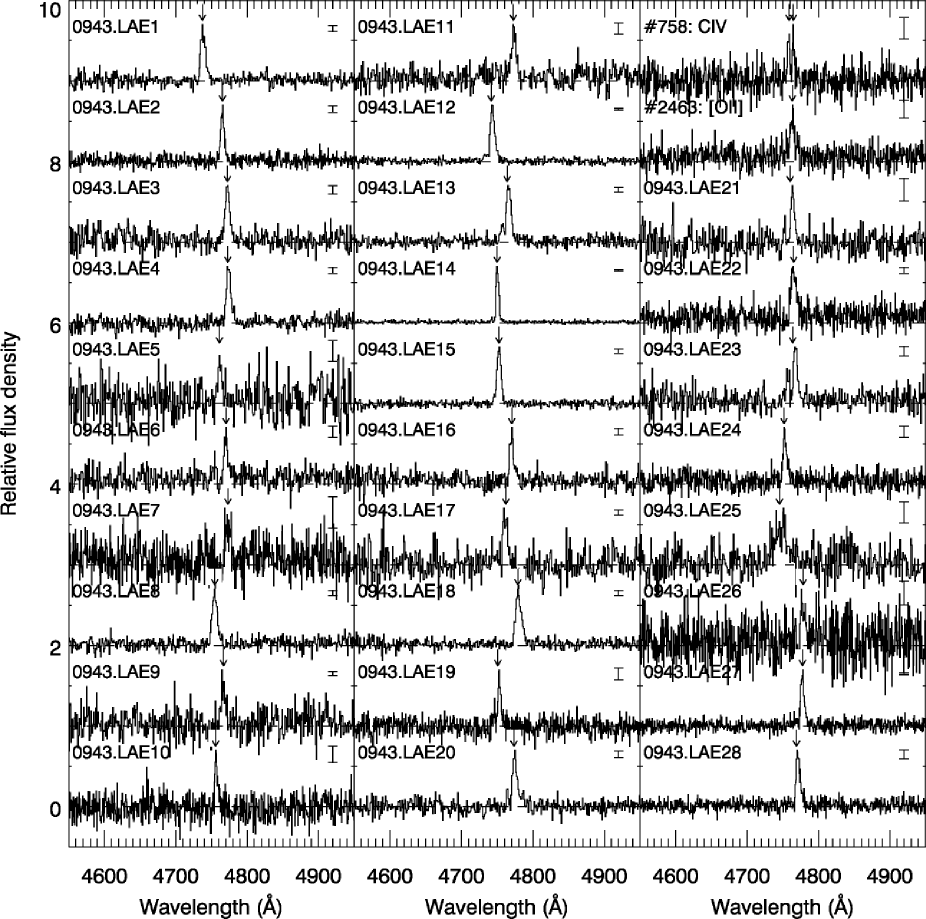
In addition to the 26 confirmed emission line galaxies, four objects
which had a predicted Ly equivalent width Å also showed
an emission line in their spectrum. The spectra of these 30 emission
line objects are shown in Fig. 6.
Line identification
The next question is whether these 30 line emitters are due to Ly at . In contrast to the observations of the 0052 field, the resolution of the spectra was not high enough to resolve the [O ii] doublet.
For three galaxies the redshift could be securely derived. One of these objects (# 758 in Fig. 6) is identified as a C iv emitter at as its emission line is resolved into two lines separated by Å. The redshifts of two other objects are confirmed by the presence of other emission lines in their spectrum. In the spectrum of emitter 0943.LAE25 N v is detected, confirming that the object is a Ly emitter at . The redshift of emitter 0943.LAE18 () is confirmed by the detection of C iv (and a very weak detection of He ii ). The relatively small FWHM of the Ly line (FWHM km s-1) suggests that this object is a type-II AGN (e.g., Norman et al., 2002).
The remaining 27 sources merely show a single emission line in their spectra, which typically cover a wavelength range of over 5500 Å. The most common and brightest low redshift emission line galaxies contaminating searches of Ly emitters are [O ii] emitters (e.g., Fynbo et al., 2003). To distinguish high redshift Ly emitters from low redshift emission line galaxies, various tests can be applied (see Stern et al., 2000, for a detailed review). Below we will briefly describe and apply three tests (the asymmetry of the emission line, the presence of a continuum break and the limits on accompanying emission lines) that are frequently used in the literature to discriminate Ly emitters from low redshift galaxies (e.g., Stern et al., 2000; Fynbo et al., 2001; Rhoads et al., 2003; Dawson et al., 2004; Venemans et al., 2004).
Emission line asymmetry. This test, which makes use of the characteristic blue wing absorption profile of the Ly emission line, has been successfully applied to confirm Ly emitters (e.g., Kodaira et al., 2003; Rhoads et al., 2003; Dawson et al., 2004; Hu et al., 2004). What makes this test extra useful is that a blended [O ii] doublet would appear as a single line with excess emission on the blue side, because the redder line of the doublet is stronger in star forming galaxies (Rhoads et al., 2003). To quantify the asymmetry of an emission line, Rhoads et al. (2003) introduced the two asymmetry parameters (“wavelength ratio”) and (“flux ratio”). These parameters depend on the wavelength where the flux peaks (), and where the flux is at 10% of the peak value on the red side () and the blue side () of the emission line. Using these wavelengths, the “wavelength ratio” is defined as and the “flux ratio” as (Rhoads et al., 2003, 2004; Dawson et al., 2004). Dawson et al. (2004) found that Ly emitters have and/or , while [O ii] emitters at typically have and .
However, this line asymmetry test critically depends on the assumption that a large fraction of the blue part of the Ly emission line is absorbed by neutral Hydrogen. Although absorption is often present, there can still be a significant amount of flux on the blue wing (see the emission lines in e.g. Fig. 3, Tapken et al., 2004, V05). Also, due to the absorption the peak of the Ly line could move to the red, reducing the flux that appears to be redward of the peak (see e.g. the spectra on the left side of Fig. 9 and the spectra in V05). As a consequence, the asymmetry parameters for a Ly line can be smaller than 1.0. For example, if the spectrum of the radio galaxy MRC 0943–242 would be convolved with a Gaussian with a FWHM km s-1 (or would be observed with slightly lower resolution), then the asymmetry parameters would give and . Also, the asymmetry parameters of emitter 0052.LAE1, which is a QSO at as confirmed by N v, are and and those of emitter 0052.LAE31 measure and . Thus, while lines with or are most likely Ly lines, a profile with low values of and could be either an [O ii] or a Ly line.
With this caveat in mind, we measured the asymmetry of our single emission line sources. 21 have and/or , and these emission lines are most likely Ly lines at . The identification of the remaining six lines remains problematic and we have to rely on others tests to secure the redshift.
Continuum break. A prominent feature of high redshift galaxies is the absorption of the continuum blueward of the Ly line, caused by neutral Hydrogen located in the galaxy between the galaxy and the observer (e.g., Madau, 1995). To measure whether the continuum of the line emitters has a discontinuity, we looked at the - and -band images. For a galaxy at the central wavelength of the filter lies below the 912 Å Lyman limit, while the -band begins just redward of the Ly line. Based on a large imaging and spectroscopic survey of high redshift galaxies, Cooke et al. (2005) estimate that the vast majority of galaxies at have a break of . On the other hand, low redshift objects with the Balmer/4000 Å break that falls between the - and -band have a color of (e.g., Hammer et al., 1997).
Of the 27 single emission line sources, 26 were inside the field of view of the -band image. Two objects were too close to a bright foreground object to reliably measure the magnitude. Of the remaining 24 sources two are detected in the -band, the others are not detected. The undetected emitters have typically limits of within an aperture radius of 12, which is twice the radius of the seeing disc. One of the two detected objects in the -band has a signal-to-noise of and a is measured for this object. The second detection, of emitter # 2463 in Fig. 6, has a signal-to-noise of 8 and a . Combined with a measured line asymmetry of and , we conclude that this emitter is a foreground galaxy. The emission line can be most likely identified with [O ii] at a redshift of . It should be noted that this source had a predicted equivalent width of 9 Å, and was therefore not in our list of priority candidate Ly emitters.
Five out of 24 emission line objects have large breaks with a limit of . These objects can securely be identified with high redshift Ly emitting galaxies. For the remaining 18 emission line galaxies, either the continuum was too faint to detect a large break in our images or the photometry in the -band was unreliable due to the presence of a nearby bright object.
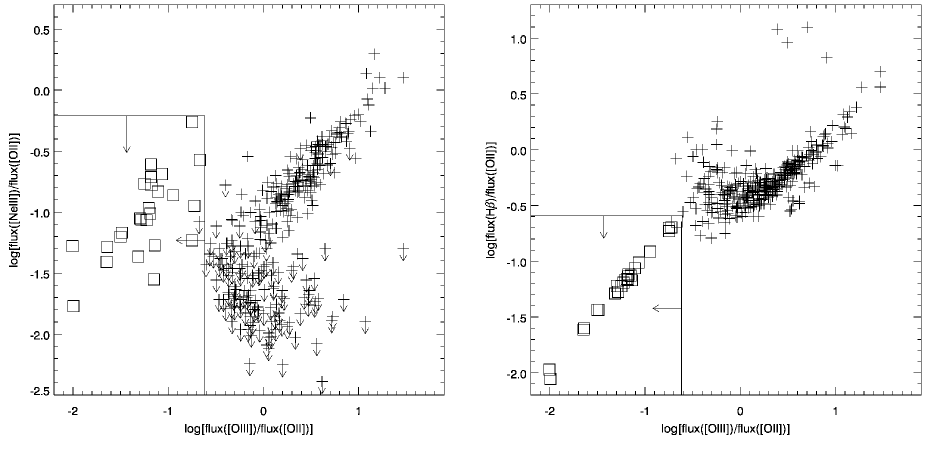
Emission line intensity ratios. Although no other emission lines were found in the spectra of the 27 emission line sources, we can derive upper limits on various line ratios. This is very useful because several other emission lines are expected in the typical spectrum of an [O ii] emission line galaxy, such as [Ne iii], H and [O iii].
What makes this test very useful to us, is the large wavelength range of the spectra of the emission line sources. If the emission line in the spectrum is [O ii], then we are able to place limits on the flux of the [Ne iii], H and [O iii] lines. Although H is also within the probed wavelength range, it falls in a region where bright skylines dominate the spectrum, and the H upper limits are not useful. Instead, we measured the limits on the expected positions of [Ne iii], H and [O iii]. Two sigma limits were computed in a region which is twice the FWHM of the detected emission line. The limits on various emission line ratios are presented in Fig. 5. To compare our limits with low redshift [O ii] emitters, we also plotted line ratios as found by Terlevich et al. (1991) for local H ii galaxies. In all cases, our observed ratios lie in a region outside the values found for local galaxies with [O ii] in emission. We therefore conclude that the emission line objects are Ly emitters.
To summarize, after applying three tests that can discriminate Ly emitters from low redshift emission line galaxies,
we have identified one [O ii] emitter (object
#2463 in Fig. 6) and confirm that the remaining 26
Ly emitters are at . Combined with the two emitters with
C iv in their spectrum, the total number of Ly emitters near the
radio galaxy MRC 0943–242 is 28. The properties of the Ly emission
lines of these galaxies are printed in Table
9.
A large scale structure of Ly emitters
The volume densities of emitters near MRC 0943–242 and near the radio galaxy MRC 0316–257 (V05) are very similar. Down to a narrow-band magnitude of there are 63 emitters in the 0943 field compared to 59 in the 0316 field. Correcting for the difference in observed comoving volume, the density ratio is . This translates to a density of times the field density. Comparing directly to blank field surveys for Ly emitters gives similar results (see also Sect. 3.4). For example, the field density of Ly emitters at was measured by Hayashino et al. (2004) in the 0.17 deg2 Subaru Deep Field. They estimate a space density of Mpc-3 for Ly emitters with a rest frame equivalent width Å down to a narrow-band magnitude of 25.3. Applying the same selection criteria (taking into account the difference in luminosity distance) gives a space density of emitters in the field of MRC 0943–242 of Mpc-3. The density ratio is . When compared to the space density of Ly emitters found by Ciardullo et al. (2002), the overdensity in the 0943 field is . All three estimates of the density presented here are consistent with each other. The weighted average of the estimates is .
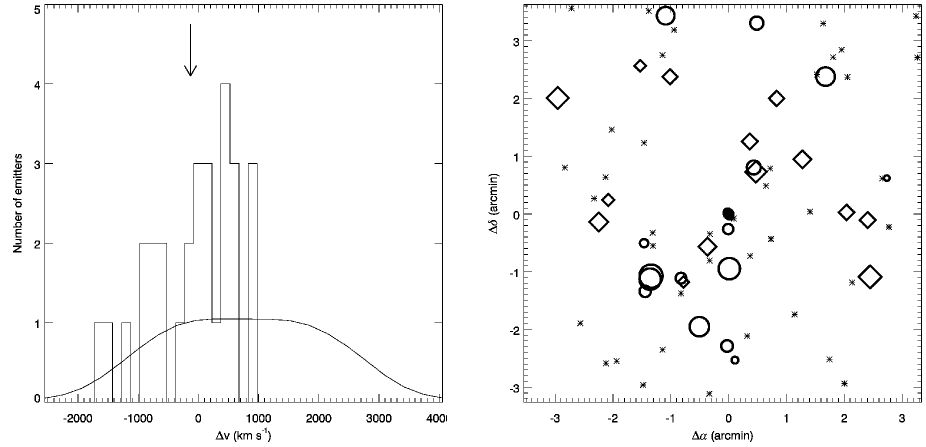
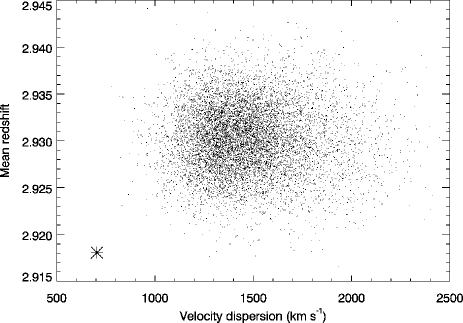
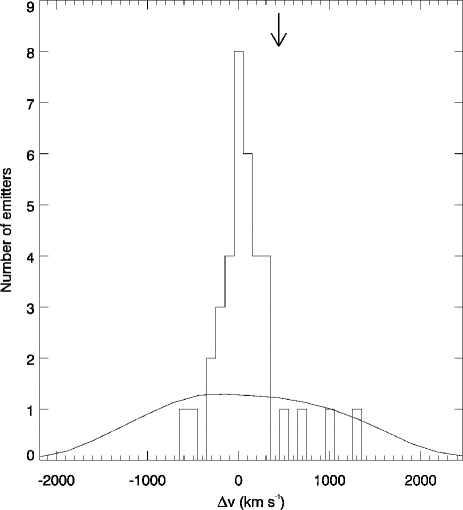
In Fig. 7 the velocity and spatial distribution of the emitters is shown. Although the emitters have no preferred position on the sky, they are clustered in velocity space. We can estimate the significance of the clustering by performing Monte Carlo simulations of the redshift distribution. We reproduced 10 000 realizations of 28 emitters using the narrow-band filter curve as redshift probability function for each emitter. We find that both the mean velocity and the dispersion of the emitters are significantly smaller than that of the simulated redshift distributions at a level of (Fig. 8)333Recently, Monaco et al. (2005) investigated the effect of peculiar velocities on the redshift distribution of Ly emitters using dark matter simulations. They found that the velocity dispersion of Ly emitters is smaller than based on the Monte Carlo simulations described above, lowering the significance of the redshift clumping.. This is a strong indication that the suggested grouping of Ly emitters is not a projection effect. The velocity dispersion of the confirmed emitters is km s-1. This dispersion could be a lower limit, since no clear edge is visible in the distribution on the negative velocities side.
3.6 MRC 0316–257,
This 1.5 Jy radio source from the Molonglo Reference Catalogue (Large et al., 1981) lies at a redshift of 3.13 by McCarthy et al. (1990). This target was especially interesting, because Le Fèvre et al. (1996) found two bright Ly emitters close to the radio galaxy, which indicated that this radio galaxy is in an overdense environment. Narrow- and broad-band imaging of this field with the VLT resulted in the discovery of 77 candidate Ly emitters. Follow-up spectroscopy revealed 33 emission line galaxies of which 31 are Ly emitters near the radio galaxy, while the remaining two are foreground galaxies. By comparing the number density of Ly emitters near the radio galaxy to that of the field, the overdensity of emitters near 0316 is estimated to be a factor times the field density (V05). The velocity distribution of the emitters has a width of FWHM = 1510 km s-1, which is smaller than the width of the narrow-band filter (FWHM km s-1). The peak of the distribution is located within 200 km s-1 of the redshift of the radio galaxy. In V05 we have shown that the confirmed emitters are members of a protocluster at with an estimated mass of M☉.
3.7 TN J2009–3040,
This radio source was selected by De Breuck et al. (2000) as an ultra steep
spectrum radio source (, with
) and was identified with a object which has a strong unresolved component
(De Breuck et al., 2002). Spectroscopy of this object revealed three emission
lines, including Ly with a FWHM of km s-1 at a redshift
of 3.156. Based on the width of the emission lines and the morphology
of the source, this radio source is identified as a quasar (C. De
Breuck, private communications).
Imaging observations
Obtaining deep images of this field was challenging for two
reasons. First, the
field is located close to the galactic centre ( and ) and the extinction towards the radio source is high, with
an (Schlegel et al., 1998). Secondly, due to emission from
inside our Galaxy the background towards the quasar is not flat, but
varies up to 10% over scales of roughly 10″. We removed this
variable background by subtracting the median pixel value calculated
in 10″10″ boxes surrounding each pixel.
Spectroscopic observations and results
Analysis of the narrow-band and -band images resulted in a list of 21 candidate Ly emitters. In 2002 September spectra were taken of nine of these candidates for 330 min with FORS2. The use of the 1400V grism (with a resolution of ) allowed us to identify low redshift interlopers like [O ii] emitters (see Fig. 2), similar to the 0052 field. We confirmed that all nine candidates were Ly emitters at (Fig. 9). Two objects with predicted EW Å and (2009.LAE2 and 2009.LAE5 in Fig. 9 and Table 10) were also confirmed to be Ly emitters near the radio source. Two galaxies with a predicted EW and 9 Å were confirmed to be [O ii] emitters at (bottom two spectra in Fig. 2). In total, 11 Ly emitters are found near the radio source. Two of these emitters are broad-line QSOs with a FWHM of 1600 and 3200 km s-1 (see left panel of Fig. 9).
The detection of (broad-line) QSOs near radio galaxies is quite common. In each of the radio galaxy fields described in this paper, at least one of the Ly emitters is confirmed to have a line FWHM of km s-1 (see Tables 7–11), an indication that these objects harbour an active galactic nucleus (AGN). In the protocluster near the radio galaxy MRC 1138–262 at (Sect. 3.3) at least four QSOs are confirmed (Pentericci et al., 2002; Croft et al., 2005).
In Fig. 10 the velocity histogram and the spatial
distribution of the confirmed Ly emitters are shown. The median
redshift of the emitters lies 170 km s-1 away from the radio
source. The velocity dispersion of the emitters as calculated with the
Gapper scale estimator (which is preferred for low ()
number statistics, Beers et al., 1990) is km s-1. This is a factor
3 smaller than that of the narrow-band filter, which has a
km s-1.
Monte Carlo simulations of the distribution of 11 emitters through the
narrow-band filter, we found that there is an 8% chance that the
velocities of the emitters are drawn from a random distribution. On
the sky, the emitters appear to be concentrated on the southern half
of the field. The position of the radio source is on the edge of the
distribution of Ly emitters, very similar to the situation in the
field of TN J1338–1942 at (Venemans et al., 2002, Sect. 3.8).
Volume density
We can compare the number density of Ly emitters in this field directly to that of the 0316 field, because the same narrow-band filter was used. The number of (candidate) emitters down to the same luminosity limit is in the 2009 field a factor smaller than that in the 0316 field. The 0316 field is overdense by a factor 3.3 (V05), which implies that the number density of Ly emitters near TN J2009–3040 is a factor times the field density, with is consistent with no overdensity. However, nine out of 11 confirmed emitters lie south of the radio galaxy, as do nine out of 12 unconfirmed candidates (Fig. 10). This could indicate that (locally) the volume density of Ly emitters near the radio source TN J2009–3040 is much higher than the field density. Although the volume density of Ly emitters near TN J2009–3040 is consistent with the field density at that redshift, the clustering both on the sky and in velocity space of the emitters could points to a structure of galaxies. More observations are needed to determine the reality of this clustering.
3.8 TN J1338–1942,
This radio galaxy has a redshift of 4.1 (De Breuck et al., 1999, 2001) and is one
of the brightest known in Ly (De Breuck et al., 1999, 2001).
Because no narrow-band filter is available at
the VLT that is centred on the wavelength of a Ly line at ,
we used a custom narrow-band filter with an effective wavelength of
6199 Å and a FWHM of 59 Å. Narrow-band and -band imaging and
follow-up spectroscopy with the VLT of the field of TN
J1338–1942 revealed 20 Ly emitters within a projected distance of
1.3 Mpc and 600 km s-1 of the radio galaxy (Venemans et al., 2002). The structure
is overdense in Ly emitters by a factor of 4–15 and could be the
ancestor of a rich cluster of galaxies. Multi-color imaging with the
Advanced Camera for Surveys (ACS) on board the Hubble Space
Telescope (HST) revealed an anomalously large number of
LBGs near the radio galaxy, confirming the presence of a
protocluster at (Miley et al., 2004; Overzier et al., 2006a).
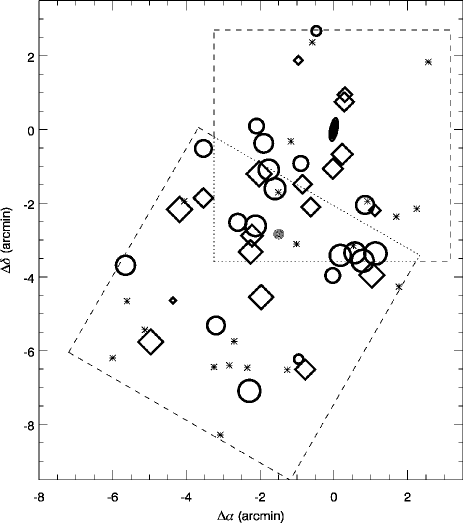
New observations
The VLT observations presented in Venemans et al. (2002) showed that the emitters are not distributed homogeneously over the field, but appear to have a boundary in the north-west. To further determine the extent and shape of the protocluster region, the field near TN J1338–1942 was imaged at a second position. The second pointing is located towards the south-east of the radio galaxy and overlaps the first field (hereafter the 1338-1 field) at the position where the concentration of Ly emitters seemed to be the highest (see Fig. 11 for the outline of the imaging areas). The second field (hereafter 1338-2) was observed for 420 min in the narrow-band and for 75 min in the -band. Analysis of data in the second field resulted in the discovery of 35 candidate emitters. Ten candidate emitters were also selected as candidates in the 1338-1 field and eight of them were confirmed by Venemans et al. (2002). One candidate emitter in the second field catalogue has an EW Å, but a computed equivalent width of Å in the first field catalogue. The (weighted) average of these two measurements is EW Å. Because this is below our selection criterion of EW Å, we removed the object from our candidate list. Follow-up spectroscopy showed that the object is an [O ii] emitter at . The total number of candidate emitters in the two fields combined is 54.
Spectroscopic observations of candidate emitters in the second field were carried out in 2003 February with Keck/LRIS (150 min) and in 2003 March with VLT/FORS2 (310 min, see Table 4). In the two observing sessions combined, spectra were taken of 15 good candidate emitters. In addition, objects were observed that were lower on our priority list. These additional objects included four emitters that were already confirmed by Venemans et al. (2002), six candidate emitters with Å EW Å and five galaxies with an EW Å, but with a signal-to-noise in the narrow-band image of .
Of the 15 good candidate emitters, 13 were confirmed to be Ly emitters at . The two unconfirmed emitters were among the
faintest candidates that were observed in that mask. From the
additional objects that were observed, the four emitters that were
confirmed by Venemans et al. (2002) were all reconfirmed. Among the
low equivalent width sources was one Ly emitter at
and five [O ii] emitters at a redshift . The low signal-to-noise
sources added another two Ly emitters at to the list of
confirmed emitters. Combined with the data described in Venemans et al. (2002),
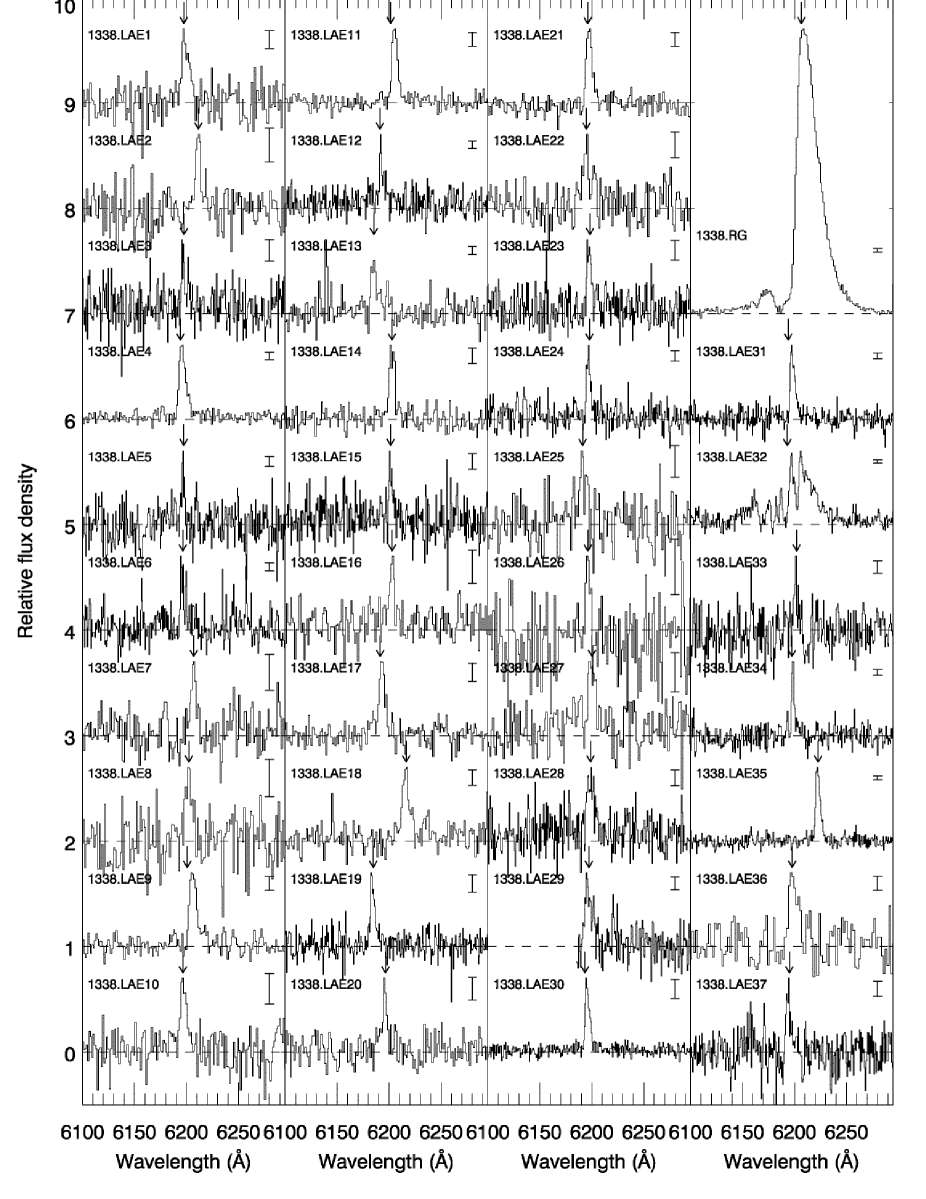
the total number of confirmed Ly emitters at is 37. In
Fig. 12 the spectra of the confirmed emitters and of
the radio galaxy are shown. In Table 11 the properties of
the emission lines are listed.
Volume density
Several blank field surveys for Ly emitters at redshifts between and have been conducted in recent years. The two surveys covering the largest area are the LALA survey, aimed at finding Ly emitters at (Rhoads et al., 2000; Dawson et al., 2004), and the Subaru Deep Field (SDF) survey, in which was searched for Ly emitters at (Ouchi et al., 2003; Shimasaku et al., 2003, 2004).
To estimate the (over)density of Ly emitters near TN J1338–1942, we compare our density to that found in the LALA and SDF surveys. The LALA survey probed a volume of comoving Mpc3 and candidate Ly emitters were discovered in this volume with an observed equivalent width Å and a line flux erg s-1 cm-2 (Rhoads et al., 2000; Dawson et al., 2004). Follow-up spectroscopy confirmed 72% of the targeted sources (Dawson et al., 2004), but we will conservatively assume that all 350 LALA candidates are genuine Ly emitters. Applying the same luminosity and equivalent width criteria used in the LALA survey to our data selects 14 candidate Ly emitters in our field of which 13 are confirmed (one has not been observed spectroscopically yet). Compared to the LALA survey, the density of Ly emitters near TN J1338–1942 is a factor higher. The large errors are due to small number statistics.
The SDF survey covers an area of 25′45′, which is
observed in two 1% narrow-band filters, one centred on Ly at and one at . The volume density of
emitters with magnitudes at these two redshifts
is very similar ( Mpc-3 at and Mpc-3 at , Shimasaku et al., 2004). Selecting Ly emitters in our field in the same
way as was done in the SDF by Shimasaku et al. (2003), and comparing our numbers
to those at and gives an overdensity of
. The weighted average of these density
measurements is ,
consistent with the overdensity found by Venemans et al. (2002).
Structure properties
As mentioned in Venemans et al. (2002), the spatial distribution of emitters near 1338 is not homogeneous over the field. In Fig. 11 the spatial distribution is plotted of all the confirmed and candidate emitters in the two fields. The average position of the emitters (filled circle in Fig. 11) lies approximately 15 east and 28 south of the radio galaxy. The radio galaxy appears to be at the (northern) edge of the galaxy distribution. In contrast to the position on the sky of the Ly emitters, De Breuck et al. (2004) found an overdensity of mm galaxies just north of the radio galaxy in this field. Although there is no spectroscopic confirmed whether the mm galaxies belong to a structure at the redshift of the radio galaxy, it is possible that different galaxy populations in the protocluster have different spatial distributions (see also Sect. 5.1).
The redshift distribution of the emitters is shown in Fig. 13. The velocity distribution is very narrow, with a dispersion of only km s-1 (FWHM km s-1). This is much narrower than the width of the narrow-band filter, which has a FWHM of 2860 km s-1. Monte-Carlo simulations indicate that the chance that such a narrow redshift distribution is drawn from a random sample is only 0.05%. Although the number of confirmed emitters has almost doubled since the discovery of this protocluster, the velocity dispersion has not changed. This indicates that the confirmed emitters in both the southern and northern field are members of one single structure. The small value of the velocity dispersion might suggest that we are looking at a flattened structure like a filament perpendicular to the line of sight. However, as we will show in Sect. 5.3, the velocity dispersion of the emitters in this field is in line with predictions of numerical models of the formation of massive structures. The properties of this protocluster at will be described in more detail in Sect. 5.
3.9 TN J0924–2201,
| Name | Size | PA halo | PA radio | |
|---|---|---|---|---|
| erg s-1 | kpckpc | dega | dega | |
| BRL 1602–174 | 9055 | 60 | 56b | |
| MRC 2048–272 | 7040 | 25 | 42b | |
| MRC 1138–262 | 250125 | 74 | 98b | |
| MRC 0052–241 | 3530 | 5 | 15b | |
| MRC 0943–242 | 5040 | 55 | 74b | |
| MRC 0316–257 | 3525 | 55 | 53b | |
| TN J2009–3040 | 4040 | –c | 144b | |
| TN J1338–1942 | 13045 | 170 | 152b | |
| TN J0924–2201 | 1010 | 90 | 74b |
a Position Angle in degrees, measured east of north.
b References for the radio position angles: Best et al. (1999) (1602),
Pentericci et al. (2000b) (2048), Pentericci et al. (1997) (1138), Kapahi et al. (1998) (0052),
Pentericci et al. (1999) (0943), Carilli et al. (1997) (0316), De Breuck et al. (2000) (2009, 1338
and 0924).
c The halo of TN J2009–3040 is circular.
TN J0924–2201 is currently the highest redshift radio galaxy known with a redshift of (van Breugel et al., 1999). To select Ly emitters in this field, a custom narrow-band filter encompassing the wavelength of the Ly line of the radio galaxy at 7537 Å was purchased. The details of the observations and candidate selection in this field are presented in Venemans et al. (2004). Follow-up spectroscopy of eight of 14 candidate Ly emitters resulted in the discovery of six Ly emitters near the radio galaxy (Venemans et al., 2004). The field is overdense in Ly emitters by a factor of 1.5–6.2 times the field density at that redshift and comparable in density to the radio galaxy fields 1138, 0316 and 1338 at and 4.1 respectively.
3.10 Radio galaxy Ly halos
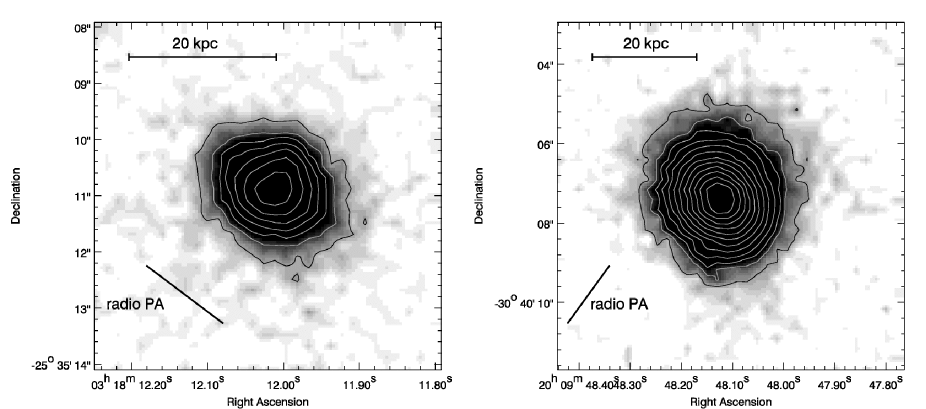
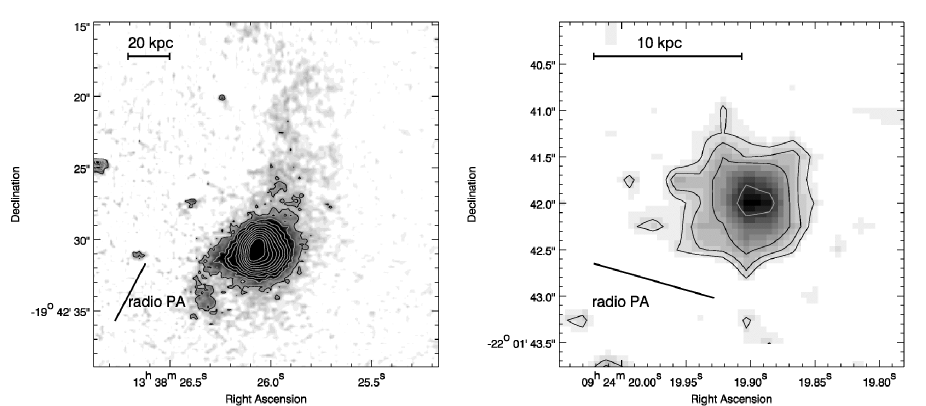
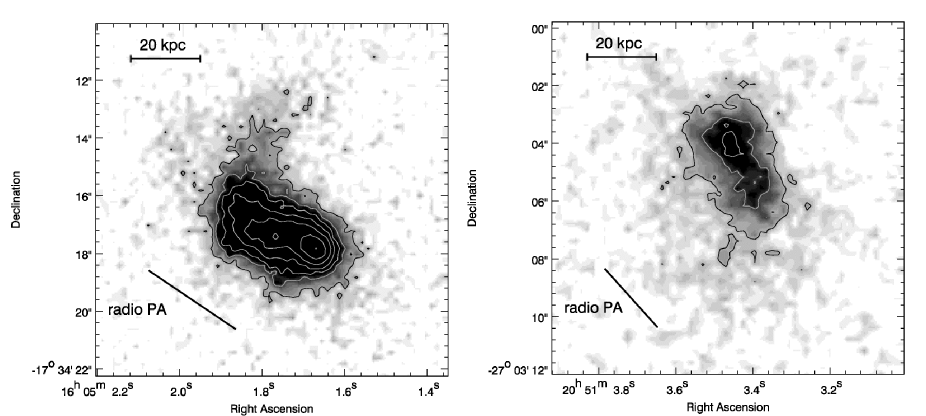
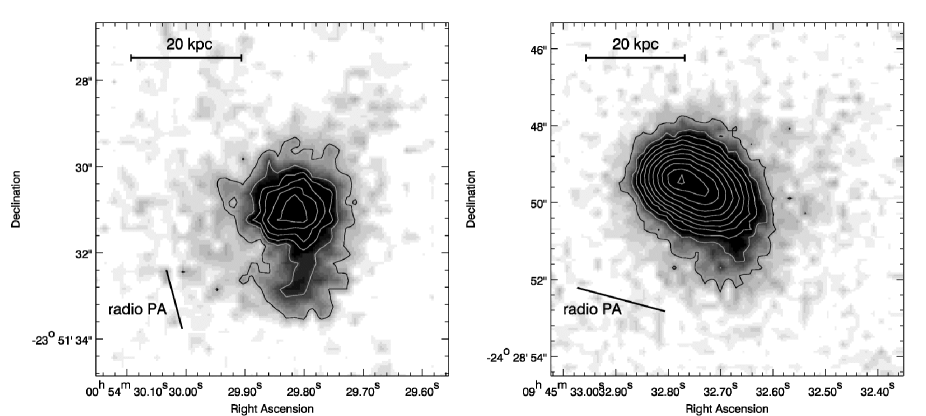
Besides allowing the detection of candidate companion galaxies, the deep narrowband Ly images of the radio galaxy fields also provide deep maps of the diffuse emission line halos that surround the radio galaxies. In each of the observed fields, the radio galaxy is the brightest emitter of Ly emission, with line luminosities ranging between and a few times erg s-1. The continuum subtracted Ly images of the radio galaxies observed in our VLT program are shown in Figs. 14–17. The region from which the Ly emission originates is spatially resolved and the emission line halos can be seen over 150 kpc in some cases. In Table 5, we summarize the luminosity, size and position angles of the halos.
The position angles of the emission line halos and the radio emission are aligned, with the difference in the angle generally less than 20∘ (see Table 5). This alignment between the emission line halo and the radio jet is a common feature in radio galaxies (e.g. McCarthy, 1993; van Ojik et al., 1996; Pentericci et al., 1997; Reuland et al., 2003), and suggests that a least part of the Ly emission is caused by the interaction of the gas with the radio jet or by ionisation by the photon beam that is aligned with the radio jet. See for a detailed analysis of the halos of the radio galaxies 1138 and 1338 the papers of Pentericci et al. (1997) and Zirm et al. (2005) respectively. Because an extensive study of the gas halos surrounding the other radio galaxies is beyond the scope of this article, we will present those results in a separate paper (Humphrey et al. in prep).
It is interesting to mention that we do not find (angular) clustering of Ly emitters along the axes of the radio sources. This so-called “companion alignment” has been predicted by models (e.g. West, 1994) and statistical detections of this effect using number counts have been reported by various authors (e.g. Röttgering et al., 1996; Bornancini et al., 2006). In contrast, the spatial distribution of the Ly emitters near the radio galaxies studied in our program is rather homogeneous throughout the field (e.g. Figs. 4, 7, and Fig. 19 in V05). Recently, Croft et al. (2005) reported that near 1138 at least three spectroscopically confirmed, X-ray selected AGN are, together with the radio galaxy, members of a filamentary structure of at least a few (proper) Mpc, in alignment with the radio jet axis. The Ly emitters in this protocluster do not show such a clear alignment (Kurk et al., 2004b). It is therefore possible that only certain types of galaxies, e.g. the more massive galaxies, are preferentially aligned with the radio galaxy axes, while the young and presumably less massive Ly emitters (V05) do not show this angular clustering. Future observations, aimed detecting the different galaxy populations in the protoclusters, could test this picture.
4 The environment of high redshift radio galaxies
| Field | |||||||||||
|---|---|---|---|---|---|---|---|---|---|---|---|
| km s-1 | M☉ | ||||||||||
| 1602 | 2.04 | 2 | – | – | – | – | – | – | – | – | – |
| 2048 | 2.06 | 10 | 3 | 2 | 1 | 0 | 1 | 3 | – | – | |
| 1138 | 2.16 | 37 | 11 | 11 | 0 | 0 | 4 | 15 | 3–4 | ||
| 0052 | 2.86 | 57 | 36 | 35 | 1 | 0 | 2 | 37 | 3–4 | ||
| 0943 | 2.92 | 65 | 30 | 25 | 4 | 1 | 3 | 28 | 4–5 | ||
| 0316 | 3.13 | 77 | 30 | 28 | 1 | 1 | 3 | 31 | 3–5 | ||
| 2009 | 3.16 | 21 | 9 | 9 | 0 | 0 | 2 | 11 | – | ||
| 1338 | 4.11 | 54 | 36 | 34 | 2 | 0 | 3 | 37 | 6–9 | ||
| 0924 | 5.20 | 14 | 8 | 6 | 0 | 2 | 0 | 6 | 4–9 |
a Number of candidate Ly emitters with EW Å and EWEW.
b Number of spectroscopically observed candidates.
c Number of spectroscopically confirmed Ly emitters.
d Number of candidates not detected spectroscopically.
e Number of low redshift emission line galaxies among the observed
candidates.
f Number of confirmed Ly emitters not satisfying the imaging selection
criteria.
g Total number of confirmed Ly emitters near the radio galaxy.
h Density of the emitters as compared to the field density on the
basis of the imaging candidates. Note that the redshift range of
the confirmed emitters is generally smaller than the width of the
filter (see Sects. 3 and 5.2).
i Velocity dispersion of the confirmed emitters.
j Estimated mass of the protocluster (Sect. 5.2).
Besides the target of our pilot project, MRC 1138–262 at , we imaged areas surrounding eight radio galaxies with . A total of 300 candidate Ly emitters was selected fulfilling the selection criteria EW Å and EWEW (Tables 3 and 6). One field (BRL 1602–174 at ) suffered from high galactic extinction and a low response of the CCD. We will discard this field in the following discussion. In the remaining seven radio galaxy fields spectra were taken of 152 candidates. These observations confirmed 139 Ly emitters. The success rate of our selection procedure is %. Only nine candidates could not be confirmed spectroscopically. These candidates had a faint predicted line flux ( erg s-1 cm-2) and the non-detections are most likely caused by a lack of signal-to-noise. An overview of the number of candidates, spectroscopically observed and confirmed Ly emitters per field is given in Table 6.
Four candidate emitters were identified with low redshift objects. We estimate that the contamination of our (candidate) sample is roughly %, although this percentage varies strongly from field to field and with redshift. For example, the fraction of contaminants in the field surrounding TN J0924–2201 at is 25% (Venemans et al., 2004), while in four fields near , the contamination fraction is % (see Table 6).
Fourteen objects that fell outside our selection criteria were also confirmed to be Ly emitters, increasing the number of confirmed Ly emitters to 153. Adding the 15 confirmed emitters in the 1138 field (Pentericci et al., 2000a), a total of 168 Ly emitters are confirmed near eight high redshift radio galaxies.
Based on the (volume) overdensity and the clustering of emitters in redshift space, we argue that at least five of the radio galaxies (MRC 1138–262, MRC 0052–241, MRC 0943–242, MRC 0316–257 and TN J1338–1942) are associated with a forming cluster of galaxies (protocluster). We are not able to make a definite statement about the environment of TN J0924–2201 at , due to the small number of confirmed galaxies (Venemans et al., 2004). Recent multi-color observations with the HST indicate that this field is overdense (at the 99.6% level) in -band dropouts (Overzier et al., 2006b), and these dropouts could represent an additional galaxy population in the protocluster. Although follow-up spectroscopy is needed to confirm that the dropouts are at , the richness of Lyman break galaxies in the field strengthens our hypothesis that a large structure is present at . The two remaining radio galaxy fields, the 2048 and 2009 fields, have Ly volume densities consistent with the field density. In the 2009 field, clustering can be seen in the position of the emitters on the sky and in velocity space. More observations in this field are needed to confirm the clustering and to identify a possible structure of galaxies. Based on the results in the eight radio galaxy fields, 75% of luminous ( erg s-1 Hz-1 sr-1) radio galaxies at are associated with a forming cluster of galaxies.
In the next section, we will describe the properties of the radio galaxy protoclusters as a whole. The properties of the high redshift Ly emitters are or will be discussed elsewhere (Kurk et al. 2004b; V05; Venemans et al. in prep.).
5 Properties of high redshift protoclusters
5.1 Structure size
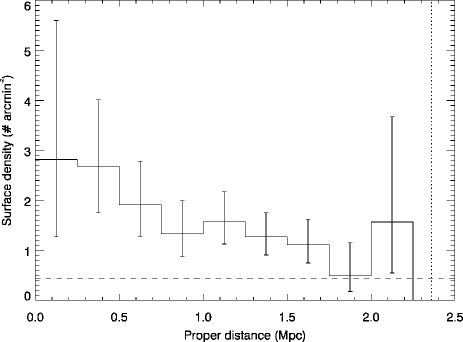
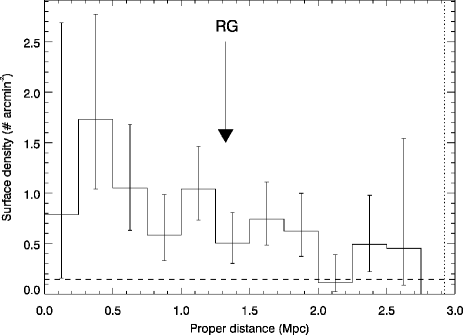
As can be seen in Figs. 4, 7, 10 and 11, the sizes of the protoclusters are generally larger than the field of view of the FORS2 camera (3.23.2 Mpc2). Only in the 1338 field a boundary can be seen to the north-west of the radio galaxy (but see below). Kurk et al. (2004b) found that the surface density of Ly emitters decreased with increasing distance to the radio galaxy in their field. Within the limitations of the relatively small number of objects, we tested each of our fields to see whether there is a concentration of emitters near the radio galaxy. In two fields, the 0052 and 0316 fields, we found that density did not change with distance to the radio galaxy, and that the distribution of emitters was roughly homogeneous over the imaged area. Most likely, the extent of the protocluster in these fields is larger than the area covered by our imaging. In the 0943 field at , the surface density of Ly emitters declines further away from the radio galaxy, as is shown in Fig. 18. At a proper distance of 1.75 Mpc from the radio galaxy, the surface density of Ly emitters is consistent with the field density. We regard this radius as the size of the protocluster. A similar distribution was found in the 1338 field, but only if the average position of the emitters was taken as centre (see Fig. 19). As mentioned in Sect. 3.8, the radio galaxy is located at a distance of 1.3 Mpc from the centre of the emitters. We estimate that the size of this protocluster is 2.0 Mpc (Fig. 19).
However, these size estimates of the protoclusters are based only on the position of Ly emitters. It is possible that other galaxy populations in the protoclusters are distributed differently. As already mentioned in Sect. 3.8, an overdensity of mm galaxies is located to the north of the radio galaxy TN J1338–1942 (De Breuck et al., 2004), whereas the highest concentrations of Ly emitters in this field lies south of the radio source. Also, Kurk et al. (2004b) found that in the 1138 protocluster at the population of H emitters and EROs are more concentrated towards the radio galaxy than the Ly emitters. Despite this caveat, our size (radius) estimates of 1.75–2.0 Mpc are consistent with the determination by other groups. For example, Keel et al. (1999) estimate that the large structure around the radio galaxy 53W002 at has a diameter of Mpc. Hayashino et al. (2004) imaged a protocluster at , that was serendipitously discovered by Steidel et al. (1998). They found that the region that is overdense in Ly emitters has a size of approximately 55 Mpc2. At a higher redshift, an overdensity of Ly emitters at was discovered by Shimasaku et al. (2003) in the SDF. This overdensity has a roughly circular shape with a radius of 2.0 Mpc (Shimasaku et al., 2003), which is very similar to the size of the 1338 protocluster.
To summarize, we find that the sizes of the protoclusters, as inferred by the distribution of Ly emitters at and , are roughly Mpc. The other protoclusters do not show a boundary and could be larger. Wide field imaging is needed for these protoclusters to see a boundary of the galaxy distribution.
5.2 Mass
The age of the Universe at is only % of its current age, which corresponds to Gyr in our adopted cosmology. A protocluster galaxy with a relative velocity of 500 km s-1 would take at least 4 Gyr to cross a structure with a size of 2 Mpc. Therefore, the protoclusters are most likely still in the process of formation. They are still far from virialization and we cannot use the virial theorem to calculate the mass of the galaxy structures.
An alternative approach to calculate the mass of the structures is to assume that the mass that is located within the volume that is occupied by the protocluster galaxies will collapse into a single structure (see e.g., Steidel et al., 1998). To use this method we need to know the mass overdensity within the volume. The mass overdensity is related to the galaxy overdensity by the bias parameter .
To compute the volume of the protocluster, we estimate the redshift range of the confirmed Ly emitters after removing outliers (galaxies more than 1500 km s-1 away from the median redshift). Because redshift space distortions modify the occupied volume, we corrected for peculiar velocities by assuming the structure is just breaking away from the Hubble flow (see Steidel et al. 1998; V05 for more details). If outliers are included, the volume occupied by the protoclusters increases and the estimated masses are higher.
Using this method, V05 estimate that the mass of the 0316 protocluster is M☉. Below we will estimate the mass of the protoclusters in the 1138, 0052, 0943, 1338 and 0924 fields. A bias parameter of will be assumed, as suggested by e.g. Steidel et al. (1998) and Shimasaku et al. (2003).
1138: near the radio galaxy MRC 1138–262, the overdensity of emitters in a comoving volume of 4490 Mpc3 is (Pentericci et al., 2000a; Kurk et al., 2004b). The computed mass in this volume is at least M☉.
Interestingly, the redshift distribution of the Ly emitters in this field appears to be bimodal (Pentericci et al., 2000a). The emitters are located in two subgroups with velocity dispersions 520 and 280 km s-1 (Pentericci et al., 2000a). Calculating the mass of the individual groups gives and M☉. If the galaxies in these two groups are close to virialization, we can apply the virial theorem. Kurk et al. (2004b) estimated that the virial radii of the two groups is Mpc. Using the velocity dispersions as given by Pentericci et al. (2000a), the virial masses of the groups are and M☉, comparable to the other estimates.
0052: to estimate the volume that most likely will collapse into a single structure, we removed the three lowest and the two highest redshift galaxies. These galaxies are on the edges of the redshift distribution (Fig. 4), and we regard them as outliers. The remaining 32 emitters have redshifts in the range . The range of is a factor 2.3 smaller than the redshift range probed by the narrow-band filter (). The volume occupied by the emitters is 3510 comoving Mpc3 (uncorrected for peculiar velocities). The overdensity within the volume is . Using these values, the estimated mass is M☉. Because the field of view of our imaging is not large enough to show a boundary of the structure (Fig. 4), this mass is a lower limit.
As in the 1138 field, the emitters are concentrated in two velocity groups (see Fig. 4). The groups consist of 12 and 19 members and have velocity dispersions of 185 and 230 km s-1 respectively. Assuming that the virial theorem can be applied for the two groups, this gives masses of and M☉ for the groups. Most likely, the mass of the protocluster lies in the range M☉.
0943: the redshift range of the confirmed emitters is 0.034, and, as described in Sect. 5.1, the size of the structure is roughly 1.75 Mpc in radius. This gives a comoving volume of 4570 Mpc3. Within this volume 61 of the 65 emitters (94%) are located. The overdensity of emitters in this volume is 5.5, giving a protocluster mass of M☉. Because the protocluster might extend towards lower redshifts (see Fig. 7), this mass must be regarded as a lower limit.
1338: the protocluster has a size of 2 Mpc in radius (Sect. 5.1), giving an area that is 78% of the total area observed (Fig. 11). The fraction of (candidate) emitters in this area is 91%. The volume occupied by these emitters is 5815 Mpc3. The overdensity of emitters in this volume is , resulting in a mass of M☉.
0924: the redshifts of the confirmed emitters near TN J0924–2201 only span a relatively narrow redshift range of (Venemans et al., 2004). The corresponding volume is 1870 Mpc3 and the density of emitters as compared to the field density in this volume is 20.3. The structure mass is estimated to be M☉, although the small number of confirmed emitters makes this mass quite uncertain.
The mass estimates of the protoclusters are in the range M☉. Locally, such masses correspond to clusters with Abell richness class 0 and higher (e.g., Bahcall & Cen, 1993). This indicates that the protoclusters are the progenitors of present-day massive clusters.
5.3 Velocity dispersions
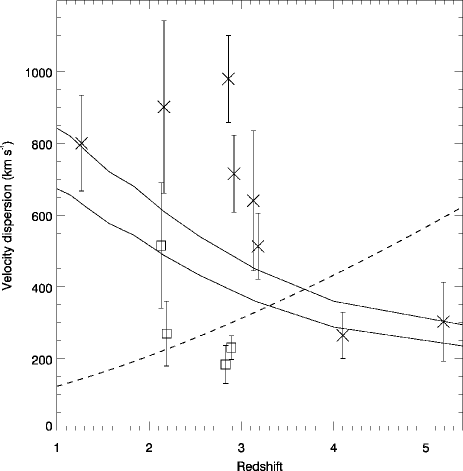
In Fig. 20, the velocity dispersion of the Ly emitters in the radio galaxy fields are plotted as a function of redshift. Despite the small number of data points, the dispersion appears to increase with decreasing redshift. While at the velocity dispersion is km s-1, the dispersion increases to 500–700 km s-1 at . In our two lowest redshift fields ( and ), the velocity dispersion of the emitters is 1000 km s-1. However, it should be noted that the velocity distribution of emitters at and is bimodal (Sect. 5.2), and the velocity dispersion of the individual subgroups is much lower (200–500 km s-1). Numerical simulations of the evolution of massive clusters predict that the velocity dispersion of the dark matter increases with cosmic time (e.g., Eke et al., 1998). Although based on only one population of galaxies in the protoclusters, our observations are consistent with these predictions. Our data approximately follow the evolution of a massive cluster of galaxies, with a velocity dispersion of 1000 km s-1 at (Fig. 20). Additional observations of high redshift protoclusters are needed to confirm this.
6 Discussion
A question is whether the radio galaxy selected protoclusters presented in this paper are biased. To answer this question, we have to assess the number density of powerful radio galaxies at .
The radio galaxies in our program have luminosities erg s-1 Hz-1 sr-1 (Table 1). The number density of radio sources with this luminosity limit in the redshift range is Mpc-3 (Dunlop & Peacock, 1990). Using the more recent radio luminosity function at 151 MHz as derived by Willott et al. (2001) and assuming a spectral slope of gives a number density that is similar within a factor of 2. It should be noted that the number density depends strongly on the lower luminosity limit that is assumed, since the density varies approximately with (Dunlop & Peacock, 1990).
The association of 75% of radio galaxies with a protocluster (Sect. 4) implies that there are roughly forming clusters at per comoving Mpc3 with an active radio source. However, it is likely that there will be many more forming clusters in this redshift range without an active radio source. Blundell & Rawlings (1999) argue that high redshift radio galaxies are visible only when they are younger than yr. Between and , the age of the Universe increases with roughly 2 Gyr. This means that between and , there must be a factor more forming clusters without a bright radio source. Therefore, most high redshift protoclusters will not have a powerful radio galaxy.
Based on these calculations, we estimate that the number density of protoclusters such as the ones presented in this paper is Mpc-3. It is instructive to compare this number with the density of protoclusters as derived by other groups. Steidel et al. (1998) estimate that they find one galaxy overdensity in a 9′18′ field in a redshift range in their Lyman break galaxy survey. In our cosmology, this translates to a number density of protoclusters of Mpc-3. High redshift blank field Ly searches also found several galaxy overdensities. Shimasaku et al. (2003) reports the discovery of a structure of Ly emitters at in the Subaru Deep Field with an estimated mass of M☉. The implied volume density of such structures is Mpc-3. At even higher redshifts, Ouchi et al. (2005) find two overdensities of Ly emitters at in a 1.0 deg2 region of the sky. They estimate a density of Mpc-3 for such structures. These blank field density estimates are very similar to our calculated density of Mpc-3. This indicates that the overdensities discovered in blank field surveys and our protoclusters near radio galaxies could very well be the same type of object. It is likely that we see the protocluster at the time that the brightest cluster galaxy undergoes a burst of nuclear activity.
Interestingly, in the local Universe objects with a similar volume density as the protoclusters are clusters with masses M☉ (Girardi et al., 1998; Reiprich & Böhringer, 2002), which compares favourably with the mass estimates presented in Sect. 5.2. This further supports the idea that the protoclusters are the progenitors of (rich) clusters of galaxies.
7 Summary
In this paper we have presented the results of a large observational program to search for galaxy overdensities near luminous radio galaxies at . The targets for our project were selected from a list of roughly radio sources, and were required to be luminous in the radio with erg s-1 Hz-1 sr-1 and to have redshifts and positions optimum for deep narrow-band Ly imaging with the FORS2 camera on the VLT. We selected three radio galaxies at (including the target of our pilot project MRC 1138–262), two at , two at , one at and one at .
To search for Ly emitting galaxies at the redshift of the radio galaxies, we obtained deep narrow-band Ly and broad-band images with the VLT and the Keck telescope of the fields surrounding the radio galaxies. The size of the images was roughly 6868, which corresponds at a redshift of 3 to a proper size of 3.13.1 Mpc2. The (typical) sensitivity reached in the imaging is a Ly luminosity of erg s-1 for an emitter with no continuum detected at the level in the narrow-band image. An exception is the field of BRL 1602–174 at , the lowest redshift radio galaxy in our program. Due to the high galactic extinction towards this radio source and the low quantum efficiency of the FORS2 detector at the wavelengths below 4000 Å, the imaging of this field was significant shallower than of the other fields and therefore only two candidate emitters were detected. No follow-up spectroscopy was conducted in this field. Using the narrow-band and broad-band images we found 300 candidate Ly emitters with a rest-frame equivalent width of EW Å and a significance EWEW.
To confirm whether these candidate emitters have redshifts similar to that of the radio galaxies, we conducted follow-up spectroscopy with the VLT and Keck. Candidate emitters were confirmed to be Ly emitters based on an observed (asymmetric) line profile, emission line ratios and/or continuum break. Of the 152 candidate Ly emitters observed spectroscopically, 139 (%) were confirmed to be Ly emitters, four (%) were low redshift interlopers and nine (6%) did not show a line (or continuum) in their spectra, which is most likely due to a lack of signal-to-noise. Furthermore, 14 sources that were not selected as emitters were also confirmed to be high redshift Ly emitters. Combined with the 15 emitters found near MRC 1138–262, the total number of confirmed Ly emitters is 168 in eight radio galaxies fields. We will describe the properties of these Ly emitters in a forthcoming paper (Venemans et al. in prep).
Six of the fields are overdense in Ly emitters by a factor of 3–5 as compared to the volume density of (field) Ly emitters at similar redshifts. The remaining two radio galaxy fields have volume densities that are within the errors consistent with the field density. The significance of the volume overdensity near our highest redshift radio galaxy, at , is only marginal due to the low number (six) of confirmed emitters. Recently, an overdensity of LBGs was found in this field using multi-color HST observations. This strengthens our hypothesis that the radio galaxy is located in an overdense region.
The confirmed emitters show clustering in redshift space, and the width of the redshift distribution of the confirmed emitters is a factor 2–5 smaller than the width of the narrow-band filters. Taken together with the volume overdensity of Ly emitters, we argue that six of the radio galaxies reside in a forming cluster of galaxies or protocluster. We estimate that of all powerful high redshift radio galaxies at least 6/8 = 75% are located in a protocluster, making our program very efficient in finding high redshift forming clusters.
The size of the protoclusters is, based on the distribution of Ly emitters, at least 1.75 Mpc. This is consistent with the size measurements by other groups. The mass of the protoclusters can be calculated assuming the galaxies in the protoclusters are just breaking away from the Hubble flow and that the mass inside the volume occupied by the protocluster galaxies will collapse into a single structure. This method yields masses in the range M☉, suggesting that the protoclusters are the progenitors of clusters with Abell richness class 0 or higher. The results of our program allows us to follow the evolution of the velocity dispersion of the Ly emitters in the overdense regions as a function of redshift. Although based on only a small number of data points, we find that the velocity dispersion increases with decreasing redshift, in agreement with the predictions of numerical simulations of forming clusters. In a future paper, we will present a more detailed comparison of our observations with numerical simulations of forming massive clusters (Venemans et al. in prep).
Based on the results of our program and the density of luminous radio sources at and assuming that radio galaxies at high redshift are visible only for yr, we estimate that the number density of protoclusters at is Mpc-3. Locally, objects that have such number densities are clusters of galaxies with masses in excess of M☉. This further supports the idea that the protoclusters are the progenitors of (rich) clusters of galaxies. Using the protoclusters presented in this paper, we are now able to systematically study the evolution of clusters and their galaxies out to redshifts .
Acknowledgements.
We are grateful to the staff of Paranal, Chile, for their excellent support. We thank Gero Rupprecht at ESO and William Grenier of Andover Corporation for their help in our purchase of the custom narrow-band filters. BPV thanks Michiel Reuland, Hyron Spinrad, Steve Dawson and Curtis Manning for useful discussions, and Philip Best for carefully reading an early draft of this manuscript. GKM acknowledges funding by an Academy Professorship of the Royal Netherlands Academy of Arts and Sciences (KNAW). The work by WvB, SC and SAS at LLNL was performed under the auspices of the U.S. Department of Energy, National Nuclear Security Administration, by the University of California, Lawrence Livermore National Laboratory, under contract No. W-7405-Eng-48. The authors wish to recognize and acknowledge the very significant cultural role and reverence that the summit of Mauna Kea has always had within the indigenous Hawaiian community. We are most fortunate to have the opportunity to conduct observations from this mountain. This research has made use of the NASA/IPAC Extragalactic Database (NED) which is operated by the Jet Propulsion Laboratory, California Institute of Technology, under contract with the National Aeronautics and Space Administration. This work was supported by the European Community Research and Training Network “The physics of the Intergalactic Medium”. SC and WvB acknowledge support for radio galaxy studies at UC Merced, including the work reported here, with the Hubble, Spitzer and Chandra space telescopes via NASA grants HST 10127, SST 3482, SST 3329 and CXO 06701011.References
- Appenzeller & Rupprecht (1992) Appenzeller, I. & Rupprecht, G. 1992, The Messenger, 67, 18
- Archibald et al. (2001) Archibald, E. N., Dunlop, J. S., Hughes, D. H., et al. 2001, MNRAS, 323, 417
- Athreya et al. (1998) Athreya, R. M., Kapahi, V. K., McCarthy, P. J., & van Breugel, W. J. M. 1998, A&A, 329, 809
- Bahcall & Cen (1993) Bahcall, N. A. & Cen, R. 1993, ApJ, 407, L49
- Bahcall & Fan (1998) Bahcall, N. A. & Fan, X. 1998, ApJ, 504, 1
- Bahcall et al. (1997) Bahcall, N. A., Fan, X., & Cen, R. 1997, ApJ, 485, L53
- Baldwin & Stone (1984) Baldwin, J. A. & Stone, R. P. S. 1984, MNRAS, 206, 241
- Barr et al. (2004) Barr, J. M., Baker, J. C., Bremer, M. N., Hunstead, R. W., & Bland-Hawthorn, J. 2004, AJ, 128, 2660
- Beers et al. (1990) Beers, T. C., Flynn, K., & Gebhardt, K. 1990, AJ, 100, 32
- Bertin & Arnouts (1996) Bertin, E. & Arnouts, S. 1996, A&AS, 117, 393
- Bessell (1979) Bessell, M. S. 1979, PASP, 91, 589
- Best (2000) Best, P. N. 2000, MNRAS, 317, 720
- Best et al. (1999) Best, P. N., Röttgering, H. J. A., & Lehnert, M. D. 1999, MNRAS, 310, 223
- Best et al. (2003) Best, P. N., Lehnert, M. D., Miley, G. K., & Röttgering, H. J. A. 2003, MNRAS, 343, 1
- Blakeslee et al. (2003) Blakeslee, J. P., Franx, M., Postman, M., et al. 2003, ApJ, 596, L143
- Blundell & Rawlings (1999) Blundell, K. M. & Rawlings, S. 1999, Nature, 399, 330
- Bornancini et al. (2006) Bornancini, C. G., Lambas, D. G., & De Breuck, C. 2006, MNRAS, 366, 1067
- Carilli et al. (1997) Carilli, C. L., Röttgering, H. J. A., van Ojik, R., Miley, G. K., & van Breugel, W. J. M. 1997, ApJS, 109, 1
- Carilli et al. (2001) Carilli, C. L., Miley, G., Röttgering, H. J. A., et al. 2001, in Astronomical Society of the Pacific Conference Series, 101
- Carlstrom et al. (2002) Carlstrom, J. E., Holder, G. P., & Reese, E. D. 2002, ARA&A, 40, 643
- Ciardullo et al. (2002) Ciardullo, R., Feldmeier, J. J., Krelove, K., Jacoby, G. H., & Gronwall, C. 2002, ApJ, 566, 784
- Cooke et al. (2005) Cooke, J., Wolfe, A. M., Prochaska, J. X., & Gawiser, E. 2005, ApJ, 621, 596
- Croft et al. (2005) Croft, S., Kurk, J., van Breugel, W., et al. 2005, AJ, 130, 867
- Dawson et al. (2004) Dawson, S., Rhoads, J. E., Malhotra, S., et al. 2004, ApJ, 617, 707
- De Breuck et al. (1999) De Breuck, C., van Breugel, W. J. M., Minniti, D., et al. 1999, A&A, 352, L51
- De Breuck et al. (2000) De Breuck, C., van Breugel, W., Röttgering, H. J. A., & Miley, G. 2000, A&AS, 143, 303
- De Breuck et al. (2001) De Breuck, C., van Breugel, W. J. M., Röttgering, H., et al. 2001, AJ, 121, 1241
- De Breuck et al. (2002) De Breuck, C., van Breugel, W. J. M., Stanford, S. A., et al. 2002, AJ, 123, 637
- De Breuck et al. (2003a) De Breuck, C., Neri, R., Morganti, R., et al. 2003a, A&A, 401, 911
- De Breuck et al. (2003b) De Breuck, C., Neri, R., & Omont, A. 2003b, New Astronomy Review, 47, 285
- De Breuck et al. (2004) De Breuck, C., Bertoldi, F., Carilli, C., et al. 2004, A&A, 424, 1
- Deutsch (1999) Deutsch, E. W. 1999, AJ, 118, 1882
- Dey et al. (1997) Dey, A., van Breugel, W. J. M., Vacca, W. D., & Antonucci, R. 1997, ApJ, 490, 698
- Dunlop & Peacock (1990) Dunlop, J. S. & Peacock, J. A. 1990, MNRAS, 247, 19
- Eggen et al. (1962) Eggen, O. J., Lynden-Bell, D., & Sandage, A. R. 1962, ApJ, 136, 748
- Eke et al. (1996) Eke, V. R., Cole, S., & Frenk, C. S. 1996, MNRAS, 282, 263
- Eke et al. (1998) Eke, V. R., Navarro, J. F., & Frenk, C. S. 1998, ApJ, 503, 569
- Ellis et al. (1997) Ellis, R. S., Smail, I., Dressler, A., et al. 1997, ApJ, 483, 582
- Ettori et al. (2003) Ettori, S., Tozzi, P., & Rosati, P. 2003, A&A, 398, 879
- Fynbo et al. (2001) Fynbo, J. P. U., Møller, P., & Thomsen, B. 2001, A&A, 374, 443
- Fynbo et al. (2003) Fynbo, J. P. U., Ledoux, C., Møller, P., Thomsen, B., & Burud, I. 2003, A&A, 407, 147
- Gehrels (1986) Gehrels, N. 1986, ApJ, 303, 336
- Girardi et al. (1998) Girardi, M., Borgani, S., Giuricin, G., Mardirossian, F., & Mezzetti, M. 1998, ApJ, 506, 45
- Gladders (2002) Gladders, M. D. 2002, Ph.D. Thesis
- Goto (2005) Goto, T. 2005, MNRAS, 356, L6
- Hall et al. (2001) Hall, P. B., Sawicki, M., Martini, P., et al. 2001, AJ, 121, 1840
- Hammer et al. (1997) Hammer, F., Flores, H., Lilly, S. J., et al. 1997, ApJ, 481, 49
- Hashimoto et al. (2004) Hashimoto, Y., Barcons, X., Böhringer, H., et al. 2004, A&A, 417, 819
- Hayashino et al. (2004) Hayashino, T., Matsuda, Y., Tamura, H., et al. 2004, AJ, 128, 2073
- Holden et al. (2005) Holden, B. P., van der Wel, A., Franx, M., et al. 2005, ApJ, 620, L83
- Hu et al. (2004) Hu, E. M., Cowie, L. L., Capak, P., et al. 2004, AJ, 127, 563
- Jarvis et al. (2001) Jarvis, M. J., Rawlings, S., Eales, S., et al. 2001, MNRAS, 326, 1585
- Jarvis et al. (2003) Jarvis, M. J., Wilman, R. J., Röttgering, H. J. A., & Binette, L. 2003, MNRAS, 338, 263
- Kapahi et al. (1998) Kapahi, V. K., Athreya, R. M., van Breugel, W., McCarthy, P. J., & Subrahmanya, C. R. 1998, ApJS, 118, 275
- Keel et al. (1999) Keel, W. C., Cohen, S. H., Windhorst, R. A., & Waddington, I. 1999, AJ, 118, 2547
- Kodaira et al. (2003) Kodaira, K., Taniguchi, Y., Kashikawa, N., et al. 2003, PASJ, 55, L17
- Kurk et al. (2000) Kurk, J. D., Röttgering, H. J. A., Pentericci, L., et al. 2000, A&A, 358, L1
- Kurk et al. (2004a) Kurk, J. D., Pentericci, L., Overzier, R. A., Röttgering, H. J. A., & Miley, G. K. 2004a, A&A, 428, 817
- Kurk et al. (2004b) Kurk, J. D., Pentericci, L., Röttgering, H. J. A., & Miley, G. K. 2004b, A&A, 428, 793
- Landolt (1992) Landolt, A. U. 1992, AJ, 104, 340
- Larson (1974) Larson, R. B. 1974, MNRAS, 166, 585
- Large et al. (1981) Large, M. I., Mills, B. Y., Little, A. G., Crawford, D. F., & Sutton, J. M. 1981, MNRAS, 194, 693
- Le Fèvre et al. (1996) Le Fèvre, O., Deltorn, J. M., Crampton, D., & Dickinson, M. 1996, ApJ, 471, L11
- Ma & Feissel (1998) Ma, C. & Feissel, M. 1998, VizieR Online Data Catalog, 1251, 0
- Madau (1995) Madau, P. 1995, ApJ, 441, 18
- Maughan et al. (2004) Maughan, B. J., Jones, L. R., Ebeling, H., & Scharf, C. 2004, MNRAS, 351, 1193
- McCarthy (1993) McCarthy, P. J. 1993, ARA&A, 31, 639
- McCarthy et al. (1990) McCarthy, P. J., Kapahi, V. K., van Breugel, W. J. M., & Subrahmanya, C. R. 1990, AJ, 100, 1014
- McCarthy et al. (1996) McCarthy, P. J., Kapahi, V. K., van Breugel, W., et al. 1996, ApJS, 107, 19
- McCarthy et al. (1998) McCarthy, J. K., Cohen, J. G., Butcher, B., et al. 1998, in Proc. SPIE Vol. 3355, p. 81-92, Optical Astronomical Instrumentation, Sandro D’Odorico; Ed., 81
- Miles et al. (2004) Miles, T. A., Raychaudhury, S., Forbes, D. A., et al. 2004, MNRAS, 355, 785
- Miley et al. (2004) Miley, G. K., Overzier, R. A., Tsvetanov, Z. I., et al. 2004, Nature, 427, 47
- Monaco et al. (2005) Monaco, P., Moller, P., Fynbo, J., et al. 2005, A&A, 440, 799
- Monet (1998) Monet, D. G. 1998, Bulletin of the American Astronomical Society, 30, 1427
- Monet et al. (1998) Monet, D. B. A., Canzian, B., Dahn, C., et al. 1998, VizieR Online Data Catalog, 1252, 0
- Mullis et al. (2005) Mullis, C. R., Rosati, P., Lamer, G., et al. 2005, ApJ, 623, L85
- Nakata et al. (2001) Nakata, F., Kajisawa, M., Yamada, T., et al. 2001, PASJ, 53, 1139
- Nakata et al. (2005) Nakata, F., Bower, R. G., Balogh, M. L., & Wilman, D. J. 2005, MNRAS, 357, 679
- Norman et al. (2002) Norman, C., Hasinger, G., Giacconi, R., et al. 2002, ApJ, 571, 218
- Oke (1974) Oke, J. B. 1974, ApJS, 27, 21
- Oke (1990) —. 1990, AJ, 99, 1621
- Oke et al. (1995) Oke, J. B., Cohen, J. G., Carr, M., et al. 1995, PASP, 107, 375
- Ouchi et al. (2003) Ouchi, M., Shimasaku, K., Furusawa, H., et al. 2003, ApJ, 582, 60
- Ouchi et al. (2005) Ouchi, M., Shimasaku, K., Akiyama, M., et al. 2005, ApJ, 620, L1
- Overzier et al. (2006a) Overzier, R. A., Bouwens, R. J., Cross, N. J. G., et al. 2006a, ApJ submitted (astro-ph/0601223)
- Overzier et al. (2006b) Overzier, R. A., Zirm, A. W., Miley, G. K., et al. 2006b, ApJ, 637, 58
- Papadopoulos et al. (2000) Papadopoulos, P. P., Röttgering, H. J. A., van der Werf, P. P., et al. 2000, ApJ, 528, 626
- Pascarelle et al. (1996) Pascarelle, S. M., Windhorst, R. A., Driver, S. P., Ostrander, E. J., & Keel, W. C. 1996, ApJ, 456, L21
- Pentericci et al. (1997) Pentericci, L., Röttgering, H. J. A., Miley, G. K., Carilli, C. L., & McCarthy, P. 1997, A&A, 326, 580
- Pentericci et al. (1998) Pentericci, L., Röttgering, H. J. A., Miley, G. K., et al. 1998, ApJ, 504, 139
- Pentericci et al. (1999) Pentericci, L., Röttgering, H. J. A., Miley, G. K., et al. 1999, A&A, 341, 329
- Pentericci et al. (2000a) Pentericci, L., Kurk, J. D., Röttgering, H. J. A., et al. 2000a, A&A, 361, L25
- Pentericci et al. (2000b) Pentericci, L., Van Reeven, W., Carilli, C. L., Röttgering, H. J. A., & Miley, G. K. 2000b, A&AS, 145, 121
- Pentericci et al. (2001) Pentericci, L., McCarthy, P. J., Röttgering, H. J. A., et al. 2001, ApJS, 135, 63
- Pentericci et al. (2002) Pentericci, L., Kurk, J. D., Carilli, C. L., et al. 2002, A&A, 396, 109
- Reiprich & Böhringer (2002) Reiprich, T. H. & Böhringer, H. 2002, ApJ, 567, 716
- Reuland et al. (2003) Reuland, M., van Breugel, W. J. M., Röttgering, H. J. A., et al. 2003, ApJ, 592, 755
- Reuland et al. (2004) Reuland, M., Röttgering, H., van Breugel, W., & De Breuck, C. 2004, MNRAS, 353, 377
- Rhoads et al. (2000) Rhoads, J. E., Malhotra, S., Dey, A., et al. 2000, ApJ, 545, L85
- Rhoads et al. (2003) Rhoads, J. E., Dey, A., Malhotra, S., et al. 2003, AJ, 125, 1006
- Rhoads et al. (2004) Rhoads, J. E., Xu, C., Dawson, S., et al. 2004, ApJ, 611, 59
- Rosati et al. (2004) Rosati, P., Tozzi, P., Ettori, S., et al. 2004, AJ, 127, 230
- Röttgering et al. (1995) Röttgering, H. J. A., Hunstead, R. W., Miley, G. K., van Ojik, R., & Wieringa, M. H. 1995, MNRAS, 277, 389
- Röttgering et al. (1997) Röttgering, H. J. A., van Ojik, R., Miley, G. K., et al. 1997, A&A, 326, 505
- Röttgering et al. (1996) Röttgering, H. J. A., West, M. J., Miley, G. K., & Chambers, K. C. 1996, A&A, 307, 376
- Sánchez & González-Serrano (1999) Sánchez, S. F. & González-Serrano, J. I. 1999, A&A, 352, 383
- Sánchez & González-Serrano (2002) —. 2002, A&A, 396, 773
- Schlegel et al. (1998) Schlegel, D. J., Finkbeiner, D. P., & Davis, M. 1998, ApJ, 500, 525
- Shimasaku et al. (2003) Shimasaku, K., Ouchi, M., Okamura, S., et al. 2003, ApJ, 586, L111
- Shimasaku et al. (2004) Shimasaku, K., Hayashino, T., Matsuda, Y., et al. 2004, ApJ, 605, L93
- Smith et al. (2002) Smith, J. A., Tucker, D. L., Kent, S., et al. 2002, AJ, 123, 2121
- Somerville et al. (2004) Somerville, R. S., Lee, K., Ferguson, H. C., et al. 2004, ApJ, 600, L171
- Stanford et al. (1998) Stanford, S. A., Eisenhardt, P. R., & Dickinson, M. 1998, ApJ, 492, 461
- Steidel et al. (1998) Steidel, C. C., Adelberger, K. L., Dickinson, M., et al. 1998, ApJ, 492, 428
- Steidel et al. (2004) Steidel, C. C., Shapley, A. E., Pettini, M., et al. 2004, ApJ, 604, 534
- Steidel et al. (2005) Steidel, C. C., Adelberger, K. L., Shapley, A. E., et al. 2005, ApJ, 626, 44
- Stern et al. (2000) Stern, D., Bunker, A., Spinrad, H., & Dey, A. 2000, ApJ, 537, 73
- Stevens et al. (2003) Stevens, J. A., Ivison, R. J., Dunlop, J. S., et al. 2003, Nature, 425, 264
- Stiavelli et al. (2001) Stiavelli, M., Scarlata, C., Panagia, N., et al. 2001, ApJ, 561, L37
- Stone & Baldwin (1983) Stone, R. P. S. & Baldwin, J. A. 1983, MNRAS, 204, 347
- Tanaka et al. (2004) Tanaka, M., Goto, T., Okamura, S., Shimasaku, K., & Brinkmann, J. 2004, AJ, 128, 2677
- Tapken et al. (2004) Tapken, C., Appenzeller, I., Mehlert, D., Noll, S., & Richling, S. 2004, A&A, 416, L1
- Terlevich et al. (1991) Terlevich, R., Melnick, J., Masegosa, J., Moles, M., & Copetti, M. V. F. 1991, A&AS, 91, 285
- Tozzi et al. (2003) Tozzi, P., Rosati, P., Ettori, S., et al. 2003, ApJ, 593, 705
- Tran et al. (2005) Tran, K. H., van Dokkum, P., Illingworth, G. D., et al. 2005, ApJ, 619, 134
- van Breugel et al. (1999) van Breugel, W., De Breuck, C., Stanford, S. A., et al. 1999, ApJ, 518, L61
- van Dokkum & Stanford (2003) van Dokkum, P. G. & Stanford, S. A. 2003, ApJ, 585, 78
- van Ojik et al. (1996) van Ojik, R., Röttgering, H. J. A., Carilli, C. L., Miley, G. K., Bremer, M. N., & Macchetto, F. 1996, A&A, 313, 25
- van Zee et al. (2004) van Zee, L., Barton, E. J., & Skillman, E. D. 2004, AJ, 128, 2797
- Venemans et al. (2002) Venemans, B. P., Kurk, J. D., Miley, G. K., et al. 2002, ApJ, 569, L11
- Venemans et al. (2004) Venemans, B. P., Röttgering, H. J. A., Overzier, R. A., et al. 2004, A&A, 424, L17
- Venemans et al. (2005) Venemans, B. P., Röttgering, H. J. A., Miley, G. K., et al. 2005, A&A, 431, 793
- Villar-Martín et al. (2003) Villar-Martín, M., Vernet, J., di Serego Alighieri, S., et al. 2003, MNRAS, 346, 273
- West (1994) West, M. J. 1994, MNRAS, 268, 79
- Willott et al. (2001) Willott, C. J., Rawlings, S., Blundell, K. M., Lacy, M., & Eales, S. A. 2001, MNRAS, 322, 536
- Wold et al. (2003) Wold, M., Armus, L., Neugebauer, G., Jarrett, T. H., & Lehnert, M. D. 2003, AJ, 126, 1776
- Zirm et al. (2003) Zirm, A. W., Dickinson, M., & Dey, A. 2003, ApJ, 585, 90
- Zirm et al. (2005) Zirm, A. W., Overzier, R. A., Miley, G. K., et al. 2005, ApJ, 630, 68
Appendix A Object lists
| Object | Position | Flux | EW0 | FWHM | ||
|---|---|---|---|---|---|---|
| erg s-1 cm-2 | Å | km s-1 | ||||
| 2048.LAE1 | 20 51 02.05 | 27 04 52.7 | 2.1058 0.0004 | (1.5 0.2) | 720 70 | |
| 2048.LAE2 | 20 51 07.53 | 27 04 46.1 | 2.0591 0.0005 | (1.1 0.1) | 1015 115 | |
| 2048.LAE3 | 20 51 13.26 | 27 00 57.8 | 2.0580 0.0005 | (1.5 0.8) | 415 | |
| 2048.RG | 20 51 03.45 | 27 03 04.1 | 2.0590 0.0004 | (2.9 0.3) | 1580 110 | |
| Object | Position | Flux | EW0 | FWHM | ||
|---|---|---|---|---|---|---|
| erg s-1 cm-2 | Å | km s-1 | ||||
| 0052.LAE1 | 00 54 14.83 | 23 51 27.4 | 2.8301 0.0010 | (4.8 0.5) | 104 | 1075 85 |
| 0052.LAE2 | 00 54 15.01 | 23 49 42.9 | 2.8655 0.0003 | (1.1 0.2) | 76 | 305 50 |
| 0052.LAE3 | 00 54 19.05 | 23 51 41.7 | 2.8359 0.0002 | (1.0 0.3) | 9 | 155 40 |
| 0052.LAE4 | 00 54 21.74 | 23 51 51.1 | 2.8691 0.0004 | (4.4 1.6) | 123 | 430 50 |
| 0052.LAE5 | 00 54 21.95 | 23 54 08.9 | 2.8666 0.0002 | (1.2 0.2) | 443 | 220 30 |
| 0052.LAE6 | 00 54 22.62 | 23 55 07.0 | 2.8489 0.0002 | (1.8 0.5) | 52 | 255 40 |
| 0052.LAE7 | 00 54 22.75 | 23 53 06.7 | 2.8599 0.0002 | (1.0 0.3) | 94 | 205 50 |
| 0052.LAE8 | 00 54 24.57 | 23 53 12.8 | 2.8449 0.0002 | (2.0 0.4) | 218 | 220 40 |
| 0052.LAE9 | 00 54 24.58 | 23 54 54.7 | 2.8636 0.0004 | (5.2 2.3) | 49 | 525 85 |
| 0052.LAE10 | 00 54 25.35 | 23 53 07.5 | 2.8628 0.0003 | (4.2 1.0) | 54 | 305 50 |
| 0052.LAE11 | 00 54 25.64 | 23 53 40.6 | 2.8448 0.0001 | (6.1 1.1) | 105 | 130 25 |
| 0052.LAE12 | 00 54 26.05 | 23 51 40.6 | 2.8656 0.0004 | (2.7 0.9) | 68 | 280 80 |
| 0052.LAE13 | 00 54 27.31 | 23 51 52.9 | 2.8651 0.0008 | (2.3 0.6) | 114 | 765 150 |
| 0052.LAE14 | 00 54 28.17 | 23 51 52.3 | 2.8444 0.0012 | (1.0 0.3) | 56 | 950 235 |
| 0052.LAE15 | 00 54 28.59 | 23 53 48.6 | 2.8550 0.0002 | (1.2 0.1) | 108 | 585 25 |
| 0052.LAE16 | 00 54 28.65 | 23 51.55.3 | 2.8479 0.0003 | (2.1 0.4) | 45 | 325 50 |
| 0052.LAE17 | 00 54 28.89 | 23 52 26.3 | 2.8673 0.0004 | (1.0 0.2) | 26 | 395 70 |
| 0052.LAE18 | 00 54 29.31 | 23 53 18.1 | 2.8669 0.0002 | (5.2 0.5) | 132 | 425 30 |
| 0052.LAE19 | 00 54 29.84 | 23 54 42.8 | 2.8618 0.0001 | (2.3 0.3) | 168 | 285 30 |
| 0052.LAE20 | 00 54 30.53 | 23 53 34.1 | 2.8592 0.0003 | (6.9 2.6) | 78 | 150 60 |
| 0052.LAE21 | 00 54 30.61 | 23 53 36.2 | 2.8600 0.0003 | (7.2 1.6) | 27 | 260 50 |
| 0052.LAE22 | 00 54 31.99 | 23 49 09.3 | 2.8503 0.0002 | (4.8 0.8) | 118 | 225 30 |
| 0052.LAE23 | 00 54 32.86 | 23 52 14.1 | 2.8660 0.0003 | (1.1 0.3) | 74 | 365 65 |
| 0052.LAE24 | 00 54 34.64 | 23 53 27.7 | 2.8460 0.0004 | (1.0 0.3) | 76 | 275 75 |
| 0052.LAE25 | 00 54 35.61 | 23 53 27.9 | 2.8441 0.0003 | (1.7 0.3) | 468 | 430 50 |
| 0052.LAE26 | 00 54 35.66 | 23 54 16.7 | 2.8602 0.0002 | (6.6 2.3) | 34 | 90 55 |
| 0052.LAE27 | 00 54 36.28 | 23 50 01.6 | 2.8437 0.0003 | (2.0 0.2) | 27 | 670 60 |
| 0052.LAE28 | 00 54 36.30 | 23 53 39.1 | 2.8451 0.0010 | (6.2 2.6) | 115 | 610 200 |
| 0052.LAE29 | 00 54 36.55 | 23 53 40.2 | 2.8447 0.0002 | (4.8 1.3) | 146 | 120 40 |
| 0052.LAE30 | 00 54 37.13 | 23 51 39.2 | 2.8647 0.0003 | (1.5 0.6) | 102 | 145 55 |
| 0052.LAE31 | 00 54 38.54 | 23 48 39.8 | 2.8647 0.0003 | (6.4 0.9) | 105 | 860 50 |
| 0052.LAE32 | 00 54 39.91 | 23 52 06.6 | 2.8311 0.0003 | (1.3 0.3) | 410 | 495 70 |
| 0052.LAE33 | 00 54 40.36 | 23 49 13.1 | 2.8499 0.0001 | (4.8 1.4) | 136 | 65 40 |
| 0052.LAE34 | 00 54 42.46 | 23 50 50.5 | 2.8663 0.0004 | (5.4 1.3) | 101 | 410 75 |
| 0052.LAE35 | 00 54 42.90 | 23 52 55.9 | 2.8756 0.0003 | (4.2 0.5) | 165 | 440 35 |
| 0052.LAE36 | 00 54 43.06 | 23 53 14.1 | 2.8764 0.0004 | (1.7 0.3) | 28 | 590 30 |
| 0052.LAE37 | 00 54 44.36 | 23 51 52.4 | 2.8619 0.0002 | (1.1 0.2) | 38 | 265 45 |
| 0052.RG | 00 54 29.83 | 23 51 31.1 | 2.8609 0.0011 | (1.11 0.09) | 133 | 2040 85 |
| Object | Position | Flux | EW0 | FWHM | ||
|---|---|---|---|---|---|---|
| erg s-1 cm-2 | Å | km s-1 | ||||
| 0943.LAE1 | 09 45 20.70 | 24 28 12.5 | 2.8970 0.0002 | (3.1 0.2) | 600 35 | |
| 0943.LAE2 | 09 45 21.99 | 24 29 55.1 | 2.9202 0.0001 | (2.2 0.2) | 290 25 | |
| 0943.LAE3 | 09 45 22.17 | 24 28 56.2 | 2.9259 0.0002 | (2.2 0.2) | 425 45 | |
| 0943.LAE4 | 09 45 23.77 | 24 28 48.0 | 2.9263 0.0007 | (6.7 1.0) | 555 75 | |
| 0943.LAE5 | 09 45 27.14 | 24 27 52.6 | 2.9167 0.0005 | (1.1 0.3) | 360 115 | |
| 0943.LAE6 | 09 45 29.09 | 24 26 49.7 | 2.9242 0.0003 | (1.3 0.2) | 225 75 | |
| 0943.LAE7 | 09 45 30.60 | 24 25 31.4 | 2.9265 0.0005 | (7.4 1.8) | 455 100 | |
| 0943.LAE8 | 09 45 30.66 | 24 28 06.2 | 2.9113 0.0002 | (4.7 0.4) | 455 35 | |
| 0943.LAE9 | 09 45 30.83 | 24 28 01.4 | 2.9214 0.0006 | (6.1 2.1) | 410 140 | |
| 0943.LAE10 | 09 45 31.13 | 24 27 34.4 | 2.9122 0.0006 | (1.0 0.2) | 440 65 | |
| 0943.LAE11 | 09 45 32.26 | 24 31 21.6 | 2.9259 0.0003 | (9.8 1.4) | 445 60 | |
| 0943.LAE12 | 09 45 32.68 | 24 29 46.5 | 2.9004 0.0003 | (2.1 0.2) | 625 30 | |
| 0943.LAE13 | 09 45 32.77 | 24 29 05.4 | 2.9189 0.0003 | (7.7 0.8) | 630 35 | |
| 0943.LAE14 | 09 45 32.86 | 24 31 06.9 | 2.9073 0.0000 | (4.1 0.1) | 180 10 | |
| 0943.LAE15 | 09 45 34.34 | 24 29 23.7 | 2.9094 0.0001 | (3.2 0.2) | 330 20 | |
| 0943.LAE16 | 09 45 34.96 | 24 30 46.9 | 2.9242 0.0002 | (1.7 0.2) | 275 50 | |
| 0943.LAE17 | 09 45 36.18 | 24 30 00.5 | 2.9174 0.0005 | (1.7 0.5) | 305 90 | |
| 0943.LAE18 | 09 45 36.36 | 24 29 56.4 | 2.9313 0.0002 | (5.4 0.3) | 695 35 | |
| 0943.LAE19 | 09 45 37.19 | 24 26 27.2 | 2.9081 0.0003 | (2.8 0.6) | 430 45 | |
| 0943.LAE20 | 09 45 37.52 | 24 25 23.7 | 2.9266 0.0005 | (5.1 0.6) | 720 60 | |
| 0943.LAE21 | 09 45 38.64 | 24 29 54.3 | 2.9159 0.0006 | (2.2 0.8) | 595 80 | |
| 0943.LAE22 | 09 45 38.71 | 24 29 57.5 | 2.9201 0.0003 | (1.6 0.2) | 510 55 | |
| 0943.LAE23 | 09 45 39.08 | 24 30 10.2 | 2.9189 0.0004 | (5.6 1.3) | 680 65 | |
| 0943.LAE24 | 09 45 39.17 | 24 29 20.1 | 2.9089 0.0002 | (2.1 0.2) | 515 40 | |
| 0943.LAE25 | 09 45 39.46 | 24 26 15.9 | 2.9037 0.0010 | (2.0 0.4) | 1185 195 | |
| 0943.LAE26 | 09 45 41.88 | 24 28 35.1 | 2.9309 0.0008 | (4.3 1.9) | 360 165 | |
| 0943.LAE27 | 09 45 42.61 | 24 28 57.9 | 2.9302 0.0001 | (2.1 0.2) | 285 25 | |
| 0943.LAE28 | 09 45 45.72 | 24 26 49.1 | 2.9233 0.0007 | (3.1 0.7) | 630 60 | |
| 0943.RG | 09 45 32.74 | 24 28 49.7 | 2.9209 0.0003 | (3.6 0.1) | 1755 20 | |
| Object | Position | Flux | EW0 | FWHM | ||
|---|---|---|---|---|---|---|
| erg s-1 cm-2 | Å | km s-1 | ||||
| 2009.LAE1 | 20 09 38.32 | 30 41 31.6 | 3.1528 0.0001 | (7.2 0.7) | 175 20 | |
| 2009.LAE2 | 20 09 39.89 | 30 40 50.7 | 3.1577 0.0007 | (2.6 0.8) | 530 135 | |
| 2009.LAE3 | 20 09 40.92 | 30 41 44.9 | 3.1548 0.0006 | (1.6 0.6) | 385 115 | |
| 2009.LAE4 | 20 09 41.06 | 30 42 46.4 | 3.1415 0.0005 | (1.9 0.7) | 320 95 | |
| 2009.LAE5 | 20 09 42.19 | 30 38 34.3 | 3.1601 0.0003 | (4.2 0.7) | 370 50 | |
| 2009.LAE6 | 20 09 47.83 | 30 42 39.6 | 3.1521 0.0004 | (1.4 0.2) | 720 75 | |
| 2009.LAE7 | 20 09 49.55 | 30 40 47.4 | 3.1531 0.0003 | (1.7 0.4) | 485 55 | |
| 2009.LAE8 | 20 09 54.43 | 30 41 19.7 | 3.1445 0.0006 | (1.4 0.4) | 505 120 | |
| 2009.LAE9 | 20 09 56.94 | 30 39 38.6 | 3.1412 0.0006 | (6.5 0.3) | 3170 50 | |
| 2009.LAE10 | 20 09 58.82 | 30 40 37.1 | 3.1454 0.0004 | (7.3 0.3) | 1565 25 | |
| 2009.LAE11 | 20 10 01.81 | 30 41 27.7 | 3.1581 0.0003 | (5.8 0.5) | 750 30 | |
| 2009.RG | 20 09 48.12 | 30 40 07.4 | 3.1497 0.0002 | (2.41 0.04) | 2300 25 | |
| Object | Position | Flux | EW0 | FWHM | ||
|---|---|---|---|---|---|---|
| erg s-1 cm-2 | Å | km s-1 | ||||
| 1338.LAE1 | 13 38 21.27 | 19 45 52.7 | 4.0977 0.0010 | (1.5 0.4) | 495 105 | |
| 1338.LAE2 | 13 38 21.32 | 19 44 42.5 | 4.1092 0.0003 | (8.1 2.2) | 255 | |
| 1338.LAE3 | 13 38 21.68 | 19 46 27.9 | 4.0978 0.0003 | (1.0 0.4) | 75 75 | |
| 1338.LAE4 | 13 38 22.47 | 19 44 33.8 | 4.0950 0.0002 | (2.7 0.3) | 230 40 | |
| 1338.LAE5 | 13 38 22.78 | 19 46 04.8 | 4.0976 0.0003 | (3.0 1.1) | 120 65 | |
| 1338.LAE6 | 13 38 23.65 | 19 45 51.7 | 4.0969 0.0003 | (2.2 0.7) | 95 55 | |
| 1338.LAE7 | 13 38 24.79 | 19 41 34.2 | 4.1055 0.0004 | (5.9 1.4) | 260 | |
| 1338.LAE8 | 13 38 24.87 | 19 41 46.0 | 4.1017 0.0007 | (9.2 2.9) | 270 140 | |
| 1338.LAE9 | 13 38 25.11 | 19 43 11.2 | 4.1004 0.0007 | (7.0 1.3) | 720 55 | |
| 1338.LAE10 | 13 38 25.32 | 19 45 55.9 | 4.0970 0.0002 | (1.6 0.3) | 420 90 | |
| 1338.LAE11 | 13 38 26.18 | 19 43 34.7 | 4.1010 0.0006 | (6.0 1.5) | 445 45 | |
| 1338.LAE12 | 13 38 26.20 | 19 46 28.5 | 4.0925 0.0005 | (9.0 1.7) | 460 55 | |
| 1338.LAE13 | 13 38 28.08 | 19 39 50.5 | 4.0877 0.0004 | (1.4 0.4) | 170 | |
| 1338.LAE14 | 13 38 28.73 | 19 44 37.2 | 4.1020 0.0002 | (4.5 0.6) | 200 | |
| 1338.LAE15 | 13 38 29.41 | 19 49 01.7 | 4.1010 0.0005 | (2.5 0.6) | 405 75 | |
| 1338.LAE16 | 13 38 29.68 | 19 44 00.0 | 4.1021 0.0003 | (4.6 1.2) | 165 | |
| 1338.LAE17 | 13 38 29.88 | 19 43 26.1 | 4.0927 0.0004 | (7.0 1.3) | 350 80 | |
| 1338.LAE18 | 13 38 30.16 | 19 40 38.3 | 4.1132 0.0005 | (1.6 0.4) | 275 105 | |
| 1338.LAE19 | 13 38 30.17 | 19 48 44.9 | 4.0872 0.0003 | (7.1 1.2) | 240 35 | |
| 1338.LAE20 | 13 38 32.85 | 19 44 07.2 | 4.0969 0.0003 | (7.6 1.8) | 170 | |
| 1338.LAE21 | 13 38 33.58 | 19 43 36.3 | 4.0965 0.0009 | (4.6 0.9) | 380 80 | |
| 1338.LAE22 | 13 38 34.15 | 19 42 53.4 | 4.0955 0.0009 | (2.6 0.8) | 505 150 | |
| 1338.LAE23 | 13 38 34.44 | 19 47 03.7 | 4.0983 0.0003 | (3.7 0.8) | 215 45 | |
| 1338.LAE24 | 13 38 34.69 | 19 43 43.2 | 4.0979 0.0002 | (3.3 0.6) | 135 30 | |
| 1338.LAE25 | 13 38 34.98 | 19 42 25.4 | 4.0925 0.0008 | (7.4 2.6) | 275 160 | |
| 1338.LAE26 | 13 38 35.10 | 19 45 07.8 | 4.0967 0.0005 | (5.4 2.3) | 150 | |
| 1338.LAE27 | 13 38 35.52 | 19 45 23.7 | 4.0999 0.0005 | (9.4 2.3) | 230 110 | |
| 1338.LAE28 | 13 38 35.67 | 19 45 50.1 | 4.0987 0.0003 | (3.1 0.7) | 395 70 | |
| 1338.LAE29 | 13 38 35.82 | 19 49 36.5 | 4.0975 0.0004 | (3.5 0.9) | 335 70 | |
| 1338.LAE30 | 13 38 37.15 | 19 45 02.0 | 4.0943 0.0003 | (6.0 1.0) | 440 35 | |
| 1338.LAE31 | 13 38 39.69 | 19 47 50.1 | 4.0948 0.0007 | (3.6 1.0) | 575 45 | |
| 1338.LAE32 | 13 38 41.10 | 19 43 01.7 | 4.0941 0.0007 | (2.3 0.2) | 2110 85 | |
| 1338.LAE33 | 13 38 41.11 | 19 44 22.4 | 4.1015 0.0005 | (1.9 0.6) | 235 75 | |
| 1338.LAE34 | 13 38 43.85 | 19 44 41.0 | 4.0978 0.0003 | (2.4 0.6) | 220 30 | |
| 1338.LAE35 | 13 38 44.65 | 19 47 09.4 | 4.1185 0.0002 | (3.2 0.3) | 300 40 | |
| 1338.LAE36 | 13 38 47.19 | 19 48 16.7 | 4.0979 0.0008 | (1.8 0.4) | 655 125 | |
| 1338.LAE37 | 13 38 50.12 | 19 46 12.2 | 4.0958 0.0004 | (1.2 0.4) | 165 55 | |
| 1338.RG | 13 38 26.06 | 19 42 30.8 | 4.1052 0.0006 | (4.4 0.2) | 1810 40 | |