The Evolution of Obscuration in Active Galactic Nuclei
Abstract
In order to study the evolution of the relative fraction of obscured Active Galactic Nuclei (AGN) we constructed the largest sample to date of AGN selected in hard X-rays. The full sample contains 2341 X-ray-selected AGN, roughly 4 times the largest previous samples studied in this connection. Of these, 1229 (53%) have optical counterparts for which redshifts are available; these span the redshift range =0-4. The observed fraction of obscured AGN declines only slightly with redshift. Correcting for selection bias, we find that the intrinsic fraction of obscured AGN must actually increase with redshift, as (1+)α, with 0.40.1. This evolution is consistent with the integrated X-ray background, which provides the strongest constraints at relatively low redshift, 1. Summing over all AGN, we estimate the bolometric AGN light to be 3.8 nW m-2 sr-1, or 8% of the total extragalactic light. Together with the observed black hole mass density in the local Universe, this implies an accretion efficiency of 0.1-0.2, consistent with the values typically assumed.
1 Introduction
It is now clear from the deepest Chandra and XMM observations (e.g., Giacconi et al., 2001; Brandt et al., 2001) that a combination of obscured and unobscured Active Galactic Nuclei (AGN) are needed to explain the observed properties of the extragalactic X-ray background (XRB). While unobscured AGN are readily detected using, for example, optical color-selection techniques, the optical-UV-soft X-ray signatures of nuclear activity are not visible in obscured AGN, making their detection and identification much harder. The effects of obscuration are less important at high energies, hence deep, hard X-ray (2–10 keV) surveys with Chandra and XMM have revealed a less biased view of the AGN population (e.g, Barger et al., 2003 and references therein), although they are still insensitive to the most obscured sources, like Compton-thick AGN (e.g., Worsley et al., 2005). However, these surveys rely mostly on optical spectroscopy to find redshifts and thus luminosities, hence they preferentially exclude obscured AGN, which have fainter optical counterparts (Treister et al., 2004 and references therein). This means the observed spectroscopically identified population is not representative of the underlying AGN population.
One fundamental ingredient in our understanding of the AGN population is the ratio of obscured to unobscured AGN, and whether this ratio depends on parameters like intrinsic luminosity or redshift. According to the unification paradigm (Antonucci, 1993; Urry & Padovani, 1995), the ratio depends on the geometry of the circumnuclear obscuring material. In the simplest version of unification, this ratio is independent of source properties like luminosity or redshift. However, there are physical reasons to expect a dependence; for example, more luminous accretion disk emission may correspond to a larger dust sublimation radius (Lawrence, 1991; Simpson, 2005), thus increasing the fraction of unobscured AGN at higher luminosities. Similarly, if the dust content of the AGN host galaxy is important for the obscuration of the central engine, a dependence of the obscured AGN fraction on redshift would be expected (e.g., Ballantyne et al., 2006 and references therein), given the evolution of the amount of dust in galaxies. Thus, a measurement of the fraction of obscured AGN and its possible dependence on critical parameters can be used to study AGN structure and to probe the connection between AGN activity and the formation of the host galaxy.
The XRB also constrains the fraction of obscured AGN. Early AGN population synthesis models for the XRB (e.g., Comastri et al., 1995; Gilli et al., 1999) required a strong increase of the fraction with redshift, while recent versions (e.g., Ueda et al., 2003; Treister & Urry, 2005) assume only a decrease with increasing luminosity, although Ballantyne et al. (2006) concluded that a evolving obscured AGN fraction provides a better fit. Deep X-ray surveys confirm that the obscured AGN fraction depends on luminosity (Ueda et al., 2003; Steffen et al., 2003), while the dependence on redshift is less clear. La Franca et al. (2005), using a larger heterogeneous sample and X-ray spectral fitting to classify AGN, concluded that the relative fraction of obscured AGN increases with redshift. However, although Akylas et al. (2006) found a similar evolution, they concluded from simulations that such a correlation can be induced by the K correction of the X-ray spectra.
In this work, we generate an AGN sample with high optical spectroscopic completeness, the largest such sample to date by a factor of 4, in order to study the evolution of the obscured AGN fraction. Using optical spectroscopy we characterize AGN as unobscured if they have broad emission lines, and we measure the dependence of the obscured fraction on redshift. Throughout this paper we assume km s -1 Mpc-1, and .
2 The Sample
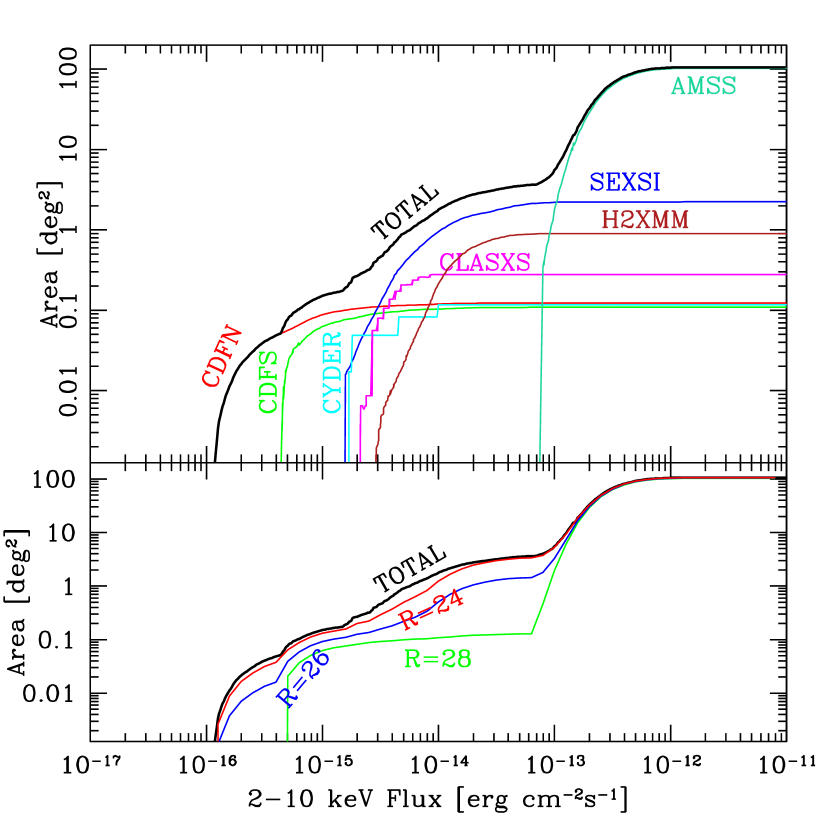
To distinguish between the effects of redshift and luminosity, our sample needs to probe a range of luminosities at each redshift over a reasonable a range of redshifts. Wide area, shallow X-ray surveys sample moderate luminosity AGN at low redshifts and only high luminosity sources up to high redshifts, while deep pencil-beam surveys are useful to study the moderate luminosity population at high redshifts, but only provide a small number of the more rare, high-luminosity sources. Combining the two covers the luminosity-redshift plane effectively (see Fig. 1). Here we combine seven wide and deep surveys, for a total sample of 2341 AGN selected in the hard X-ray band. (We define an AGN as an X-ray source more luminous than ergs/s.) Table 1 summarizes the surveys used in this work and their main characteristics. When necessary, hard X-ray fluxes in the 2–8 keV band were converted to the 2–10 keV range assuming a power-law spectrum of the form dN/dEE-Γ with =1.7, consistent with the average observed AGN spectrum (e.g., Nandra et al., 1997). The total area of this super-sample as a function of X-ray flux is shown in Fig. 1.
To classify the sample by optical spectroscopy requires high spectroscopic completeness; all the constituent surveys used here are at least 40% complete (most are much higher) and a total of 1229 sources (53% of our sample) have reliable redshifts. These are spectroscopic redshifts except in the Chandra Deep Field South, where the photometric classification by Zheng et al. (2004) was used when spectroscopic information was not available (i.e., for about half the 227 objects; the photometric redshifts include Combo-17 data and so are quite accurate). Sources were classified as unobscured AGN when broad emission lines were present in the optical spectrum (or using the optical/IR continuum shape for the CDF-S AGN with photometry only); the 631 sources (51%) without broad emission lines and with X-ray luminosities greater than 1042 erg s-1 were classified as obscured AGN. This is a more robust classification scheme than using X-ray-determined because there are no K correction effects, since lines are present in the optical spectrum at most redshifts (line dilution by the host galaxy is not important; (Barger et al., 2005).
For obvious reasons, the spectroscopic completeness of any survey depends on the brightness of the optical counterparts. To describe this effect quantitatively, we characterize the identified fraction of each constituent survey by a simple 3-parameter function that is constant at bright magnitudes and declines linearly to faint magnitudes. These 3 independent parameters (break and limiting magnitudes in the R band, and maximum completeness at bright fluxes) provide a very good description of the identified fraction in all 7 surveys, with values for the reduced lower than 0.5 in each case. The fitted parameters for each survey are given in Table 1. The effective area as a function of X-ray flux and optical magnitude was then calculated by weighting the area versus X-ray flux relation for each survey by its sensitivity (i.e., the fraction of identified AGN) at each optical magnitude, and summing the results. The total effective area for the super-sample is shown in Fig. 1.
With the selection function of the super-sample quantified, we can now interpret the observed demographics of X-ray sources. The observed fraction of obscured AGN as a function of redshift is shown (data points) in the upper panel of Fig. 2. This fraction remains almost constant at a value of 0.6-0.7 up to =1.5 and drops to 0.2-0.3 at higher redshifts. A much steeper decline is expected because the measured redshifts require an optical spectrum. For obscured AGN the optical emission is dominated by the host galaxy, which can be studied spectroscopically up to 1 but then becomes too faint for even 8m-class telescopes, hence the decline at high redshift (Treister et al., 2004).
To account quantitatively for this selection effect, we calculate the ratio one should observe for an intrinsically non-evolving population, taking into account the effects of the sensitivity and completeness of each survey. This was done using the AGN population synthesis model of Treister et al. (2004) as modified by Treister & Urry (2005). This model explains at the same time the X-ray, optical and infrared number counts of AGN in the Great Observatories Origins Deep Survey (Treister et al., 2004, 2006a) and the spectral shape and intensity of the extragalactic XRB (Treister & Urry, 2005). In practice, most of the model parameters are irrelevant to the present calculation, as it depends mainly on the host galaxy luminosity and evolution. We assumed an luminosity and a Sc-like evolution as given by Poggianti (1997). (We checked that the results do not depend significantly on the type of host-galaxy evolution assumed.) We also assume a local ratio of obscured to unobscured AGN of 3:1, in agreement with observations (e.g., Risaliti et al., 1999), and this ratio was assumed to decline with increasing luminosity but to remain constant with redshift. The expected fraction of obscured AGN as a function of redshift for the observational parameters of our super-sample declines sharply above (line, upper panel, Fig. 2), mainly because of spectroscopic incompleteness.
3 Results and Discussion
The observed fraction of obscured AGN at high redshift is higher than expected if the intrinsic fraction does not evolve. In the bottom panel of Fig. 2 we show the obscured AGN fraction relative to the expected value. Clearly, it increases significantly with redshift, roughly as (1+)α, with =0.3-0.5 (thin dashed lines, bottom panel, Fig. 2; best fit, 0.4, thick dashed line). This value of does not change significantly if a different host galaxy evolution is assumed, and it is consistent with the value of 0.3 reported by Ballantyne et al. (2006). Similar evolution was found by La Franca et al. (2005) and Akylas et al. (2006), based on a much smaller sample, but we classify AGN via optical spectroscopy rather than X-ray spectral fitting and so avoid their K-correction bias.
The XRB also constrains the relative fraction of obscured AGN and its evolution. The strongest constraints come from 1–10 keV, since at high energies the effects of obscuration are less important, and fortunately, the spectrum of the XRB in this energy range has been well measured. Based on XMM observations, De Luca & Molendi (2004) reported an integrated XRB flux in the 2–10 keV band of 2.240.1610-11 erg cm-2 s-1. Integrating our AGN population synthesis model gives, for =0 (i.e., a non-evolving obscured AGN fraction), 2.310-11 erg cm-2 s-1. Incorporating the evolution with redshift, we obtain 2.1, 2.04, and 2.00 10-11 erg cm-2 s-1 for =0.3, 0.4, and 0.5, respectively. (Larger values of imply a lower integrated flux at low energies because of a higher relative fraction of obscured AGN, in which most of the soft X-ray emission is absorbed.)
Similarly, using observations, Hickox & Markevitch (2006) report an integrated flux value of 1.70.210-11 erg cm-2 s-1 for the 2–8 keV band. In comparison, for =0 we find 1.810-11 erg cm-2 s-1 in the 2–8 keV band, and 1.7, 1.6, and 10-11 erg cm-2 s-1 for =0.3, 0.4, and 0.5, respectively. We conclude that the XRB favors 0.3, in good agreement with the value found from the observed fraction.
Since forming galaxies may be expected to have more dust, the increase in the relative fraction of obscured AGN at high redshift may be due to an increase in the contribution to obscuration by galactic dust. Combining hard X-ray and mid-infrared observations, Lutz et al. (2004) found a similar ratio of hard X-ray to mid-infrared flux for obscured and unobscured AGN, contrary to the predictions of the simplest AGN unification paradigm, in which the obscuration comes from the dusty torus and therefore the mid-infrared emission is reduced due to self-absorption. This result can be explained if the obscuration comes from a much more extended region, i.e., kiloparsec, galactic scales rather than a compact parsec-scale torus. Furthermore, signatures for extended absorbing regions have been detected in nearby galaxies like NGC 1068 (e.g., Bock et al., 1998) and NGC 4151 (Radomski et al., 2003). Heavy absorption at kpc-scales has routinely been found in ultra-luminous infrared galaxies (ULIRGs), which suffer a very strong evolution (e.g., Saunders et al., 1990). Hence, it seems likely that the change in the relative fraction of obscured AGN could be related to galactic-scale absorption, in particular since some ULIRGs also contain an obscured AGN (e.g., Arp 220; Iwasawa et al., 2005).
The contribution of AGN to the bolometric energy budget of the Universe is a matter of debate. While it is now clear that AGN are the major contributor in X-rays, they only constitute 5-10%, depending on wavelength, of the total infrared emission (e.g., Treister et al., 2006a). Here we calculate the total light from AGN integrated across all wavelengths; bolometric corrections to the 2–10 keV luminosity are derived from the AGN spectral energy distributions of Treister et al. (2004), as described by Treister et al. (2006b). This leads to luminosity-dependent corrections that range from 25 for low-luminosity AGN to 100 for quasars, in good agreement with observations (e.g., Kuraszkiewicz et al., 2003; Barger et al., 2005). Integrating over the full AGN population, the total bolometric light from AGN is 3.8 nW m-2 sr-1. This value is independent of the obscured AGN fraction, since we are calculating the total AGN output, regardless of processes of absorption and re-emission at different wavelengths and depends only on the AGN luminosity function.
Observations of the extragalactic background light integrated over all wavelengths yielded a value of 5520 nW m-2 sr-1 (Madau & Pozzetti, 2000), while Hauser & Dwek (2001) found values in the range 45–170 nW m-2 sr-1. Hence, the contribution of AGN to the total extragalactic light is at most 8%. This contribution can be larger by 2 if a large number of Compton-thick AGN are missed by current X-ray surveys; however, this is unlikely based on hard X-ray observations with INTEGRAL and Swift (Treister et al., 2006b; Markwardt et al., 2005).
According to the Soltan argument (Soltan, 1982), AGN luminosity traces the accretion of mass onto the central black hole. The conversion factor between the emitted luminosity and the accreted mass is the efficiency, . Using our estimate of the integrated AGN luminosity together with the observed local black hole mass density, =4.6105 M☉Mpc-3 (Marconi et al., 2004), we find =0.11. If instead we use the observed value of =2.90.46 105M☉Mpc-3 reported by Yu & Tremaine (2002), we get =0.170.02. The derived accretion efficiency is thus comparable to the typically assumed value, 0.1.
In summary, the fraction of obscured AGN increases with redshift, following an evolution of the form (1+)0.3-0.4. This evolution could be related to an increase in the dust content of host galaxies at earlier epochs. The AGN contribution to the total extragalactic light is small, 8%. Combining this estimate with the observed local black hole mass density, we find an average radiative efficiency of 0.1-0.2.
References
- Akiyama et al. (2003) Akiyama, M., Ueda, Y., Ohta, K., Takahashi, T., & Yamada, T. 2003, ApJS, 148, 275
- Akylas et al. (2006) Akylas, A., Georgantopoulos, I., Georgakakis, A., Kitsionas, S., & Hatziminaoglou, E. 2006, ArXiv Astrophysics e-prints
- Antonucci (1993) Antonucci, R. 1993, ARA&A, 31, 473
- Ballantyne et al. (2006) Ballantyne, D. R., Everett, J. E., & Murray, N. 2006, ApJ, 639, 740
- Barger et al. (2003) Barger, A. J., Cowie, L. L., Capak, P., Alexander, D. M., Bauer, F. E., Fernandez, E., Brandt, W. N., Garmire, G. P., & Hornschemeier, A. E. 2003, AJ, 126, 632
- Barger et al. (2005) Barger, A. J., Cowie, L. L., Mushotzky, R. F., Yang, Y., Wang, W.-H., Steffen, A. T., & Capak, P. 2005, AJ, 129, 578
- Bock et al. (1998) Bock, J. J., Marsh, K. A., Ressler, M. E., & Werner, M. W. 1998, ApJ, 504, L5+
- Brandt et al. (2001) Brandt, W. N. et al. 2001, AJ, 122, 2810
- Comastri et al. (1995) Comastri, A., Setti, G., Zamorani, G., & Hasinger, G. 1995, A&A, 296, 1
- De Luca & Molendi (2004) De Luca, A. & Molendi, S. 2004, A&A, 419, 837
- Eckart et al. (2006) Eckart, M. E., Stern, D., Helfand, D. J., Harrison, F. A., Mao, P. H., & Yost, S. A. 2006, ArXiv Astrophysics e-prints
- Fiore et al. (2003) Fiore, F. et al. 2003, A&A, 409, 79
- Giacconi et al. (2001) Giacconi, R. et al. 2001, ApJ, 551, 624
- Gilli et al. (1999) Gilli, R., Risaliti, G., & Salvati, M. 1999, A&A, 347, 424
- Hauser & Dwek (2001) Hauser, M. G. & Dwek, E. 2001, ARA&A, 39, 249
- Hickox & Markevitch (2006) Hickox, R. C. & Markevitch, M. 2006, ApJ, 645, 95
- Iwasawa et al. (2005) Iwasawa, K., Sanders, D. B., Evans, A. S., Trentham, N., Miniutti, G., & Spoon, H. W. W. 2005, MNRAS, 357, 565
- Kuraszkiewicz et al. (2003) Kuraszkiewicz, J. K. et al. 2003, ApJ, 590, 128
- La Franca et al. (2005) La Franca, F. et al. 2005, ApJ, 635, 864
- Lawrence (1991) Lawrence, A. 1991, MNRAS, 252, 586
- Lutz et al. (2004) Lutz, D., Maiolino, R., Spoon, H. W. W., & Moorwood, A. F. M. 2004, A&A, 418, 465
- Madau & Pozzetti (2000) Madau, P. & Pozzetti, L. 2000, MNRAS, 312, L9
- Marconi et al. (2004) Marconi, A., Risaliti, G., Gilli, R., Hunt, L. K., Maiolino, R., & Salvati, M. 2004, MNRAS, 351, 169
- Markwardt et al. (2005) Markwardt, C. B., Tueller, J., Skinner, G. K., Gehrels, N., Barthelmy, S. D., & Mushotzky, R. F. 2005, ApJ, 633, L77
- Nandra et al. (1997) Nandra, K., George, I. M., Mushotzky, R. F., Turner, T. J., & Yaqoob, T. 1997, ApJ, 476, 70
- Poggianti (1997) Poggianti, B. M. 1997, A&AS, 122, 399
- Radomski et al. (2003) Radomski, J. T., Piña, R. K., Packham, C., Telesco, C. M., De Buizer, J. M., Fisher, R. S., & Robinson, A. 2003, ApJ, 587, 117
- Risaliti et al. (1999) Risaliti, G., Maiolino, R., & Salvati, M. 1999, ApJ, 522, 157
- Saunders et al. (1990) Saunders, W., Rowan-Robinson, M., Lawrence, A., Efstathiou, G., Kaiser, N., Ellis, R. S., & Frenk, C. S. 1990, MNRAS, 242, 318
- Simpson (2005) Simpson, C. 2005, MNRAS, 360, 565
- Soltan (1982) Soltan, A. 1982, MNRAS, 200, 115
- Steffen et al. (2004) Steffen, A. T., Barger, A. J., Capak, P., Cowie, L. L., Mushotzky, R. F., & Yang, Y. 2004, AJ, 128, 1483
- Steffen et al. (2003) Steffen, A. T., Barger, A. J., Cowie, L. L., Mushotzky, R. F., & Yang, Y. 2003, ApJ, 596, L23
- Treister et al. (2005) Treister, E. et al. 2005, ApJ, 621, 104
- Treister & Urry (2005) Treister, E. & Urry, C. M. 2005, ApJ, 630, 115
- Treister et al. (2006a) Treister, E., et al. 2006a, ApJ, 640, 603
- Treister et al. (2006b) Treister, E., Virani, S., Urry, C. M., Maccarone, T. J., Lira, P., Beckmann, V., & Bird, T. J. 2006b, A&A, submitted
- Treister et al. (2004) Treister, E. et al. 2004, ApJ, 616, 123
- Ueda et al. (2003) Ueda, Y., Akiyama, M., Ohta, K., & Miyaji, T. 2003, ApJ, 598, 886
- Urry & Padovani (1995) Urry, C. M. & Padovani, P. 1995, PASP, 107, 803
- Worsley et al. (2005) Worsley, M. A., et al. 2005, MNRAS, 357, 1281
- Yu & Tremaine (2002) Yu, Q. & Tremaine, S. 2002, MNRAS, 335, 965
- Zheng et al. (2004) Zheng, W. et al. 2004, ApJS, 155, 73
| Survey | Area | Flux Lim. | Sources | Spec. | ddBreak and limiting magnitudes for a simple fit to spectroscopically identified fraction as a function of optical magnitude. | ddBreak and limiting magnitudes for a simple fit to spectroscopically identified fraction as a function of optical magnitude. | Max. | Ref. | ||
|---|---|---|---|---|---|---|---|---|---|---|
| deg2 | erg cm-2 s-1 | TotalaaSources selected in the hard X-ray band. | IDbbIncluding only sources with known redshifts and 1042 erg s1. | Obsc.ccSources with no broad lines in the optical spectrum. | Comp. | Comp. | ||||
| AMSS | 101.99 | 310-13 | 79 | 79 | 16 | 100% | — | — | 100% | 1 |
| SEXSI | 2.25 | 510-14 | 1016 | 405 | 194 | 40% | 20.5 | 26.0 | 68% | 2 |
| H2XMM | 0.9 | 210-14 | 122 | 94 | 33 | 79% | 23.5 | 28.0 | 100% | 3 |
| CLASXS | 0.28 | 410-15 | 466 | 232 | 129 | 52% | 21.5 | 27.0 | 100% | 4 |
| CYDER | 0.12 | 210-15 | 124 | 59 | 23 | 50% | 23.0 | 27.0 | 77% | 5 |
| CDF-S | 0.11 | 710-16 | 231 | 227 | 137 | 99% | — | — | 100% | 6 |
| CDF-N | 0.12 | 310-16 | 303 | 133 | 99 | 66% | 23.0 | 27.5 | 100% | 7 |