Chandra and XMM-Newton Observations of the Vela-like Pulsar B104658
Abstract
We present results from Chandra and XMMNewton observations of the radio pulsar B104658. A high-resolution spatial analysis reveals an asymmetric pulsar wind nebula (PWN) 6′′11′′ in size. The combined emission from the pulsar and its PWN is faint, with a best-fit power-law photon index of =1.7 and unabsorbed luminosity of 1032 ergs s-1 in the 0.510.0 keV range (assuming a distance of 2.7 kpc). A spatially resolved imaging analysis suggests the presence of softer emission from the pulsar. No pulsations are detected from PSR B104658; assuming a worst-case sinusoidal pulse profile, we derive a 3 upper limit for the pulsed fraction in the 0.5–10.0 keV range of 53%. Extended PWN emission is seen within 2′′ of the pulsar; the additional structures are highly asymmetric and extend predominantly to the south-east. We discuss the emission from the PWN as resulting from material downstream of the wind termination shock, as outflow from the pulsar or as structures confined by a high space velocity. The first two interpretations imply equipartition fields in the observed structures of 40100 G, while the latter case implies a velocity for the pulsar of 190 km s-1 (where is the ambient number density in units of cm-3). No emission from an associated supernova remnant is detected.
Subject headings:
pulsars: general — pulsars: individual (PSR B104658) — X-rays: general1. Introduction
X-ray observations of rotation-powered pulsars represent a powerful tool for studying the energetics and emission mechanisms of these objects. A large fraction of the available rotational energy is thought to be carried away in a relativistic wind of particles. When this wind is confined by the surrounding medium it decelerates and a synchrotron nebula forms, called a pulsar wind nebula (PWN). The overall PWN characteristics provide insights into the content and energy spectrum of the pulsar wind, the large-scale magnetic fields, and the surrounding medium. The small-scale structures of the nebula provide details of the acceleration sites, instabilities in the magnetic field, and the interaction between the wind and its surroundings. In young, energetic pulsars, nonthermal emission from particles accelerated in the magnetosphere and thermal emission from the surface of the star are also expected to be present.
The radio pulsar (PSR) B104658 was discovered during a Parkes survey of the Galactic plane (Johnston et al., 1992). It has a period of = 124 ms and period derivative = 9.610-14 s s-1. These values imply a characteristic age of = /2 = 20.4 kyr, spin-down luminosity of = 4/ = 2.01036 ergs s-1 (with a moment of inertia of the neutron star 1045 g cm-2) and surface dipole magnetic field strength of = 3.21019 G = 3.51012 G. These properties are similar to those of other young neutron stars typified by the Vela pulsar. The dispersion measure of 129 pc cm-3 towards the pulsar implies a distance of 2.7 kpc (Cordes & Lazio, 2002).
Deep radio observations did not detect extended emission associated with PSR B104658 (Stappers et al., 1999). X-ray observations with ASCA and ROSAT detected emission near the pulsar and suggested the presence of large-scale structures surrounded by faint emission (Pivovaroff et al., 2000a). However, the poor angular resolution of these observations prevented conclusive interpretation of the data. PSR B104658 is also one of a few pulsars with a possible EGRET -ray counterpart. The EGRET source 2EG J10495827 is coincident with the radio coordinates of PSR B104658 and likely -ray pulsations at the radio period have been found (Kaspi et al., 2000).
Here we report on observations of PSR B104658 carried out with the Chandra and XMMNewton satellites. Our study reveals a faint, arcsecond-scale PWN surrounding the pulsar. A detailed imaging and spectral analysis of the system suggests the presence of soft emission from the pulsar. We also examine the characteristics of the nebula in light of current models for the production of PWNe.
2. Observation and Data Analysis
PSR B104658 was observed with XMMNewton on 2002 August 10. The European Photon Imaging Camera (EPIC) MOS and PN instruments (Turner et al., 2001; Strüder et al., 2001) were operated in full- and small-frame modes, respectively. These settings provide a temporal resolution of 2.6 s for EPIC-MOS and 6 ms for EPIC-PN. The medium filters were used for MOS, the thin filter for PN. The CCD data were reduced with the XMMNewton Science Analysis System (SAS v6.2.0). The standard screening criteria results in an exposure time for the MOS cameras of 20 ks. For the PN camera, only 70% of the exposure time was used in the small-window mode (4′ field of view), resulting in an effective exposure time of 15 ks.
The Chandra observation of PSR B104658 was carried out on 2003 August 8-9. The aimpoint of the back-illuminated ACIS-S3 chip (Garmire et al., 2003) was positioned at the radio coordinates of the pulsar. The observation was taken in timed exposure, very faint mode, providing a temporal resolution of 3.2 s. The data were reduced using the CIAO 3.2.0 software and standard routines. The resulting effective exposure time was 36 ks.
The EPIC-PN instrument offers a higher sensitivity than ACIS-S, but its lower exposure time and reduced field of view limited its use to spectral and temporal analyses of the pulsar emission. In turn, the Chandra data were used to perform spectral and high-resolution imaging analyses of PSR B104658 and its surroundings, while the EPIC-MOS observations were mainly used as a consistency check due to their lower sensitivity and lower spatial resolution.
3. Imaging Analysis
Figure 1 shows the area surrounding the radio position of PSR B104658 obtained with Chandra. The image has been smoothed with a Gaussian with =05. It reveals for the first time the detailed extended structures surrounding PSR B104658, which we designate as its pulsar wind nebula (PWN) based on its overall characteristics discussed in the next sections. The nebula is elongated and 6′′11′′ in size, with its major axis oriented in a SE-NW direction. The line in Figure 1 marks the radio coordinates of the pulsar at =10h48m126(47) and =5832′0375(002), 2 errors (Stappers et al., 1999). While there is emission immediately surrounding the pulsar position (PWN “head”), there is also clumped emission to the SE (PWN “body”) and a bright clump to the NW (“north clump”).
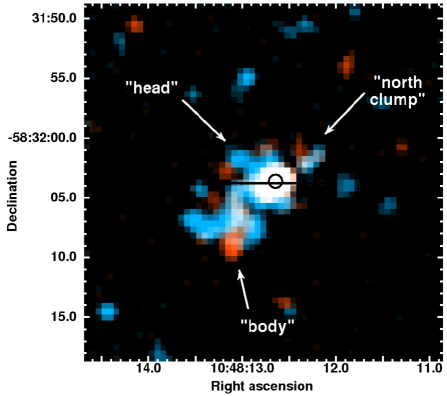
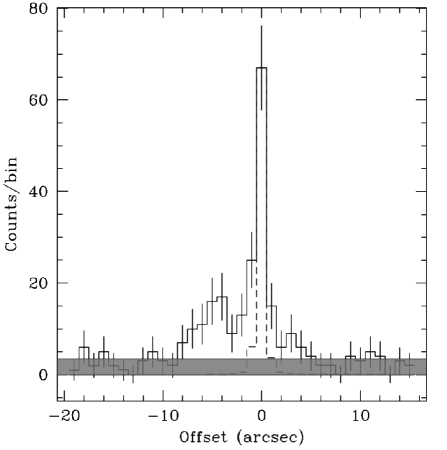
The head region of the nebula is consistent with a point source surrounded by extended structures. Figure 2 shows the intensity profile of the observed emission along a 10′′35′′ region in a SE-NW direction aligned with the implied axis of symmetry of the nebula. The shaded region represents the 2 background level obtained from a nearby, source-free region. The dashed line represents Chandra’s PSF at an energy of 1.5 keV obtained using CALDBv3.0.3 and the mkpsf tool111The slight asymmetry in the PSF profile is due to the binning and extraction region used in order to match the profile settings for the pulsar. A small, intrinsic asymmetry in the PSF has been suggested and could also contribute (see http://cxc.harvard.edu/cal/docs/cal_present_status.html#psf).. As the head region is also consistent with the radio coordinates of the pulsar, we consider the source embedded in the region to be the X-ray counterpart of the pulsar. Comparing the X-ray position of other sources in the field with their optical counterparts we derive an X-ray position for the pulsar of =10h48m1264 and =5832′036, with an overall rms error of 055. This is coincident within 1 of the radio position, especially in the more constraining declination direction (see Figure 1). We then define the “pulsar” emission as that arising in a circle of 1′′ in radius centered on the above X-ray coordinates.
We also find that the extended emission from the PWN dominates at high X-ray energies. Table 1 shows the number of background-subtracted counts obtained for various parts of the system in the soft (S) and hard (H) bands, their hardness ratios (HR = SH / S+H) and their total signal-to-noise ratio (S/N, e.g., Pivovaroff et al., 2000b) in the 0.510.0 keV range. While emission from the nebula is likely to be present within the 1′′ radius used for the pulsar, we suggest that emission from the neutron star is indeed present (and may dominate) in this region. The above is supported by the fact that this region is the only one that is seen to exhibit a positive HR with high significance, suggesting a contribution of distinctly softer emission than that of the rest of the nebula.
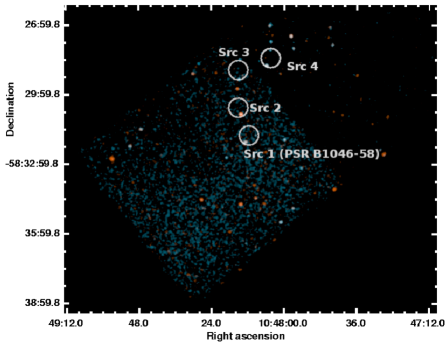
Using ASCA, Pivovaroff et al. (2000a) detected four point sources within 4′ of the radio position of the pulsar embedded in possible faint emission. The Chandra and XMMNewton observations confirm the presence of these X-ray point sources in the field, in addition to many others resolved by Chandra (see Figure 3). The soft point source in Chandra coincident with “Src 2” from Pivovaroff et al. (2000a) has an optical counterpart in the USNO B1.0 catalog (Monet et al., 2002), while we find no counterparts for the hard sources coincident with “Src 3” and “Src 4” in present catalogues (e.g., USNO B1.0; 2MASS, Cutri et al. 2003; RASS, Voges et al. 2001). No additional extended emission was detected that can be attributed to the PWN beyond the above arc-second structures. We then conclude that the low angular resolution and broad PSF wings of the telescope significantly affected the ASCA observations due to the large number of point sources in the field. We also note that the ASCA positions appear to be systematically north of the Chandra coordinates, the latter being in agreement with source positions at other wavelengths.
4. Spectral Analysis
The data obtained from both Chandra and XMMNewton were used to perform a spectral analysis of the emission from PSR B104658 and its PWN. For the Chandra data, an elliptical region of 12′′18′′ in size was used with a surrounding annulus as background. A total of 18414 background-subtracted counts were detected in the 0.510.0 keV range. The XMMNewton data were extracted from circular regions of 25′′ radii in each detector, encompassing 77% of the photons from a point source, with a nearby region used as background. The data from MOS1 and MOS2 were not included in the analysis due to the low number of counts detected in them (10617 and 4717, respectively222It has been found that the MOS1 count rate can be artificially boosted by statistical fluctuations by up to 70%, especially for sources with 50 true counts. See §2.1 and §4 in http://xmm.vilspa.esa.es/docs/documents/CAL-TN-0023-2-1.ps). The PN detector collected 26047 background-subtracted counts in the same range. The extracted spectra from Chandra’s S3 chip and XMMNewton’s PN detector were fit simultaneously in the 0.510.0 keV range using XSPEC (v.11.3.0) and a minimum of 20 counts per bin in each spectrum.
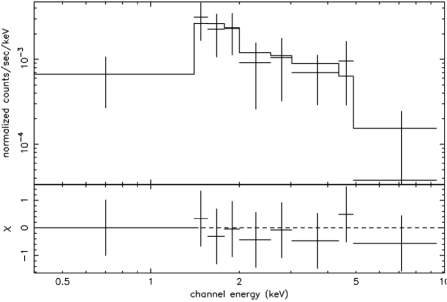
Thermal models for the integrated emission from the PWN and PSR B104658 are statistically acceptable (1.1). However, they result in temperatures far too high to represent shock-heated thermal plasma (8107 K, Raymond-Smith model, Raymond & Smith, 1977) or emission from the surface of the neutron star (1107 K, blackbody model). Instead, a non-thermal absorbed power-law model produces an equally acceptable fit (see Table 2) with a photon index of =1.7, similar to what is observed for other pulsars and their PWNe (e.g., Gaensler & Slane, 2006). The Chandra spectrum with the best-fit power-law model is shown in Figure 4. The observed emission is thus consistent with having a predominantly non-thermal origin.
We then searched for differences in the spectral characteristics of the different components of the system, as is hinted from our imaging analysis. The high spatial resolution available with Chandra was required in this case. The 11614 counts detected from the PWN alone were fit with a power-law model. Holding the interstellar absorption fixed to the best-fit value from Table 2, the resulting photon index was 1.2. Holding this contribution from the nebula fixed while fitting the overall spectrum, the residual (presumably pulsar-dominated) emission was well described by a power-law model with a photon index of 2.4. If a blackbody model is fitted to this emission the resulting temperature is 6.1106 K, too high to represent purely thermal emission from the neutron star but lower than thermal fits to the overall spectrum. Although the small number of counts did not allow us to constrain the above parameters, emission from the pulsar softer than that of the nebula seems to be present.
5. Timing Analysis
The data from the XMMNewton EPIC-PN camera were used to search for pulsations from PSR B104658. No evidence for an instrumental 1-s jump in the data was found (see, e.g., Woods et al., 2004). The dataset was converted to the solar system barycenter and a circular region of 25′′ radius centered at the above Chandra coordinates was used to extract the pulsar events. We also examined the dataset in different energy ranges using 0.510.0 keV, 0.52.0 keV and 2.010.0 keV. Radio observations of the pulsar obtained with the Parkes telescope predict a period for the middle of our observation (MJD 52496.5) of = 8.08512306 Hz ( = 123.683955 ms).
The test (Buccheri et al., 1983) was used to search for a periodic signal by folding the extracted photons over a range of 10 trial frequencies centered on the radio prediction. The number of harmonics used was varied to be = 1, 2, 4, and 8. The most significant signal was found in the 0.52.0 keV range at =8.08517(4) Hz (1 error) with = 8.9. Although this signal is consistent with the radio period of PSR B104658, it has a probability of chance occurrence of 6.3% for a single trial and it is not significant given the number of searches performed. Following Vaughan et al. (1994) and, e.g., Ransom et al. (2002), we can derive an upper limit on the pulsed fraction. Assuming a worse-case sinusoidal modulation, the maximum Fourier power obtained for a small range of frequencies centered on the radio prediction can be used to calculate an upper limit for the pulsed fraction at a specific level of confidence. In this way, we derive an upper limit for the pulsed fraction at the 99% confidence level of 53%, 65% and 61% in the 0.510 keV, 0.52.0 keV and 2.010.0 keV ranges, respectively.
6. Discussion
6.1. PSR B104658
X-ray emission from young radio pulsars is expected to include contributions from any of the following processes: thermal emission from the entire surface due to initial cooling, non-thermal emission from magnetospheric processes, and possibly thermal emission from localized hot spots reheated by back-flowing magnetospheric currents (see, e.g., Kaspi et al., 2004).
The combined emission from the pulsar and its PWN is best described by a non-thermal power-law model. However, our imaging and spectral analysis suggests that an additional, soft component may be present in the pulsar’s emission. The soft emission can be well described by a steep power law with 2.4, although such an interpretation would contradict the generally observed trend of young pulsars having spectral indices harder than those of their PWNe (e.g., Gotthelf, 2003). The additional soft emission cannot be entirely thermal, as the derived temperature is too high. It could, however, represent a combined spectrum of (hard) non-thermal plus (soft) thermal emission. The number of counts detected does not allow us to fit two-component models to this emission alone. Instead, in the case that this overall soft excess is related to thermal emission from the whole surface, we can constrain its temperature by fitting a blackbody plus power-law model and finding the maximum temperature that yields an acceptable fit to the total spectrum. We adopt hard limits for the interstellar absorption of 21022 cm-2 and a blackbody radius observed at infinity of 10 km (at a distance of 2.7 kpc). The power-law index and normalization were allowed to vary freely and the maximum blackbody temperature that causes deviations from the best-fit model at the 3 level was found. This results in a surface temperature of 1.4106 K. This temperature is not constraining for cooling models of neutron stars, as the temperature in the case of minimal cooling is predicted to be 1.1106 K for the pulsar’s characteristic age (e.g., Page et al., 2005). Similarly, if emission was present from a small polar cap on the surface with 3 km, the resulting temperature is 2.5106 K. This is comparable to those seen in other pulsars (e.g., Pavlov et al., 2002) and could then explain the observed soft excess for PSR B104658.
6.2. The PWN
The high spatial resolution available with Chandra allowed us to discover the arc-second scale PWN structures surrounding the pulsar. The “head” of the nebula is coincident with the radio position of the pulsar, while diffuse emission is seen predominantly to the SE. The emission from the pulsar and PWN is very faint, with a combined unabsorbed luminosity of only 11032 ergs s-1 in the 0.510.0 keV range. The efficiency with which the pulsar converts its rotational kinetic energy into X-rays is then / 510-5, comparable to the values found for other Vela-like systems (e.g., Pavlov et al., 2001b; Camilo et al., 2004).
It has been recently suggested that an empirical relationship exists between the X-ray spectral power-law indices of young pulsars () and their PWN () with the pulsar’s spin-down energy loss (Gotthelf, 2003). According to this relationship, lower pulsars exhibit harder spectral indeces. For PSR B104658, the predicted values are 0.1 and 0.9. The PWN emission appears to exhibit a spectrum similar to that predicted by this relationship ( 1.2). However, the small number of counts and the possible detection of thermal emission limit our ability to constrain the spectral characteristics of the pulsar and its PWN. Observations of other Vela-like pulsars do not seem to support this relationship (e.g., PSR B182313, Gaensler et al. 2003). However, longer observations at high angular resolution are needed to reliably test the validity of the relationship in this group of pulsars333Gotthelf (2004) has later suggested that this relationship only holds for pulsars with 41036 ergs s-1 and without a bow-shock morphology..
Radio observations did not detect emission from the PWN and constraints on the radio properties depend directly on the underlying assumption for the radio efficiency ( = /; Stappers et al., 1999). Detected nebulae show efficiencies in the range 10-410-3, while upper limits for unseen nebulae imply values of 10-5 (Frail & Scharringhausen, 1997; Gaensler et al., 2000). In the case of an undetected, extended radio nebula surrounding PSR B104658 and using a value of = 210-4, the upper limit on the radio flux and required surface brightness imply a large radius of 8 pc for a circular nebula (Stappers et al., 1999). At a distance of 2.7 kpc this represents a radius of 10′. While the X-ray size of PWNe is often found to be up to a few times smaller than the radio size due to smaller synchrotron lifetimes in the X-rays (e.g., Hester et al., 2002), we find no evidence for extended PWN structures on arcminute scales. For radio sizes 30′′, based on the small angular size of the X-ray nebula, the required efficiencies are very low at 510-7.
The origin of PWNe is commonly attributed to the interaction of a highly relativistic pulsar wind with its surroundings. At a radius from the pulsar, representing the point of pressure balance at which the wind is confined and decelerated, we expect = /4. Here, is the surrounding pressure and 1 is the filling factor of the wind. As the head region of the nebula is resolved as an extended structure with Chandra, we suggest that its outer radius can represent an upper limit on the location of the wind termination shock, while the body represents the expected emission downstream. The shock radius in this case is 2′′ = 0.026 pc, very similar to that found for the Vela pulsar (Helfand et al., 2001) and an order of magnitude smaller than those of much more energetic pulsars such as the Crab and PSR B150958 (e.g., Weisskopf et al., 2000; Gaensler et al., 2002). The required pressure in this case is 8.210-10 ergs cm-3 ( is the distance to the pulsar in units of 2.7 kpc). In the region downstream of the shock we expect equipartition between the particles and magnetic field to be reached, so that /4 = , where is the mean magnetic field in the nebula. We then estimate a value of 100 G. The corresponding synchrotron lifetime of particles emitting at an energy (in units of keV) is very small, at 40 yr. The velocity that is needed for these particles to reach the edge of the nebula within their synchrotron lifetimes is 2,600 km s-1 0.01 .
One problem with the above interpretation is that we expect the emission downstream of the shock to be symmetric about the pulsar. A possible explanation for the lack of emission to the NW involves Doppler boosting of the approaching (in this case SE) component. The observed flux ratios on either side of the pulsar require an intrinsic expansion velocity of 0.22, where is the inclination of the nebula to the line of sight. Similar velocities are found in the structures of other PWNe, such as the Crab (Hester et al., 2002). An intrinsically asymmetric pulsar wind could also be responsible for the observed characteristics.
The emission in the body of the nebula could also represent a collimated outflow, or jet, along the pulsar spin axis, as observed in other systems such as the Crab and Vela (Weisskopf et al., 2000; Helfand et al., 2001). In this case, we can estimate the minimum magnetic field and energy needed to support the jet against the surrounding pressure using equipartition arguments (e.g., Pacholczyk, 1970; Seward et al., 1984). We assume the jet to be a cylinder with length = 6.5′′ = 0.085 pc and radius = 1.5′′ = 0.020 pc, resulting in an emitting volume of 31051 cm3. From the results shown in Tables 1 and 2, we infer an unabsorbed jet luminosity in the 0.510.0 keV range of 21031 ergs s-1 (1 limit). Equipartition arguments ( , ) then imply a magnetic field in the jet of 42 (1+)2/7 G and an energy of 4.41041 (1+)4/7 ergs. Here, is the ratio of ion to electron energy and is the filling factor in the jet. We note that these represent very conservative lower limits on and , as the total emission from the jet can have a significant contribution at lower energies. Using the above limit on , the corresponding synchrotron lifetime for particles emitting at 2 keV is 100 (1+)-3/7 yr and implies a velocity in the jet of 1,000 (1+)3/7 km s-1.
For the Crab and Vela, the nebular magnetic field has been estimated to be 100’s G (e.g., Aharonian et al., 2004; Pavlov et al., 2001a). Similar fields have also been found for the large-scale jet in Vela (Pavlov et al., 2003). These are consistent with our derived fields above, suggesting the presence of similar confining pressures. The size and energetics of the nebula surrounding PSR B104658 are similar to that of Vela, as expected if these properties are also related to the pulsar’s spin-down energy . In contrast, the nebula surrounding PSR B150958 (Gaensler et al., 2002) shows much smaller equipartition fields (8 G) and larger size, pointing to a smaller confining pressure.
An alternate argument for an asymmetric nebula involves the confinement of the pulsar wind due to the ram pressure of a fast-moving pulsar (e.g., Gaensler et al., 2004). In this case, the body of the nebula would represent the expected X-ray tail aligned with the bow shock axis in the direction opposite to the pulsar proper motion. The implied position angle in the plane of the sky of the proper motion would be 310∘ (measured east of north). Recent Chandra observations of the Geminga pulsar revealed a somewhat similar morphology for its PWN (Pavlov et al., 2005; de Luca et al., 2006) which is likely to arise due the high space velocity of the pulsar.
In the case of a high space velocity, the confining pressure for the nebula is given by = , where is the ambient density and is the pulsar’s speed. For cosmic abundances and a number density in the ambient medium we get = 1.37 = 2.310-24 g cm-3, where is in units of 1 cm-3. Our above estimate for results in a velocity of 190 km s-1. Such a velocity is consistent with estimates for other bow-shock nebulae (e.g., Chatterjee & Cordes, 2002) and the expected distribution of pulsar velocities at birth (Arzoumanian et al., 1994; Faucher-Giguere & Kaspi, 2005). The proper motion for the pulsar in this case would be 0015 yr-1 and could be detected by radio interferometry. We note that a bow-shock interpretation for the X-ray morphology would differ from the static PWN interpretation favoured to explain the non-detection of an extended radio nebula (Stappers et al., 1999). A consistent bow-shock interpretation in both radio and X-rays is possible if the undetected radio nebula is unresolved with 10′′ and has a low efficiency of 10-6, which results in estimates from the radio observations of 250 km s-1 and 0.1 cm-3 (Stappers et al., 1999).
As suggested above, the structures observed in the body of the nebula can represent emission due to particles left behind after the passage of the pulsar for a large enough velocity. For 190 km s-1, the time taken by the pulsar to travel the observed distance is 540 yr. Synchrotron lifetimes matching this limit require magnetic fields of 20 G at 1 keV. This is consistent with the above equipartition field expected to hold in the vicinity of the pulsar given the uncertainties in our estimates above. The emission from the body and the north clump could also contain contributions from high velocity outflows. The north clump at a radius 3′′ from the pulsar “ahead” of the bow is not expected to arise due to shocked ambient medium. For example, at a velocity = 190 km s-1 and density = 1 cm-3, the medium is expected to have a temperature 0.07 keV. The luminosity is expected to be ergs s-1 1028 egs s-1, where 1.310-24 ergs cm3 s-1 is the cooling function at 0.07 keV and 71051 cm3 is the volume of the shocked gas within 3′′ of the pulsar (see, e.g., Rybicki & Lightman, 1979; Gaensler et al., 2004). The implied absorbed flux at Earth is then much smaller than the measured values. Additional observations can be used to confirm the presence of the north clump and its association to the system.
6.3. PSR B104658 and 2EG J10495827
Although not confirmed, an association between PSR B104658 and 2EG J10495827 has been proposed in light of, among other things, their positional coincidence, possible -ray pulsations, and spectral and energetic properties of the -ray pulsar (Fierro, 1995; Pivovaroff et al., 2000a; Kaspi et al., 2000). 2EG J10495827 was found to have a pulsed -ray flux above 400 MeV of (2.50.6)10-10 ergs cm-2 s-1, implying a -ray efficiency of (92)10-3 (for 1 sr beaming and a distance of 2.7 kpc, Kaspi et al., 2000). Unresolved, unpulsed -ray emission at the pulsar position was also found.
An extrapolation of the observed X-ray spectrum for PSR B104658 and its PWN (see Table 2) to energies 400 MeV predicts a flux of 0.710-13 ergs cm-2 s-1, three orders of magnitude lower than that derived for the EGRET source. This is true for other well-established -ray pulsars (e.g., Thompson et al., 1999). Observations at higher X-ray energies (e.g., deep exposures using RXTE, Suzaku) can help determine whether PSR B104658 is indeed a -ray pulsar by detecting possible high X-ray energy pulsations and spectral characteristics consistent with those of 2EG J10495827.
We note the presence of a particularly hard X-ray source visible in the Chandra data, 33 from the pulsar position at coordinates =10h48m0574(015) and =5828′46′′(24). The source is coincident with “Src 4” in Pivovaroff et al. (2000a); see also Figure 3. A total of 16415 counts were detected from this source and its spectrum is well described by a non-thermal power-law model with = (0.7)1022 cm-2, = 1.1 and unabsorbed flux in the 0.510.0 keV of (1.2)10-13 ergs s-1 cm-2 ( = 0.45 for 5 d.o.f., 1 errors). No counterpart for this source was found at other wavelengths and it lies within the 99% confidence error of 2EG J10495827. This suggests that the observed -ray emission could have contributions from more than one source. Higher spatial resolution -ray observations with future missions may help to address this possibility.
We also find that the emission from the nebula dominates at high X-ray energies (see Table 1) over that of the pulsar. This argues for the unpulsed -ray emission associated with 2EG J10495827 to also arise, at least in part, from the nebula, as proposed for the Vela and Crab pulsars (Nolan et al., 1993; Kanbach et al., 1994; Fierro et al., 1998).
6.4. Non-detection of a Supernova Remnant
As we do not detect emission from a supernova remnant (SNR) in the field containing PSR B104658, following Gaensler et al. (2003) we can estimate the flux from a possible unseen remnant by scaling the emission observed from the Vela SNR. The emission from this remnant can be described by a two-component Raymond-Smith plasma with temperatures 0.15 keV and 1 keV (Lu & Aschenbach, 2000). The total unabsorbed luminosity in the 0.1-2.4 keV range is 2.21035 ergs s-1 and the cooler component has a volume-integrated emission measure 10 times higher than the hot component. Scaling to a distance of 2.7 kpc, the unabsorbed flux densities for each component would be = 2.310-10 ergs s-1 cm-2 and = 2.210-11 ergs s-1 cm-2, respectively.
The expected ACIS-S444The EPIC-MOS data provide less constraining limits for this emission due to their lower sensitivity and higher background levels. The EPIC-PN data had a much smaller exposure time and limited field of view. count rate predicted by the WebPIMMS tool555http://heasarc.gsfc.nasa.gov/Tools/w3pimms.html is 2.6 counts s-1 (on-axis) for absorbing columns 51021 cm-2. Scaling the size of the Vela SNR (8∘ at 300 pc, Lu & Aschenbach, 2000), we would expect a shell with a radius of 26′ at 2.7 kpc. This size is larger than the ACIS-S (and EPIC-MOS) field of view. However, parts of the remnant might be visible in the present data given the uncertainties in the spatial distribution of the remnant and direction of motion of the pulsar. Assuming emission areas for the remnant proportional to having a shell thickness 20% of its radius, the expected surface brightness density is 0.810-6 counts s-1 arcsec-2. This is lower than the ACIS-S background level during the observation, estimated to be 2610-6 counts s-1 arcsec-2 (accounting for vignetting at large off-axis angles).
It is then possible that a remnant with similar properties to that of the Vela remnant might be present and it is undetected by these observations. The lack of radio or X-ray emission from the SNR has also been attributed to an initial fast expansion into a low-density cavity (e.g., Braun et al., 1989). This expansion is followed by a collision with a dense surrounding shell of stellar wind material from the progenitor where the emission fades rapidly and energy is dissipated through radiative shocks.
7. Conclusions
We have detected an asymmetric, arc-second scale PWN surrounding the young, energetic PSR B104658. The overall emission from the pulsar and PWN is best described by a non-thermal power-law model with =1.7 and a low X-ray luminosity of 1032 ergs s-1 in the 0.510.0 keV range. The brightest emission region in the PWN is coincident with the radio coordinates of the pulsar. It is resolved as an extended structure with Chandra and we suggest that it can represent an upper limit to the location of the wind termination shock. The additional, asymmetric structures can represent nebular emission downstream of the shock or collimated outflow from the pulsar. The implied equipartition magnetic fields are 40100 G. The overall size and energetics of the system in this case are very similar to those of the Vela pulsar. Instead, if the observed asymmetry in the nebula were to arise due to a large space velocity for the pulsar we estimate a value of 190 km s-1. In this case, we would favor the presence of arcsecond-scale nebulae with low efficiencies in both X-ray and radio. Our spatially resolved analysis also hints at the presence of softer emission from the pulsar than from the rest of the nebula. In the case that thermal emission from the whole surface of the star is present, we derive an upper limit for the temperature of 1.4106 K, which is not constraining on cooling models of neutron stars. In the case of a small hot spot on the surface, the implied temperature is 2.5106 K and would be consistent with those seen for other pulsars.
The results shown here demonstrate the need for high-resolution, high-sensitivity observations in order study the wide range of structures associated with rotation-powered pulsars. While the origin of these structures cannot be unambiguously determined in the case of PSR B104658, they can be broadly understood using current theories for the production PWNe. Additional data and theoretical work are needed to reach a consistent picture of this interesting phenomenon in neutron star physics.
References
- Aharonian et al. (2004) Aharonian, F., et al. 2004, ApJ, 614, 897
- Arzoumanian et al. (1994) Arzoumanian, Z., Nice, D. J., Taylor, J. H., & Thorsett, S. E. 1994, ApJ, 422, 671
- Braun et al. (1989) Braun, R., Goss, W. M., & Lyne, A. G. 1989, ApJ, 340, 355
- Buccheri et al. (1983) Buccheri, R., et al. 1983, A&A, 128, 245
- Camilo et al. (2004) Camilo, F., et al. 2004, ApJ, 616, 1118
- Chatterjee & Cordes (2002) Chatterjee, S., & Cordes, M., J. 2002, ApJ, 575, 407
- Cordes & Lazio (2002) Cordes, J. M., & Lazio, T. J. W. 2002, ApJ, submitted, (astro-ph/0007310)
- Cutri et al. (2003) Cutri, R. M., et al. 2003, VizieR Online Data Catalog II/246
- de Luca et al. (2006) de Luca, A., et al. 2006, A&A, 445, L9
- Faucher-Giguere & Kaspi (2005) Faucher-Giguere, C. ., & Kaspi, V. M. 2005, ApJ, submitted, (astro-ph/0512585)
- Fierro (1995) Fierro, J. M. 1995, Ph.D. thesis, Stanford University
- Fierro et al. (1998) Fierro, j. M., Michelson, P. F., Nolan, P. L., & Thompson, D. J. 1998, ApJ, 494, 734
- Frail & Scharringhausen (1997) Frail, D. A., & Scharringhausen, B. R. 1997, ApJ, 480, 364
- Gaensler et al. (2002) Gaensler, B. M., et al. 2002, ApJ, 569, 878
- Gaensler et al. (2003) Gaensler, B. M., et al. 2003, ApJ, 588, 441
- Gaensler & Slane (2006) Gaensler, B. M., & Slane, P. O. 2006, ARAA, 44, 17
- Gaensler et al. (2000) Gaensler, B. M., et al. 2000, MNRAS, 318, 58
- Gaensler et al. (2004) Gaensler, B. M., et al. 2004, ApJ, 616, 383
- Garmire et al. (2003) Garmire, G. P., et al. 2003, Proc. SPIE, 4851, 28
- Gotthelf (2003) Gotthelf, E. V. 2003, ApJ, 591, 361
- Gotthelf (2004) Gotthelf, E. V. 2004, in IAU Symposium, ed. F. Camilo & B. M. Gaensler, 225
- Helfand et al. (2001) Helfand, D. J., Gotthelf, E. V., & Halpern, J. P. 2001, ApJ, 556, 380
- Hester et al. (2002) Hester, J. J., et al. 2002, ApJ, 577, L49
- Johnston et al. (1992) Johnston, S., et al. 1992, MNRAS, 255, 401
- Kanbach et al. (1994) Kanbach, G., et al. 1994, A&A, 289, 855
- Kaspi et al. (2000) Kaspi, V. M., et al. 2000, ApJ, 528, 445
- Kaspi et al. (2004) Kaspi, V. M., Roberts, M. S. E., & Harding, A. K. 2004, in Compact Stellar X-ray Sources, ed. W. H. G. Lewin & M. van der Klis (UK: Cambridge University Press), in press (astro-ph/0402136)
- Lu & Aschenbach (2000) Lu, F. J., & Aschenbach, B. 2000, A&A, 362, 1083
- Monet et al. (2002) Monet, D. G., et al. 2002, VizieR Online Data Catalog
- Nolan et al. (1993) Nolan, P. L., et al. 1993, ApJ, 409, 697
- Pacholczyk (1970) Pacholczyk, A. G. 1970, Radio Astrophysics (San Francisco: Freeman)
- Page et al. (2005) Page, D., Geppert, U., & Weber, F. 2005, to be published in Nucl. Phys. A (astro-ph/0508056)
- Pavlov et al. (2001a) Pavlov, G. G., Kargaltsev, O. Y., Sanwal, D., & Garmire, G. P. 2001a, ApJ, 554, L189
- Pavlov et al. (2005) Pavlov, G. G., Sanwal, D., & Zavlin, V. E. 2005, ApJ, submitted, astro-ph/0511364
- Pavlov et al. (2003) Pavlov, G. G., Teter, M. A., Kargaltsev, O., & Sanwal, D. 2003, ApJ, 591, 1157
- Pavlov et al. (2002) Pavlov, G. G., Zavlin, V. E., & Sanwal, D. 2002, in Proc. 270th WE-Heraeus Seminar on Neutron Stars, Pulsars, and Supernova Remnants, ed. W. Becker, H. Lesch, & J. Trümper (MPE Rep. 278; Garching: MPE), 273 (astro-ph/0206024)
- Pavlov et al. (2001b) Pavlov, G. G., et al. 2001b, ApJ, 552, L129
- Pivovaroff et al. (2000b) Pivovaroff, M., Kaspi, V. M., & Camilo, F. 2000b, ApJ, 535, 379
- Pivovaroff et al. (2000a) Pivovaroff, M., Kaspi, V. M., & Gotthelf, E. V. 2000a, ApJ, 528, 436
- Ransom et al. (2002) Ransom, S. M., Gaensler, B. M., & Slane, P. O. 2002, ApJ, 570, L75
- Raymond & Smith (1977) Raymond, J. C., & Smith, B. W. 1977, ApJS, 35, 419
- Rybicki & Lightman (1979) Rybicki, G. B., & Lightman, A. P. 1979, Radiative Processes in Astrophysics (New York: Wiley)
- Seward et al. (1984) Seward, F. D., Harnden Jr., F. R., Szymkowiak, A., & Swank, J. 1984, ApJ, 281, 650
- Stappers et al. (1999) Stappers, B. W., Gaensler, B. M., & Johnston, S. 1999, MNRAS, 308, 609
- Strüder et al. (2001) Strüder, L., et al. 2001, A&A, 365, L18
- Thompson et al. (1999) Thompson, D. J., et al. 1999, ApJ, 516, 297
- Turner et al. (2001) Turner, M. J. L., et al. 2001, A&A, 365, L27
- Vaughan et al. (1994) Vaughan, B. A., et al. 1994, ApJ, 435, 362
- Voges et al. (2000) Voges, W., et al. 2000, VizieR Online Data Catalog IX/29
- Weisskopf et al. (2000) Weisskopf, M. C., et al. 2000, ApJ, 536, L81
- Woods et al. (2004) Woods, P. M., et al. 2004, ApJ, 605, 378
| 0.52.0 keV | 2.010.0 keV | HR = | S/N | |
|---|---|---|---|---|
| Region | counts (S) | counts (H) | (SH)/(S+H) | (0.510.0 keV) |
| Pulsar (1′′ radiusaaSee §3 for detailed discussion.) | 43 8 | 24 6 | 0.27 0.10 | 8.5 |
| PWN, all (- Pulsar) | 46 9 | 70 11 | 0.21 0.06 | 9.1 |
| PWN, “head” (- Pulsar) | 12 5 | 31 7 | 0.44 0.21 | 6.1 |
| PWN, “body” | 22 6 | 34 7 | 0.22 0.10 | 9.1 |
| “North clump” | 5 2 | 5 2 | 0.00 0.02 | 2.9 |
| Pulsar + PWN | 89 11 | 95 12 | 0.03 0.01 | 12.1 |
| Parameter | Value (1) |
|---|---|
| (1022 cm-2) | 0.9 |
| 1.7 | |
| (dof) | 79(68) |
| bbAbsorbed and unabsorbed X-ray fluxes, and , in the 0.510.0 keV range. (ergs s-1 cm-2) | 0.710-13 |
| bbAbsorbed and unabsorbed X-ray fluxes, and , in the 0.510.0 keV range. (ergs s-1 cm-2) | 1.010-13 |
| ccUnabsorbed X-ray luminosity in the 0.510.0 keV range for a distance of 2.7 kpc. (ergs s-1) | 0.91032 |