789\Yearpublication2006\Yearsubmission2005\Month11\Volume999\Issue88
later
Suzaku Observations of Iron Lines and Reflection in AGN
Abstract
Initial results on the iron K-shell line and reflection component in several AGN observed as part of the Suzaku Guaranteed time program are reviewed. This paper discusses a small sample of Compton-thin Seyferts observed to date with Suzaku; namely MCG -5-23-16, MCG -6-30-15, NGC 4051, NGC 3516, NGC 2110, 3C 120 and NGC 2992. The broad iron K emission line appears to be present in all but one of these Seyfert galaxies, while the narrow core of the line from distant matter is ubiquitous in all the observations. The iron line in MCG -6-30-15 shows the most extreme relativistic blurring of all the objects, the red-wing of the line requires the inner accretion disk to extend inwards to within of the black hole, in agreement with the XMM-Newton observations. Strong excess emission in the Hard X-ray Detector (HXD) above 10 keV is observed in many of these Seyfert galaxies, consistent with the presence of a reflection component from reprocessing in Compton-thick matter (e.g. the accretion disk). Only one Seyfert galaxy (NGC 2110) shows neither a broad iron line nor a reflection component. The spectral variability of MCG -6-30-15, MCG -5-23-16 and NGC 4051 is also discussed. In all 3 cases, the spectra appear harder when the source is fainter, while there is little variability of the iron line or reflection component with source flux. This agrees with a simple two component spectral model, whereby the variable emission is the primary power-law, while the iron line and reflection component remain relatively constant.
keywords:
X-rays:galaxies – galaxies:active – galaxies:Seyfert1 Introduction
Determining the origin of the iron K emission line is one of the fundamental issues in high energy research on AGN, as it is one of the most direct probes available of the inner accretion disk and black hole. The iron line first became important during the Ginga era, where observations showed the 6.4 keV iron K emission line was common amongst Seyfert galaxies (Pounds et al. 1990). The associated “reflection hump” above 10 keV, produced by Compton down-scattering of higher energy photons, showed the iron line emission arises from Compton-thick material, possibly the accretion disk (George & Fabian 1991). The higher (CCD) resolution spectra available with ASCA indicated that the iron line profiles were broad and asymmetrically skewed, which was interpreted as evidence that the majority of the line emission originated from the accretion disk around the massive black hole (Tanaka et al. 1995, Nandra et al. 1997, Reynolds 1997).
The picture emerging from XMM-Newton and Chandra observations is more complex. The presence of a narrow 6.4 keV iron emission component, from more distant matter is common in many type I AGN (Yaqoob & Padmanabhan 2004, Page et al. 2004). Furthermore, complex absorption in some objects could effect the modeling of the iron K-line and reduce its strength (Reeves et al. 2004, Turner et al. 2005). The presence of a reflection component hardening the spectrum towards higher energies (George & Fabian 1991) also complicates fitting the broad iron K line, if bandpass above 10 keV is not available to determine its strength.
New observations with the Suzaku X-ray observatory can provide an important breakthrough in this area, by determining the true underlying AGN continuum emission over a wide bandpass (e.g. from 0.3 keV to keV), thereby resolving the ambiguities present in fitting the iron K-shell band. Importantly the bandpass of above 10 keV provided by the hard X-ray detector (HXD) on-board Suzaku makes it possible to measure the reflection component simultaneously with the iron K line. In the next section the Suzaku observatory is briefly outlined, while in Section 3 results from individual observations of Seyfert galaxies performed as part of the Suzaku Guaranteed Time (GT) program are outlined. The majority of the subsequent spectra show detections of the relativistic iron line and associated Compton reflection hump.

2 The Suzaku X-ray Observatory
Astro-E2 (subsequently renamed Suzaku), the fifth in the series of Japanese X-ray astronomy satellites, was launched from Uchinoura Space Center, Japan on July 10, 2005. It has reached a low Earth orbit (570 km altitude, with an inclination of 31∘), with an orbital period of 96 minutes (Mitsuda et al. 2006). The working scientific payload of Suzaku consists of four X-ray focusing telescopes (Serlemitsos et al. 2006), with four X-ray sensitive CCDs at the focal plane of the telescopes. These CCDs (or X-ray Imaging Spectrometers, XIS, Koyama et al. 2006) consist of three front illuminated (FI) CCDs (sensitive from 0.4–12 keV) and one back illuminated CCD (BI) CCD (sensitive from 0.2–12 keV) with enhanced soft X-ray response. The FI chips are also referred to as XIS 0, XIS 2 and XIS 3 respectively, while the BI CCD is referred to as XIS 1. The second instrument on-board Suzaku is a non-imaging, collimated Hard X-ray Detector (HXD, Takahashi et al. 2006), which extends the Suzaku bandpass out to higher energies from 10–600 keV. The HXD consists of three detectors, the PIN (silicon diodes sensitive from 10–70 keV), the GSO (a phoswich counter sensitive from 40–600 keV), as well as the non-pointing HXD-WAM (Wide-band All-sky Monitor).
In this paper, we discuss the data only from the XIS, HXD/PIN and HXD/GSO. The 4 XIS detectors have a combined collecting area similar to XMM-Newton; cm2 at 6 keV, while at 1.5 keV the XIS area is cm2. The energy resolution of the XIS is 130 eV (FWHM) at 6 keV. The low energy line spread function of the XIS is nearly symmetrical in shape, allowing the detection of low energy K-shell lines from C, N and O. At hard X-ray energies above 10 keV, the HXD has high sensitivity and low background compared to other missions. A comparison of the Suzaku HXD non X-ray background versus Beppo-SAX PDS and RXTE PCA/HEXTE is shown in Figure 1. The HXD background level is lower compared to the PDS instrument over most of the energy range; the HXD PIN background is mCrab at 20 keV. The systematic uncertainty of the HXD background is currently 5% (with a 1% goal), making it possible to study hard X-ray faint astronomical sources ( mCrab). Note especially the low background level of the HXD at the peak energy of the Compton reflection hump in AGN or of the Cosmic hard X-ray background (near 20–30 keV). Also, given the AGN being detected in the Swift BAT All Sky Survey above 15 keV (Markwardt et al. 2005), it will be possible to perform a broad band spectral study of AGN at a flux level mCrab with both XIS and HXD. These properties of Suzaku are therefore of great potential benefit to the study of the iron line and the Compton reflection component in AGN.
The Suzaku observations described in this paper were processed with the latest version of the pipeline available to the Science Working Group (SWG) members. Typical screening parameters used to process and extract the data are described elsewhere; e.g. refer to Reeves et al. (2006) for a description of the AGN MCG -5-23-16, or to Terada et al. (2006) for the HXD analysis of the binary X-ray pulsar, AO 0535+262. For the XIS, the soft X-ray contamination (in the C and O band) has been corrected in the spectra. For the HXD/PIN, background spectra were extracted from a time-dependent model provided by the instrument team. Cosmic X-ray background (CXB) flux (Gruber et al. 1999) was also included in the PIN background model, at a level of erg cm-2 s-1, integrated over the 15–50 keV band. The HXD/GSO data are only discussed here in the observations of the two brightest AGN in this sample; in MCG -5-23-16 and NGC 2110 the GSO background was extracted from observations of the clusters Abell 1795 and Fornax respectively.
3 X-ray Spectra of Seyfert Galaxies Obtained with Suzaku
3.1 MCG -5-23-16
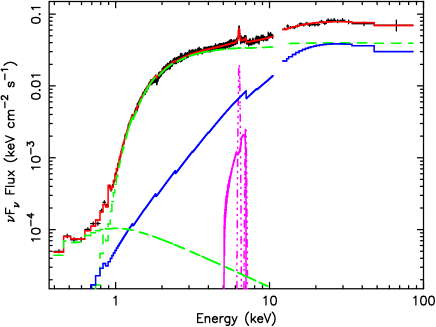
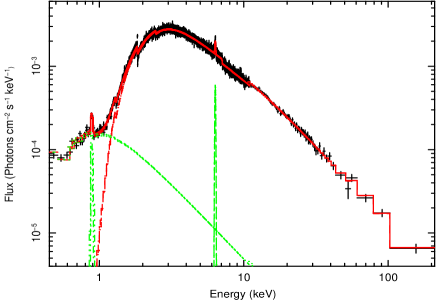
The Compton-thin Seyfert 1.9 galaxy MCG -5-23-16 (at ) was observed by Suzaku between 7–10 December 2005, for a total exposure time of 98.1 ks with XIS. The Suzaku observation was performed simultaneously with XMM-Newton and Chandra. The broad band spectral energy distribution from XIS and HXD is shown in Figure 2. The spectrum is plotted with respect to a baseline continuum model consisting of a power-law of , absorbed by neutral matter of column density cm-2. A steep soft power-law (of ) attenuated only the the local Galactic column density of cm-2 is also included in the continuum model. This is likely to arise due to indirect scattered X-ray continuum as well as photoionized emission from distant gas. The spectrum is then well fitted () when a Compton reflection component with is added (here , where is the solid angle subtended by the reflecting material), while the iron abundance is times Solar. Overall, the source flux of MCG -5-23-16 was high, erg cm-2 s-1 in the 2-10 keV band or erg cm-2 s-1 from 15-100 keV.
Figure 2 also shows a close-up of the iron K line profile for MCG -5-23-16, notice the excellent agreement between the XMM-Newton EPIC-pn data and Suzaku XIS. The narrow iron K line core at 6.40 keV as well as the K line are both clearly detected, the narrow K core has an equivalent width of 70 eV and is unresolved in both Suzaku XIS and Chandra ( km s-1 FWHM), consistent with an origin in distant matter far from the black hole. Nonetheless a broad iron K line is unambiguously detected, with a similar equivalent width as per the narrow core (60 eV), broadened by a velocity width of . When the broad component is modeled by a disk line around a Schwarzschild black hole (Fabian et al. 1989), the inner disk radius is , with a disk inclination angle of . More details of the spectral fitting are given in Reeves et al. (2006). An inclination of 50∘ is consistent with the classification of MCG -5-23-16 as a Seyfert 1.9 galaxy within AGN unified schemes.
The spectral variability of AGN can also be explored with Suzaku, over a broad energy band and especially in the reflection spectrum above 10 keV. Splitting the MCG -5-23-16 observation into high and low flux spectra revealed no apparent change in the iron line flux or absolute strength of the reflection component. The difference spectrum of the high – low flux states from 1–50 keV is shown in Figure 3, which is consistent with a simple absorbed power-law continuum with no excess due to an iron K line nor a reflection hump above 10 keV. Thus it appears that the variable emission component is the primary power-law, while the reflection spectrum remains roughly constant. In the MCG -5-23-16 observation, the continuum is variable by 40%, while any changes in the reflection are limited to %. The lack of variability of the reflector may in part be due to the distant reflector, note the relative strengths of the broad and narrow iron lines suggest they contribute equally to the reflection spectrum.
3.2 MCG -6-30-15
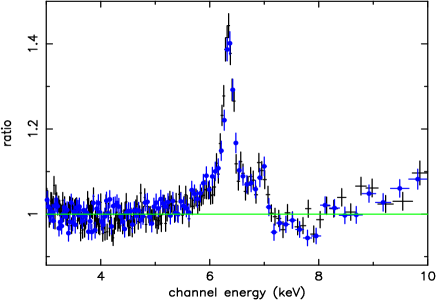
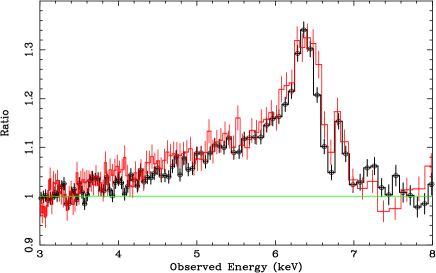
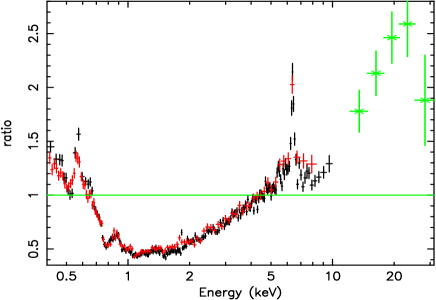
The Seyfert 1 galaxy MCG -6-30-15 () was observed 3 times by Suzaku in 2006 January, with a total exposure of 347 ks and a mean 2-10 keV flux of erg cm-2 s-1, similar to the XMM-Newton deep look (Fabian et al. 2002). The broad band Suzaku spectrum of MCG -6-30-15 plotted as a ratio to a power-law continuum of , is shown in Figure 4. The familiar signature of the broad iron K line is present between 4–7 keV, while below 3 keV the spectrum is strongly absorbed by a warm absorber as previously known (e.g. Turner et al. 2004). Importantly the HXD/PIN data above 10 keV show a very strong hard excess, the clear signature of a reflection component. The iron line profile is also shown in Figure 4 (lower panel), which shows a remarkable similarity to the profile obtained with the deep XMM-Newton observation (Fabian et al. 2002; Vaughan & Fabian 2004).
As shown in Miniutti et al. (2006), the iron line can be parameterized with a double Gaussian to represent the red-wing and blue-core of the line, with a total equivalent width of eV. The blue core of the line near 6.4 keV is clearly resolved with eV (implying emission within of the black hole), while the red-wing has a width of eV, implying emission within of the black hole. The unresolved iron line core emission is constrained to only eV in equivalent width, Furthermore, two weak absorption lines from He and H-like iron are observed near 6.7 keV and 7.0 keV within the blue-wing of the line, as also observed by Chandra HETG (Young et al. 2005). As the Fe K-shell absorption is highly ionized (and crucially no absorption from species below He-like Fe are detected), this suggests the absorber has a negligible effect on the relativistic line in the iron K band.
The spectrum above 3 keV can be well fitted (reduced , for 2312 degres of freedom) with a blurred ionized disk reflection model (Ross & Fabian 2005). The inner disk radius in constrained to within of the black hole (the outer radius is fixed at ), which places an lower-limit on the black hole spin of (i.e. near maximal for a Kerr metric). The disk inclination is found to be ∘. The disk emissivity can be parameterized by a broken power-law function, with a steep inner emissivity of , a break radius fixed at and a flatter outer emissivity of . (Note the emissivity is parameterized as , where r is the radius from the black hole). The reflection component is very strong, with representing % of the continuum flux from 14-45 keV, while the ionization state is close to neutral ( erg cm s-1) and the iron abundance is 2 times solar. As the narrow unresolved core of the line is so weak, the reflection is dominated by the inner disk, the distant reflector having a negligible contribution. The reflection spectrum appears to be enhanced with respect to the power-law continuum, which could argue in favour of gravitational light bending of continuum photons towards the innermost disk (Miniutti & Fabian 2004).
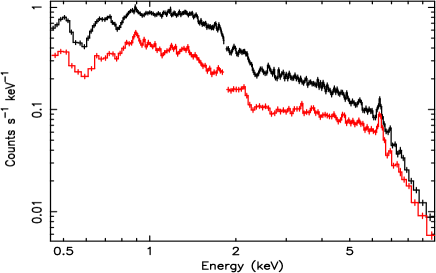
It is also possible to examine the spectral variability over a wide energy band with XIS and HXD and therefore measure the variability of the reflection component directly. As per the earlier XMM-Newton observations, MCG -6-30-15 shows short term continuum variability of a factor of over a few ks, making it possible to derive high and low flux spectra for the source. Figure 5 shows the high and low flux spectra, plotted against a power-law continuum. The reflection hump appears stronger in the low flux spectrum against the weaker continuum ( vs. ), consistent with there being no change in the absolute strength of the reflection component. This is confirmed by the high – low difference spectrum, which shows no variable component to the Compton hump above 10 keV. Furthermore a flux–flux analysis, plotting the 14–45 keV band HXD flux points against the 1–2 keV band XIS points (Miniutti et al. 2006), shows a constant hard offset component equal in magnitude to the reflection component. Thus it appears that the disk reflector is less variable than the power-law continuum, which is predicted by the light bending model of Miniutti & Fabian (2004).
3.3 NGC 2992
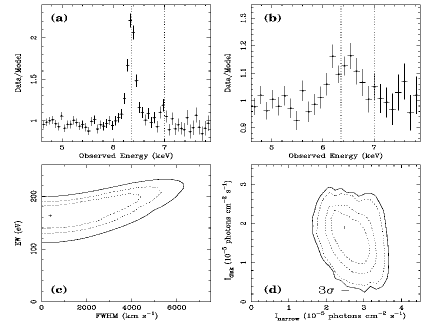
The Compton-thin Seyfert 1.9 NGC 2992 () was observed 3 times by Suzaku in 2005, November and December, with a total exposure time of 108 ks. The source was found to be in a relatively low state, with a 0.5–10 keV unabsorbed luminosity of erg s-1. The XIS data was analyzed in detail by Yaqoob et al. (2006), while the HXD data was not presented at this stage, due to the low flux level of the source. One of the main results was that the broad and narrow iron line could be decoupled at a high degree of confidence. This is illustrated in Figure 6. Most importantly panel (d) in Figure 6 shows the confidence contours of the narrow versus broad iron line flux, showing that the two components are decoupled at confidence. The equivalent width of the broad line was found to be eV. The most likely origin of the line is the accretion disk. For an assumed disk emissivity of , the line can be characterized by an inner disk radius of and an inclination angle ∘. Note although a Compton down-scattered shoulder to the 6.4 keV line core would be expected near 6.24 keV (e.g. Matt et al. 2002), its intensity and width are negligable compared to the broad iron line.
3.4 NGC 3516
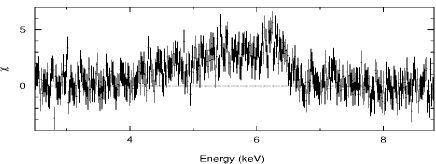
The Seyfert 1 NGC 3516 was observed by Suzaku in 2006, October 12–15, for a total of 135 ks exposure. The findings are briefly summarized here, they are presented in more detail by Markowitz et al. (2006). The 2–10 keV flux observed by Suzaku was similar to the 2001 XMM-Newton observations (Turner et al. 2005) of about erg cm-2 s-1; however in the soft band (0.5-2.0 keV) the flux measured by Suzaku is a factor of lower than in XMM-Newton. A detailed analysis of the 2001 XMM-Newton and Chandra HETG data by Turner et al. (2005) suggested that a broad red-wing to the iron line was not required, while the spectrum could be modeled by multiple layers of a complex absorber, producing spectral curvature in the 2–6 keV band. In the Suzaku observation, a broad relativistic iron K line is present (Figure 7), with an equivalent width of eV and can be parameterized by disk emission down to a radius of . The line core is also resolved, with a FWHM of km s-1, consistent with the expected width from the BLR in this object (Peterson et al. 2004). Both the broad iron line and the complex absorption are required in the Suzaku data, with an increase in the column density of a factor between the XMM-Newton and Suzaku observations, consistent with the decrease in soft flux. A reflection component is detected in HXD/PIN consistent with covering, while the underlying power-law continuum is well constrained, with . This demonstrates the ability of Suzaku to deconvolve a complex spectrum over a broad bandpass, helping break the degeneracy between the continuum, absorption, reflection and a complex iron line profile.

3.5 NGC 4051
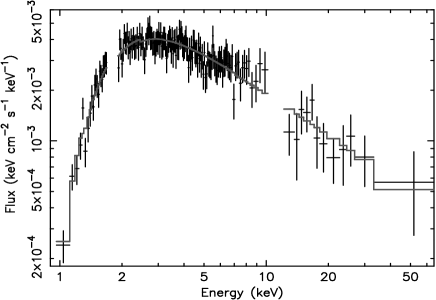
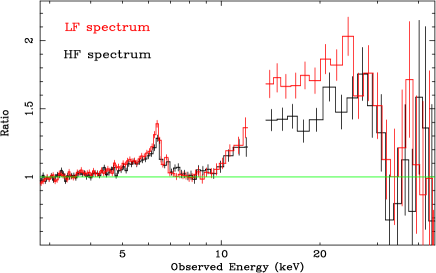
NGC 4051, a Narrow Line Seyfert 1 at was observed by Suzaku for a net exposure of 93.2 ks. The AGN shows typical large amplitude fluctuations making it possible to extract high and low flux spectra from the Suzaku observation. These spectra are shown in Figure 8, showing that NGC 4051 is harder at low fluxes, and less variable in the hard band. The source has a flat spectrum in the 2-10 keV band, with and for the high and low spectra, with fluxes of erg cm-2 s-1 and erg cm-2 s-1 respectively. Both fluxes are lower than the historical mean for this AGN, the low flux spectrum is comparable to the low-state XMM-Newton observation in 2002 ( erg cm-2 s-1; Pounds et al. 2004). The high – low difference spectrum shows that the variable emission is represented by a much steeper power-law, modified by a warm absorber between 0.7–3 keV, as is shown in Figure 8. No iron line emission appears to be present near 6 keV in the difference spectrum indicating that the iron line is relatively constant, with the steep power-law being the intrinsically variable component.
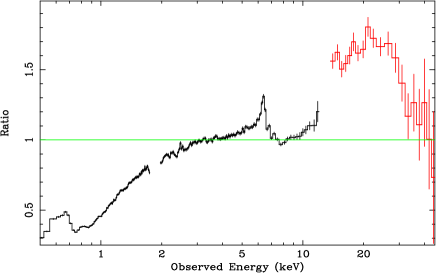
Figure 9 shows the mean spectrum as a ratio against this intrinsic continuum. It appears that absorption has a substantial effect on the spectrum below about 3–4 keV, producing considerable spectral curvature. At the softest energies an excess of emission is present, as well as emission in photoionized gas (the 0.57 keV O VII line is readily apparent). Above the iron line a strong hard excess is apparent, likely associated with a reflection component.
Indeed the spectrum can be well modeled by including complex/ionized absorption, a soft excess including soft X-ray line emission, broad and narrow iron K lines and Compton reflection, superimposed on the variable power-law of . Posssible origins for the soft X-ray lines include emission from distant photoionized gas (Pounds et al. 2004) or from the BLR or even the accretion disk (Ogle et al. 2004). The iron emission line is strong, the unresolved narrow core having an equivalent width of eV, and the broad line eV (against the direct continuum). The broad line is well fitted by a profile from a disk extending inwards to , with an emissivity profile of . The reflection component appears strong, with . The strength of the iron line and reflection may be due to the low continuum level of NGC 4051, if indeed the line/reflection component is not rapidly responding to the continuum flux (also see Ponti et al. 2006). The Suzaku spectrum suggests that not only is complex absorption required, as favoured by Pounds et al. (2004), but a broad emission line and an inner disk reflector are also present.
3.6 3C 120
The broad line radio galaxy 3C 120 (at ) was observed 4 times by Suzaku during 2006 in February and March, with a total net exposure of 145 ks with XIS. The spectrum can be well modeled with an absorbed power-law of , a reflection component at high energies consistent with and both narrow and broad components of the iron line. The narrow line core is resolved, with a velocity width of 8200 km s-1 ( eV), which is broader than the typical uncertainties in the XIS response function width at 6 keV. This is consistent with the line width in the previous XMM-Newton observation (Ballantyne et al. 2004, Ogle et al. 2005). The line core could arise from the BLR or from the outer parts of the disk at . However there is also a highly broadened component to the line, as is evident in Figure 10, which was not so apparent in the XMM-Newton observation. The broad component is centered near 6.4 keV and has a FWHM of 62000 km s-1 (or eV). The line can be well modeled by a disk extending inwards to .

3.7 NGC 2110
The Compton-thin Seyfert 2 NGC 2110 (at z=0.0078) was observed by Suzaku in September 2005, for a net exposure of 100 ks (Figure 11) and at a very high flux level, of erg cm-2 s-1 (2-10 keV) or erg cm-2 s-1 (15-100 keV). A weak unresolved iron line was detected by Suzaku, at keV, with an equivalent width of eV. The stringent limit on the reflection component with HXD of implies an origin in Compton-thin matter, while the high energy cut-off is restricted to keV. No diskline component appears to be present in this source, down to an upper-limit of 10 eV (assuming diskline parameters of 6.40 keV rest frame energy, , emissivity and inclination 45∘). Thus NGC 2110 appears to be the only AGN here which does not show a broad / relativistic iron line, or show evidence of reflection.
4 Discussion and Conclusions
The Suzaku observations confirm the existence of the relativistic iron line in 6 out of the 7 Seyfert galaxies. All of the AGN with broad iron K lines have detections of strong Compton reflection components in the HXD data, consistent with the broad line originating in Compton-thick matter such as the accretion disk. The only Seyfert galaxy without a broad iron line is NGC 2110, which also does not appear to show any evidence of reflection, down to a tight limit of . Importantly the broad band-pass of Suzaku makes it possible to resolve any degeneracies in modelling the iron K line profile. By accurately accounting for both the soft X-ray absorption and the reflection component, it is possible to derive the primary underlying continuum emission, which is crucial for modeling the broad red-wing of the iron line. While complex ionized absorption can have a substantial effect on the soft X-ray continuum, e.g. as discussed in NGC 3516, NGC 4051 and MCG -6-30-15, the broad iron K line is required as well. Importantly the reflection components detected in several of the AGN (e.g. MCG -6-30-15) appear too strong to originate purely from distant matter (such as the torus), as the narrow iron K line cores are relatively weak, a few tens of eV in equivalent width.
As would be expected given the previous observations with ASCA (Tanaka et al. 1995) or XMM-Newton (Fabian et al. 2002), MCG -6-30-15 shows the most extreme relativistic iron line profile, requiring the inner radius of the accretion disk to extend to within of the black hole. Such a robust upper-limit to the innermost stable orbit of the disk constrains the spin of the black hole to , implying near maximal rotation. The fact that the reflection component in MCG -6-30-15 is so strong (), could suggest that the effects of General Relativity (GR) near the innermost stable orbit are important in the X-ray spectrum. For instance the light-bending model as proposed by Miniutti & Fabian (2004) would suppress the amount of continuum observed, if the continuum photons are bent away from the observer and towards the disk/black hole plane, thereby enhancing the relative strength of the reflection component.
The broad lines in NGC 3516 and NGC 4051 are consistent with disk emission extending inwards to the innermost stable orbit, i.e. at least in the Schwarzschild case or even for a Kerr metric. Although broad lines are required in MCG -5-23-16, NGC 2992 and 3C 120, the lines (typically 0.1c in FWHM) could be characterized by emission from a few tens of gravitational radii.
The presence of the narrow iron K line core appears to be ubiquitous, being detected in all of the spectra presented here. In some cases, the line core appears unresolved, which would suggest reprocessing in distant matter, such as the torus (Ghisellini, Haardt & Matt 1994), an outflow (Elvis 2000), or a bi-conical structure (Sulentic et al. 1998). In at least two cases (3C 120 and NGC 3516) the iron K line core is resolved, with a velocities consistent with the AGN BLR. In the example of NGC 2110, the narrow line must originate in transmission from Compton-thin matter, due to the lack of the reflection hump, while in MCG -5-23-16 the reflection component is strong and the unresolved line core is more likely to originate from scattering off distant Compton-thick matter. Thus while the detection of narrow Fe lines appears ubiquitous, the physical origin of the line may differ, or have contributions from different regions.
One of the strengths of Suzaku is that it is possible to study the spectral variability of AGN over a broad bandpass, enabling both the variability of the iron line and the reflection component above 10 keV to be measured. In the three examples discussed here, namely MCG -6-30-15, MCG -5-23-16 and NGC 4051, it appears that the iron line is less variable than the continuum. The unique aspect of Suzaku shows that the reflection hump is less variable than the continuum. For MCG -6-30-15, where a substantial proportion of the X-rays originate from radii closest to the black hole event horizon, the effect of GR could be important in dampening the amplitude of variability in the reflection component, as per the light bending model. Alternatively, in MCG -5-23-16 or NGC 4051, where the narrow cores of the iron K line are stronger, then the presence of a constant distant reflector could dilute any possible variability in the line or reflection hump. While the current observations do suggest that the iron line and reflected emission is not responding to the X-ray continuum level on short timescales, this does not exclude the possibility of short-term variations which are not correlated with continuum flux. For instance, short-lived, transient redshifted iron emission line features have been detected in several AGN (e.g. Turner et al. 2002; Iwasawa, Miniutti & Fabian 2005), albeit at modest statistical significances. Thus it will be important to monitor variations in the iron line and reflection component in time as well as with continuum flux.
Acknowledgements.
We would like to thank the entire Suzaku Science Working Group for their contribution towards the mission. In particular the hard work of all the instrument teams is acknowledged, who have made all these observations possible.References
- [1] Ballantyne, D., Fabian, A.C., Iwasawa, K.: 2004, MNRAS 354, 839
- [2] Elvis, M.: 2000, ApJ 545, 63
- [3] Fabian, A.C., Rees, M.J., Stella, L., White, N.E.: 1989, MNRAS 238, 729
- [4] Fabian, A.C., Vaughan, S., Nandra, K., et al.: 2002, MNRAS 335, L1
- [5] George, I.M., Fabian, A.C.: 1991, MNRAS 249, 352
- [6] Gruber, D.E., Matteson, J.L., Peterson, L.E., Jung, G.V: 1999, ApJ 520, 124
- [7] Ghisellini, G., Haardt, F., Matt, G.: 1994, MNRAS 267, 743
- [8] Iwasawa, K., Miniutti, G., Fabian, A.C.: 2004, MNRAS 355, 1073
- [9] Koyama, K., Tsunemi, H., Dotani, T., et al.: 2006, PASJ, submitted
- [10] Markowitz, A., Reeves, J.N., Serlemitsos, P., et al.: 2006, AN, this issue
- [11] Markwardt, C.B., Tueller, J., Skinner, G.K., Gehrels, N., Barthelmy, S.D., & Mushotzky, R.F.: 2005, ApJ 633, L77
- [12] Matt, G.: 2002, MNRAS 337, 147
- [13] Miniutti, G., Fabian, A.C., Anabuki, N., et al.: 2006, PASJ, in press
- [14] Miniutti, G. Fabian, A.C.: 2004, MNRAS 349, 1435
- [15] Mitsuda, K., Bautz, M., Inoue, H., et al.: 2006, PASJ, submitted
- [16] Nandra, K., George, I.M., Mushotzky, R.F., Turner, T.J., Yaqoob, T.: 1997, ApJ 477, 602
- [17] Ogle, P.M., Davis, S.W., Antonucci, R.R.J., et al: 2005, ApJ 618, 139
- [18] Ogle, P.M., Mason, K.O., Page, M.J., et al.: 2004, ApJ, 606, 151
- [19] Page, K.L., O’Brien, P.T., Reeves, J.N., Turner, M.J.L.: 2004, MNRAS 347, 316
- [20] Ponti, G., Miniutti, G., Cappi, M., Maraschi, L., Fabian, A.C., Iwasawa, K.: 2006, MNRAS 368, 903
- [21] Peterson, B.M., Ferrarese, L., Gilbert, K.M., et al.: 2004, ApJ 613, 682
- [22] Pounds, K.A., Nandra, K., Stewart, G.C., George, I.M., & Fabian, A.C.: 1990, Nature 344, 132
- [23] Pounds, K.A., Reeves, J.N., King, A.R., Page, K.L.: 2004, MNRAS 350, 10
- [24] Reeves, J.N., Awaki, H., Dewangan, G., et al.: 2006, PASJ, submitted
- [25] Reeves, J.N., Nandra, K., George, I.M., Pounds, K.A., Turner, T.J., & Yaqoob, T.: 2004, ApJ 602, 648
- [26] Reynolds, C.S.: 1997, MNRAS 286, 513
- [27] Ross, R.R. Fabian, A.C.: 2005, MNRAS 358, 211
- [28] Serlemitsos, P.J., Soong, Y., Chan, K. et al.: 2006, PASJ, submitted
- [29] Sulentic, J.W., Marziani, P., Zwitter, T., Calvani, M., Dultzin-Hacyan, D.: 1998, ApJ 501, 54
- [30] Takahashi, T., Abe, K., Endo., M., et al.: 2006, PASJ, submitted
- [31] Tanaka, Y., Nandra, K., Fabian, A.C., et al.: 1995, Nature 375, 659
- [32] Terada, Y., Mihara, T., Nakajima, M., et al.: 2006, ApJ, 648, L139
- [33] Turner, A.K., Fabian, A.C., Lee, J.C., Vaughan, S.: 2004, MNRAS 353, 319
- [34] Turner, T.J., Kraemer, S.B., George, I.M., Reeves, J.N., Bottorff, M C.: 2005, ApJ 618, 155
- [35] Turner, T.J., Mushotzky, R., Yaqoob, T., et al.: 2002, ApJ 574, L123
- [36] Vaughan, S. Fabian, A.C.: 2004, MNRAS 348, 1415
- [37] Yaqoob, T., Murphy, K.D., Griffiths, R., et al., 2006, PASJ, submitted
- [38] Yaqoob, T., Padmanabhan, U.: 2004, ApJ 604, 63
- [39] Young, A.J., Lee, J.C., Fabian, A.C., Reynolds, C.S., Gibson, R.R., Canizares, C.R.: 2005, ApJ 631, 733