Hubble Space Telescope Ultraviolet Spectroscopy of Fourteen Low-Redshift Quasars111Based on observations made with the NASA/ESA Hubble Space Telescope, which is operated by the Association of Universities for Research in Astronomy, Inc., under NASA contract NAS 5-26555.
Abstract
We present low-resolution ultraviolet spectra of 14 low redshift () quasars observed with HST/STIS as part of a Snap project to understand the relationship between quasar outflows and luminosity. By design, all observations cover the C IV emission line. Nine of the quasars are from the Hamburg-ESO catalog, three are from the Palomar-Green catalog, and one is from the Parkes catalog. The sample contains a few interesting quasars including two broad absorption line (BAL) quasars (HE 0143-3535, HE 0436-2614), one quasar with a mini-BAL (HE 1105-0746), and one quasar with associated narrow absorption (HE 0409-5004). These BAL quasars are among the brightest known (though not the most luminous) since they lie at . We compare the properties of these BAL quasars to the Palomar-Green and Large Bright Quasar samples. By design, our objects sample luminosities in between these two surveys, and our four absorbed objects are consistent with the relation derived by Laor & Brandt (2002). Another quasar, HE 0441-2826, contains extremely weak emission lines and our spectrum is consistent with a simple power-law continuum. The quasar is radio-loud, but has a steep spectral index and a lobe-dominated morphology, which argues against it being a blazar. The unusual spectrum of this quasar resembles the spectra of the quasars PG 1407+265, SDSS J1136+0242, and PKS 1004+13 for which several possible explanations have been entertained.
1 Introduction
Outflows from active galactic nuclei (AGN) come in many observational classes. Seyfert galaxies show blue shifted UV and X-ray absorption lines hundreds of km s-1 wide (Crenshaw et al., 1999), while the UV troughs of quasar outflows can span tens of thousands of km s-1 as manifested in broad absorption line (BAL) quasars (Lynds, 1967; Weymann et al., 1985; Turnshek et al., 1988). One of the current driving questions in the AGN field is what is the connection, if any, between the intrinsic luminosity of an AGN and the kinematic properties of the outflow (e.g., terminal velocity and velocity-width of the observed trough).
Radiative acceleration, thought to be the principal driver of such outflows, predicts that the terminal velocity should scale as where (Arav, Li, & Begelman, 1994). Qualitatively, such a progression is likely to exist given the observed fact that outflow in Seyfert galaxies terminate at km s-1, while the BAL outflows extend out to km s-1. However, the quantitative trend is unclear given the lack of objects in between these populations. From an analysis of archived Hubble Space Telescope (HST) and International Ultraviolet Explorer (IUE) spectra of quasars from the Palomar-Green survey, Laor & Brandt (2002) showed that such a trend may indeed exist. The soft X-ray weak (SXW, defined as ) quasars, which exhibit BALs in their UV spectra, show a relation of the form .
This is a higher power-law index than predicted and implies that the radiation-pressure force multiplier has a luminosity dependence (Laor & Brandt, 2002). The force multiplier (Castor, Abbott, & Klein, 1975) is factor that expresses the sum total effect of all lines and edges in transferring momentum from the incident spectrum of photons to the gas. The luminosity dependence of the force multiplier arises from a variety of sources like the dust content and ionization state of the gas (e.g., Arav et al., 1994; Murray et al., 1995; Sulentic et al., 2006). Indeed, considerations of accretion disk-winds by Murray et al. (1995) in both the context of the broad emission-lines and broad absorption-lines require the presence of shielding gas that prevents X-rays from over-ionizing the outflowing gas. More recent considerations of the force multiplier show that it is also sensitive to black-hole mass (Proga & Kallman, 2004), which then favors a steeper index than predicted by Arav et al. (1994). The Laor & Brandt (2002) index is also consistent with the prediction from Proga, Stone, & Drew (1998) for AGN with , where is the maximum value of the force multiplier.
Another crucial issue is whether the fraction of objects that show intrinsic absorption is luminosity dependent. Here we are facing a large gap between the established statistics for BAL quasars (see below) and the results from a biased sample of Seyferts which showed that 10 out of the available 17 HST/UV spectra of Seyferts show intrinsic absorption (Crenshaw et al., 1999). Kriss (2002) find a that a similar fraction of Seyferts (16/34) exhibit absorption in the O VI 1031.926,1037.617 doublet. At low-redshift, Ganguly et al. (2001) found about % of quasars from the HST Quasar Absorption Line Key Project appear to show absorption at (i.e., “associated” absorption), comparable to the study of Laor & Brandt (2002) for the Palomar-Green quasars. However, it must be noted that not all absorption found near quasars is necessarily intrinsic, and moreover, not necessarily part of an outflow. A follow-up study of low-redshift quasars with associated absorption showed that only % were time-variable (Wise et al., 2004). Furthermore, large statistical studies of absorption in quasars, like the HST Quasar Absorption Line Key Project, tend to be biased toward UV bright targets in order to obtain adequate signal-to-noise spectra.
For high-redshift quasars () intrinsic absorption (usually BALs) has been studied in large samples using ground-based telescopes. The Large Bright Quasar Survey (Hewett et al., 1995) members at these redshifts have to and an intrinsic fraction of BAL quasars, in the redshift range , of % (Hewett & Foltz, 2003). The FIRST Bright Quasar Survey (White et al., 2000; Becker et al., 2001) members have to and a BAL incidence of 18% (Becker et al., 2000). Vestergaard (2003) find that about 25% of quasars show evidence for intrinsic, low-velocity C IV absorption from a careful consideration of possible contamination from intervening systems in a heterogenous, yet large, sample of moderate redshift () quasars. In addition, Richards (2001) find that, in C IV absorption systems observed toward FIRST quasars at large velocity separations, as many as 30% may be intrinsic to the background quasars. Such systems must clearly arise in a high-velocity outflow.
The relationship between the velocity of AGN outflows and their intrinsic luminosity, as well as the fraction of objects that show outflows, are poorly known due to two simple selection effects. The vast majority of AGN outflows are identified by detecting absorption features associated with the C IV 1548.20, 1550.77 doublet. From ground-based observations this line is only observed in objects with redshift and therefore the population observed tends to be the higher luminosity quasars, of which 10% are BAL quasars. In order to observe objects with we must use space-based UV observatories. Only 20 of the UV brightest AGN which were observed with the HST (out of 70) show evidence for outflows, compared with upwards of 500 BAL quasars identified in ground-based observations. The statistics are especially poor for the luminosity range erg s-1 to erg s-1 (corresponding roughly to the absolute magnitude range ).
To fill in this dearth of data, we proposed an HST Snap project to obtain low-dispersion STIS UV spectra of intermediate-luminosity AGN. Unfortunately, the low efficiency of this program only yielded observations of fourteen objects out of 200 approved targets, and we present the data here. Several of the objects are of individual interest based on their absorption properties. In the next section (§2), we present the spectra obtained and discuss our data reduction. In §3, we present our results and compare them with those from other quasar samples. We briefly summarize our findings in §4.
2 Data
Our HST/STIS (Woodgate et al., 1998; Kimble et al., 1998) observations were carried out using the G230L grating and the 52″0.5″slit which provides spectra over the wavelength range 1570-3180 Å at a dispersion of 1.58 Å/pixel (and a 2 pixel per resolution element sampling rate). For these Snap observations, we used exposure times of 900s with three exceptions.. We used an exposure time of 720s seconds for the quasars HE 0354-5500, HE 0436-2614, and PG 1435-067. (These three quasars were part of the bright end of our initial list of 200 targets, defined as objects with , and therefore did not require a full 900s exposure.)
We used the standard pipeline which provides fully reduced and calibrated spectra. According to the STIS Instrument Handbook (Kim-Quijano et al., 2003), data reduced using the pipeline have the following calibration uncertainties: 0.5-1.0 pixels (0.79–1.58 Å) in absolute wavelength calibration, and 4% (0.02 dex) in absolute spectrophotometry. The S/N for our spectra were typically 14 per pixel at 2000 Å and 3000 Å.
Figure 1 shows the spectra obtained for our
program. The data are publicly available both at the Multi-mission
Archive at Space Telescope
(MAST:
http://archive.stsci.edu/index.html, fits files only) and at
the University of Wyoming AGN Research Group web site
(http://physics.uwyo.edu/agn, both fits and ascii
files).
3 Results
3.1 Sample Characteristics
To characterize this sample and place it in context with larger samples of low-redshift quasars, we carried out power-law fits to all spectra with the goal of computing UV spectral slopes and luminosities. The fits were carried out using an arbitrary number of superposed Gaussian to mimic the contribution from emission lines. That is, we fit the following functional form to our spectra:
| (1) |
where is the normalizing flux at reference wavelength , is the spectral index, is the number of emission-line components each with a relative strength , width , and centered at wavelength . The best-fit was determined using the Numerical Recipes Marquardt-Levenburg -minimization routines (Press et al., 1992), and optimal number of Gaussian components was determined using an F-test. In carrying out the fits, we omitted regions that were clearly, or potentially, affected by absorption (as subjectively determined by RG). The results of the power-law fits are listed in Table 1 and overlayed on the observed spectra in Figure 1. For uniformity, we used a common (observer’s frame) reference wavelength, Å for all fits. Table 1 lists the quasar name (column 1), quasar redshift (, column 2), continuum flux density at 1800 Å (, column 3), continuum power-law index (, column 4, with the sign convention ), the luminosity at rest-frame wavelength Å (, column 5), and the C IV emission-line equivalent width for unabsorbed quasars (column 6). We note that in a few cases (e.g, PG 2233+134) where the spectra cover wavelengths redward of the Al III + C III] emission line, the continuum fit can be artificially elevated due to the presence of Fe II-III emission (Vestergaard & Wilkes, 2001). The observer-frame flux density at observed wavelength was converted to rest-frame luminosity at rest-wavelength via:
where is the luminosity distance to the quasar, and we have used the continuum portion of the eq. 1 in the second substitution. For clarity, we have used (primed) to indicate the flux in the observer-frame (which is the flux derived using eq. 1), and (unprimed) to indicate the flux in the rest-frame. The luminosity distance was computed using the listed quasar redshift and a , , H km s-1Mpc-1 cosmology. The mean luminosity of the sample is erg s-1, and has a range spanning (0.3–31.4) erg s-1. Our fits imply a mean spectral index of , with a standard deviation in the distribution of .
In Figure 2, we show the region around the C IV emission line for all 14 quasars. Several quasars show absorption on top of the emission line, but most of these are identified with Galactic lines from Fe II and Mg II as indicated in the figure. Four quasars do appear to show intrinsic or associated C IV absorption and we discuss these in the following sections.
3.2 Absorbed Quasars
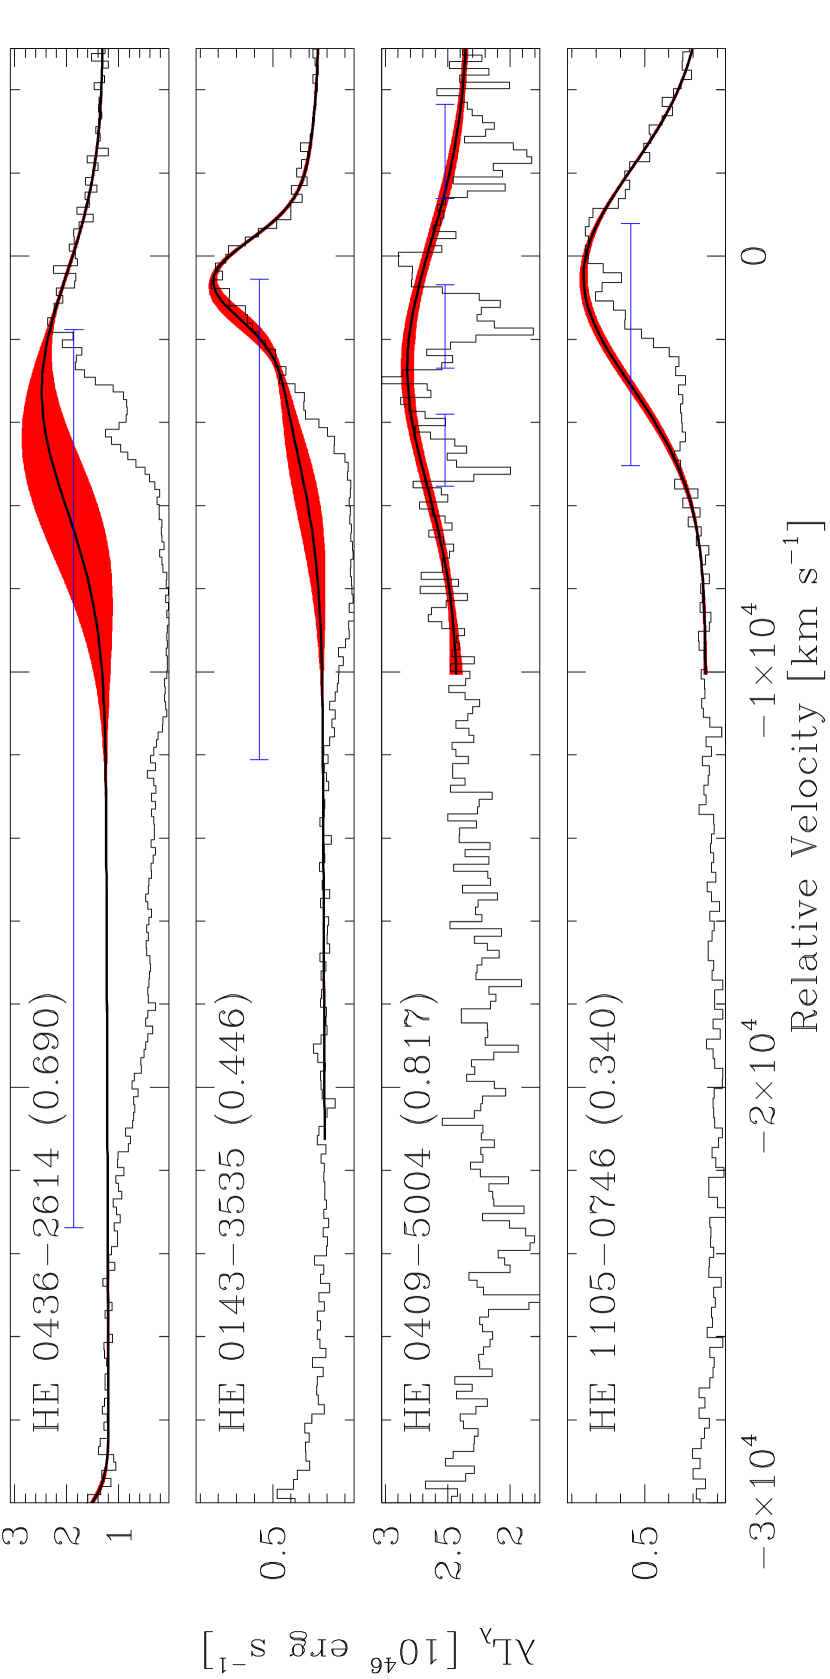
Four of the 14 quasar spectra appear to show intrinsic/associated C IV absorption: HE 0143-3535, HE 0409-5004, HE 0436-2614, and HE 1105-0746. Figure 3 shows the spectra as luminosity versus rest-wavelength, and ordered (top to bottom) by decreasing maximum ejection velocity of absorption. To characterize the absorption properties of these quasars, we carried out fits to the C IV emission line. We took the same approach as in the previous section, and the fits are also shown (with the statistical uncertainty) in the figure. These fits allowed us to compute the following properties which are listed in Table 2: Balnicity Index (column 2; Weymann et al., 1991), Intrinsic Absorption Index (column 3; Hall et al., 2002), C IV absorption equivalent width (column 4), Maximum velocity of absorption (column 5).
We note that the fits use the minimum number of Gaussian components and, as a result, there may be some systematic uncertainties. In particular, for the two BAL quasars, HE 0143-3535 and HE 0436-2614, if there is significant asymmetry in the intrinsic emission-line profiles (e.g., Wills et al., 1993; Brotherton et al., 1994; Richards et al., 2002, and references therein), it is possible that our fits do not fully recover the correct shape. Parameters such as balinicity index that depend on the power-law fit only should not be affected by the systematics of trying to reproduce the emission-line profile.
3.3 Comparison To Other Samples
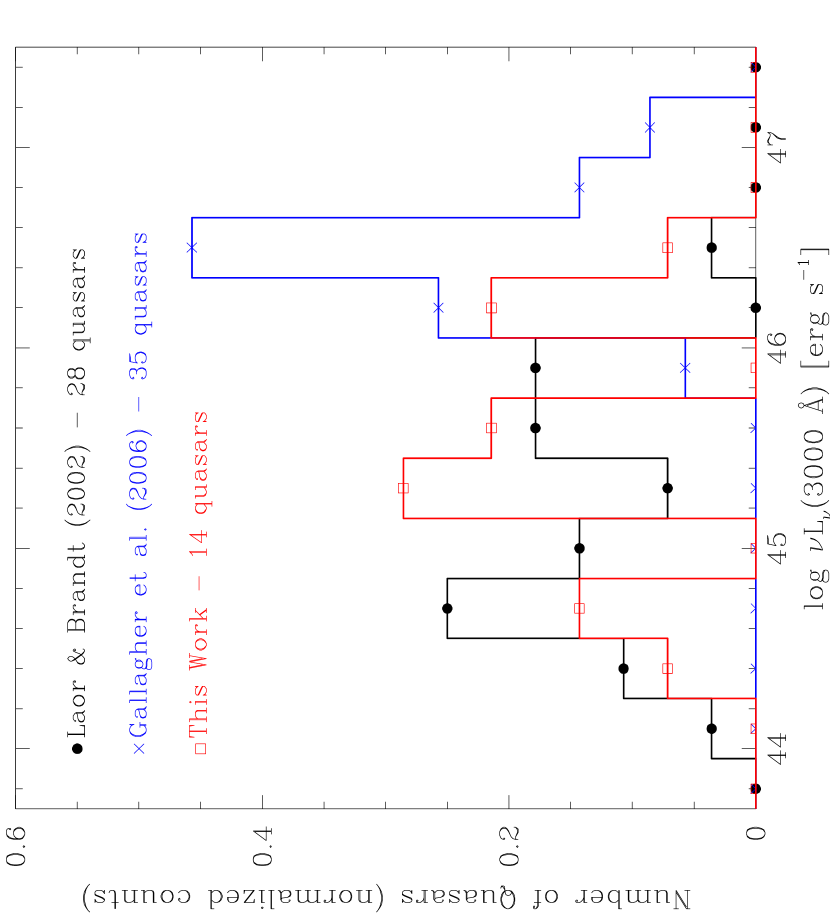
Figure 4 shows a comparison of the quasar luminosities from this sample to quasars in the Bright Quasar Survey (BQS, Brandt, Laor, & Wills, 2000; Boroson & Green, 1992; Schmidt & Green, 1983) and broad absorption-line quasars from the Large Bright Quasar Survey (LBQS, Gallagher et al., 2006; Hewett & Foltz, 2003; Hewett et al., 1995). For the LBQS, we restrict the comparison of the luminosity distribution to the subsample of absorbed quasars from Gallagher et al. (2006) since this is the most interesting aspect of our initial survey. While the entire LBQS sample does extend down to , good ground-based spectroscopic observations of C IV spectral region are available only for where the UV doublet shifts into the optical band. The luminosities of our quasar sample lie in between these two surveys, though with some overlap with the low-redshift BQS.
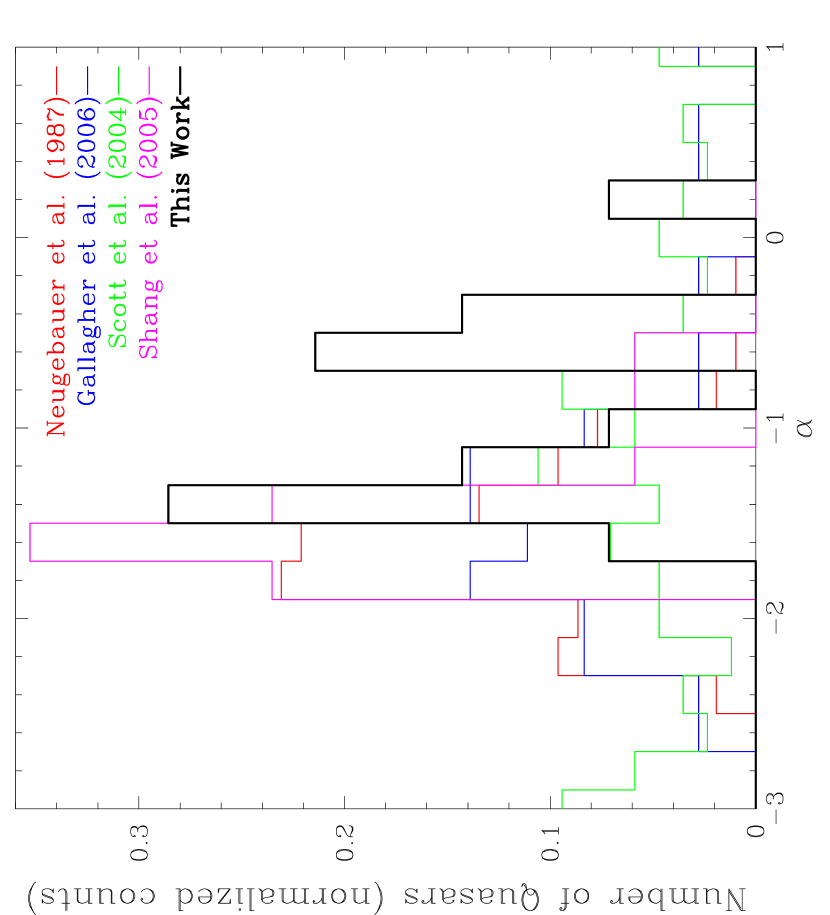
Figure 5 shows a comparison of our quasar spectral indices to several other samples: Palomar-Green quasars from Neugebauer et al. (1987), Large Bright Quasar Survey BAL quasars from Gallagher et al. (2006), quasars used in the FUSE composite by Scott et al. (2004), and quasars from Shang et al. (2005). In general, there is agreement between the comparison samples (and in particular between the Palomar-Green, absorbed LBQS, and Shang et al. (2005) samples), with a peak near . Scott et al. (2004) show a correlation between the spectral index and luminosity, with more luminous objects having bluer spectra. This correlation nicely explains the difference in shape between the FUSE composite and the EUV portion of the HST composite spectrum from Telfer et al. (2002). The spectral indices derived for the quasars in our samples tend to be redder than those samples, with a peak near , and an aforementioned mean of .
One potential explanation for this is the effect of reddening. Galactic reddening is an unlikely explanation, as the largest color excess in our sample is E() toward PG , and HE . Baskin & Laor (2005) note that quasars (particularly from the BQS) appear redder (as measured by a two-point spectral index between 1549 Å and 4861 Å) as more intrinsic C IV absorption is present, implying that intrinsic dust is present along sight-lines that also produce intrinsic C IV absorption. While intrinsic reddening may be important (Gaskell et al., 2004; Gaskell & Benker, 2006), it is unlikely to be the source of reddening in our quasars, as our three reddest quasars (PG 1552+085, HE 1101-0959, and PG 1435-067) do not show intrinsic C IV absorption. In addition, our quasars are generally redder than the LBQS BAL quasars from Gallagher et al. (2006), although this may arise from the luminosity effect described by Scott et al. (2004).
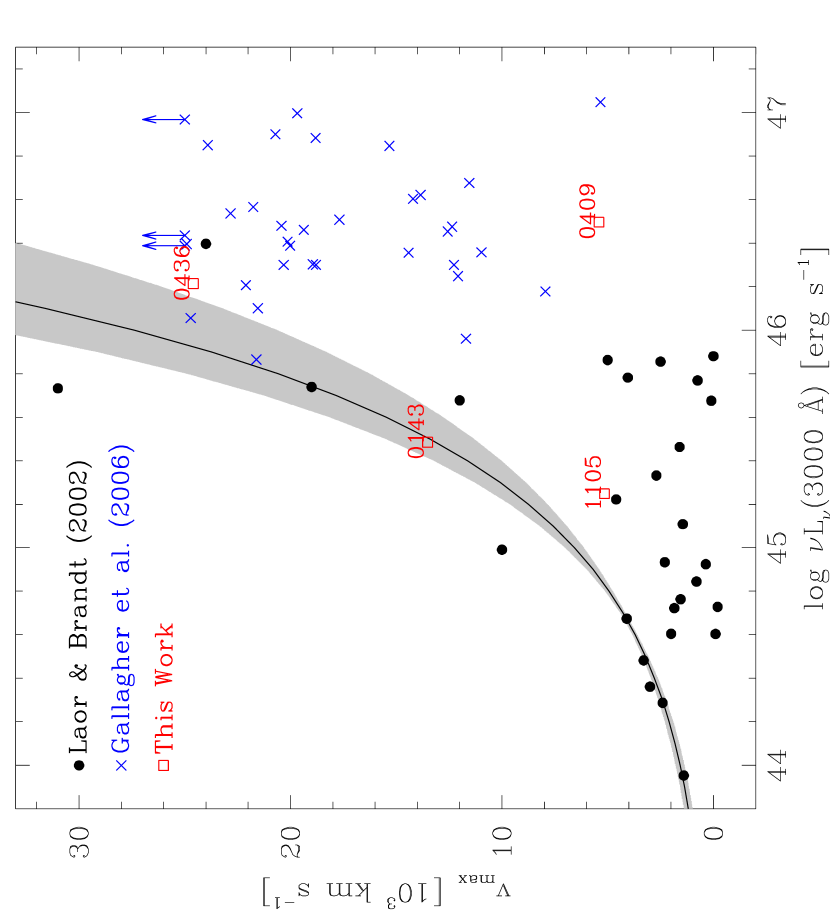
Since one of our initial goals was to test the radiative-driving hypothesis for quasar winds, we show in Figure 6 a plot of the maximum velocity of absorption against luminosity for our absorbed quasars, the BQS quasars from Laor & Brandt (2002), and the LBQS BAL quasars from Gallagher et al. (2006). From a consideration of soft X-ray weak quasars in the BQS sample, Laor & Brandt (2002) reported an apparent envelope to the maximum velocity of absorption as a function of luminosity (specifically , but see also Gallagher et al., 2006, for a plot versus 2500 Å luminosity). We reproduce the Laor & Brandt (2002) plot, revised for a concordance cosmology, with the four quasars from this work also shown. The two BAL quasars from this sample, HE 0143-3535 and HE 0436-2614, both seem to lie close to the (cosmology corrected) best-fit curve derived by Laor & Brandt (2002):
| (3) |
The other two absorbed quasars, like most of the absorbed BQS quasars lie below this curve. There are several potential explanations for this. Since the measured velocities only measure the line-of-sight component and not the transverse (i.e., in the plane of the sky) component, the scatter below this curve is possibly explained by orientation effects. In addition, other driving mechanisms, such as magnetocentrifugal accretion disk winds (Everett, 2005) or thermally-driven winds (Krolik & Kriss, 2001), may be important for absorbers at lower velocities. At very low velocities, the absorbers may not even arise from an outflowing wind. They may arise from satellite galaxies around the quasar host galaxies, or even from the interstellar medium of the host galaxy (e.g., Ganguly et al., 2006; Hamann et al., 2001).
3.4 Notes on Individual Quasars
HE 0143-3535: This is one of two BAL quasars in the sample. The BAL is detected clearly in both C IV and N V. It is marginally detected in H I Ly- in a relatively low signal-to-noise () region of the spectrum. Reproduction of the C IV emission-line for this quasar is problematic (Figure 3). Our best-fit requires two components, a strong narrow component and a broad weaker component, as motivated by an inflection on the red wing that cannot be produced by a single Gaussian component. The components are offset by 1441 km s-1, implying significant asymmetry. The uncertainty in the shape of the emission-line, and consequently the uncertainty in the C IV absorption equivalent width is significant. Regardless, if our assessment of the C IV absorption equivalent width is accurate, then this quasar may be significantly absorbed in the soft X-ray band. Furthermore, if the shape of the C IV emission line is accurate, then the absorption profile is consistent (within errors) of occulting the UV continuum only.
HE 0409-5004: Three absorption doublets appear on the weak C IV emission-line of this quasar, which is well-fit by a single Gaussian. Two of those are the Mg II 2796,2803 doublet at (i.e., Galactic absorption) and . The third doublet, which appears blueward of the other two, is an associated narrow C IV absorber at with a velocity offset of km s-1 from the emission redshift of the quasar. The absorption-line system is also detected in H I Ly-. The N V 1238, 1242 and O VI 1031, 1038 doublets are in our wavelength range, but neither is detected. We do detect absorption from low-ionization species, C II, S II-III, the Lyman- line, and possibly the Lyman limit. This implies that the gas is in a relatively low-ionization state (compared to other associated narrow absorption-line systems). Thus, it is possible that this system, while close in velocity, is not physically linked with the quasar central engine.
HE 0436-2614: This quasar is the second in the sample that hosts a BAL. The BAL absorption in this quasar in very strong. The wavelength range of our spectrum gives us coverage down to the O VI 1031, 1038 doublet. We detect broad absorption from C IV, Si IV, N V, H I Ly-, P V, and O VI. The detection of P V, which has a low relative abundance, implies a combination of high column density in the flow and, perhaps, high metallicity (Hamann, 1998). In the C IV BAL profile, there appears to be a curious transition in the apparent strength of the absorption (whether from coverage fraction or column density effects) around km s-1 where the emission line appears to terminate (Figure 3). Redward of this velocity (i.e., closer to the emission line), the absorption appears to be completely saturated with full coverage of both the continuum and broad emission-line regions. In the velocity range [ km s-1], the absorption appears to a have a flat bottom with a normalized flux of (in units of the continuum emission-line flux). In the velocity range [ km s-1], the profile is also flat-bottomed, but with a normalized flux of . Blueward of km s-1, the absorption tapers off (either due to coverage fraction change or column density change) to no apparent absorption at km s-1.
HE 0441-2826: The spectrum of this quasar is peculiar. The C IV emission-line is very weak (% of the continuum strength, the lowest of the sample), and the spectrum is consistent with a simple power-law with Galactic Fe II and Mg II absorption. [The redshift of the quasar is known from optical emission lines, so we are secure in the identification of this UV line as C IV.] In the rest-frame of the quasar, the spectrum covers the wavelength range 1376–2726 Å. This range also covers the Si IV 1393, 1402 doublet, the Al III 1855, 1863 + C III] 1909 blend and some of the Fe II UV multiplet, but these are not significantly detected. The quasar is detected in the NRAO-VLA Sky Survey (Condon et al., 1998) with a 1.4 GHz flux of mJy, and a radio core fraction of . The quasar is also listed in the Parkes-MIT-NRAO survey catalog (PMN J) with a 4.85 GHz flux of mJy. We conclude that the quasar has a radio-loudness (Kellermann et al., 1994) of , and a radio spectral index of (). While a weak/absent emission lines may be indicative of a blazar, the marginal radio-loudness, steep radio spectral index, and lobe-dominated morphology seem to rule this out. Alternatively, this quasar could be in the class of unusual emission-line objects that includes the radio-quiet PG 1407+265 (; McDowell et al., 1995), the radio-loud SDSS J1136+0242 (; Hall et al., 2004), and possibly the intrinsic spectrum of the radio-loud BAL PKS 1004+13 (; Wills et al., 1999). These objects have very weak/absent and highly-blueshifted high-ionization emission lines.
HE 1105-0746: Our spectrum of this quasar covers the rest-frame wavelength range 1187–2350 Å, and the H I Ly- + N V, Si IV, C IV, He II, and Al III + C III] emission lines are clearly visible. The C IV emission-line is well described by a single Gaussian, and part of the blue wing of the C IV emission-line of this quasar appears to be absorbed. This absorption lies above the continuum and therefore the quasar has a zero balnicity. However, the width of the absorption is broader than the C IV doublet separation, so this is an example of a so-called mini-BAL. While the absorption does not dip below the continuum, the maximum depth of the absorption is equal to the strength of the continuum. That is, this mini-BAL is consistent with saturated absorption of the continuum, and no absorption of the C IV broad emission line. This has been observed before in BALs (e.g., Arav et al., 1999). Curiously, we do not detect mini-BAL absorption in N V or Si IV. The lack of Si IV absorption may be an ionization effect. The lack of N V absorption may be due to a combination of the noisiness of the spectrum in the wavelength region and dilution by the strong H I Ly- line if indeed the absorber does not occult the broad emission-line region.
PG 1552+085: Based on an IUE spectrum, Turnshek et al. (1997) claimed that this quasar was host to a BAL. However, a more recent analysis by Sulentic et al. (2006) of the HST/STIS-G230L spectrum presented here yield a balnicity index of . The putative location of the C IV BAL through lies in a low signal-to-noise region of the spectrum and it is difficult to ascertain if the continuum blueward of the C IV broad emission-line is absorbed.
4 Summary
While our initial survey was designed to fill in the statistical gap between luminous quasars and Seyfert galaxies to further understand the relationship between outflows and luminosity, the low-efficiency of the program did not make this feasible. Out of the approved list of 200 targets, only fourteen objects were observed. The observations of fourteen nearby bright AGN resulted in the discovery of a few interesting objects which merit further study: two new, bright BAL quasars, one new mini-BAL quasar, and one quasar with unusually weak emission lines. Our observations are in agreement with -luminosity relation reported by Laor & Brandt (2002), and do lie in between the BQS and LBQS samples.
References
- Arav et al. (1999) Arav, N., Becker, R. H., Laurent-Muehleisen, S. A., Gregg, M. D., White, R. L., Brotherton, M. S., & de Kool, M. 1999, ApJ, 524, 566
- Arav et al. (1994) Arav, N., Li, Z.-Y., & Begelman, M. C. 1994, ApJ, 432, 62
- Baskin & Laor (2005) Baskin, A., & Laor, A. 2005, MNRAS, 356, 1029
- Becker et al. (2000) Becker, R. H., White, R. L., Gregg, M. D., Brotherton, M. S., Laurent-Muehleisen, S. A., & Arav, N. 2000, ApJ, 538, 72
- Becker et al. (2001) Becker, R. H., et al. 2001, ApJS, 135, 227
- Boroson & Green (1992) Boroson, T. A., & Green, R. F. 1992, ApJS, 80, 109
- Brandt et al. (2000) Brandt, W. N., Laor, A., & Wills, B. J. 2000, ApJ, 528, 637
- Brotherton et al. (1994) Brotherton, M. S., Wills, B. J., Steidel, C. C., & Sargent, W. L. W. 1994, ApJ, 423, 131
- Castor et al. (1975) Castor, J. I., Abbott, D. C., & Klein, R. I. 1975, ApJ, 195, 157
- Condon et al. (1998) Condon, J. J., Cotton, W. D., Greisen, E. W., Yin, Q. F., Perley, R. A., Taylor, G. B., & Broderick, J. J. 1998, AJ, 115, 1693
- Crenshaw et al. (1999) Crenshaw, D. M., Kraemer, S. B., Boggess, A., Maran, S. P., Mushotzky, R. F., & Wu, C. 1999, ApJ, 516, 750
- Everett (2005) Everett, J. E. 2005, ApJ, 631, 689
- Gallagher et al. (2006) Gallagher, S. C., Brandt, W. N., Chartas, G., Priddey, R., Garmire, G. P., & Sambruna, R. M. 2006, ApJ, 644, 709
- Ganguly et al. (2001) Ganguly, R., Bond, N. A., Charlton, J. C., Eracleous, M., Brandt, W. N., & Churchill, C. W. 2001, ApJ, 549, 133
- Ganguly et al. (2006) Ganguly, R., Sembach, K. R., Tripp, T. M., Savage, B. D., & Wakker, B. P. 2006, ApJ, 645, 868
- Gaskell et al. (2004) Gaskell, C. M., Goosmann, R. W., Antonucci, R. R. J., & Whysong, D. H. 2004, ApJ, 616, 147
- Gaskell & Benker (2006) Gaskell, C. M., & Benker, A. J. 2006, ApJ, submitted
- Hall et al. (2002) Hall, P. B., et al. 2002, ApJS, 141, 267
- Hall et al. (2004) Hall, P. B., et al. 2004, AJ, 127, 3146
- Hamann (1998) Hamann, F. 1998, ApJ, 500, 798
- Hamann et al. (2001) Hamann, F. W., Barlow, T. A., Chaffee, F. C., Foltz, C. B., & Weymann, R. J. 2001, ApJ, 550, 142
- Hewett & Foltz (2003) Hewett, P. C., & Foltz, C. B. 2003, AJ, 125, 1784
- Hewett et al. (1995) Hewett, P. C., Foltz, C. B., & Chaffee, F. H. 1995, AJ, 109, 1498
- Kellermann et al. (1994) Kellermann, K. I., Sramek, R. A., Schmidt, M., Green, R. F., & Shaffer, D. B. 1994, AJ, 108, 1163
- Kim-Quijano et al. (2003) Kim-Quijano, J., et al. 2003, STIS Intrument Handbook, Version 7.0 (Baltimore: STScI)
- Kimble et al. (1998) Kimble, R. A., et al. 1998, in Proc. SPIE Vol. 3356, p. 188-202, Space Telescopes and Instruments V, Pierre Y. Bely; James B. Breckinridge; Eds., 188
- Kriss (2002) Kriss, G. A. 2002, in ASP Conf. Ser. 255: Mass Outflow in Active Galactic Nuclei: New Perspectives, ed. D. M. Crenshaw, S. B. Kraemer, & I. M. George (San Francisco: ASP), 69
- Krolik & Kriss (2001) Krolik, J. H., & Kriss, G. A. 2001, ApJ, 561, 684
- Laor & Brandt (2002) Laor, A., & Brandt, W. N. 2002, ApJ, 569, 641
- Lynds (1967) Lynds, C. R. 1967, ApJ, 147, 396
- McDowell et al. (1995) McDowell, J. C., Canizares, C., Elvis, M., Lawrence, A., Markoff, S., Mathur, S., & Wilkes, B. J. 1995, ApJ, 450, 585
- Murray et al. (1995) Murray, N., Chiang, J., Grossman, S. A., & Voit, G. M. 1995, ApJ, 451, 498
- Neugebauer et al. (1987) Neugebauer, G., Green, R. F., Matthews, K., Schmidt, M., Soifer, B. T., & Bennett, J. 1987, ApJS, 63, 615
- Press et al. (1992) Press, W. H., Teukolsky, S. A., Vetterling, W. T., & Flannery, B. P. 1992, Numerical recipes in C. The art of scientific computing (Cambridge: University Press, 1992, 2nd ed.)
- Proga & Kallman (2004) Proga, D., & Kallman, T. R. 2004, ApJ, 616, 688
- Proga et al. (1998) Proga, D., Stone, J. M., & Drew, J. E. 1998, MNRAS, 295, 595
- Richards (2001) Richards, G. T. 2001, ApJS, 133, 53
- Richards et al. (2002) Richards, G. T., Vanden Berk, D. E., Reichard, T. A., Hall, P. B., Schneider, D. P., SubbaRao, M., Thakar, A. R., & York, D. G. 2002, AJ, 124, 1
- Schmidt & Green (1983) Schmidt, M., & Green, R. F. 1983, ApJ, 269, 352
- Scott et al. (2004) Scott, J. E., Kriss, G. A., Brotherton, M., Green, R. F., Hutchings, J., Shull, J. M., & Zheng, W. 2004, ApJ, 615, 135
- Shang et al. (2005) Shang, Z., et al. 2005, ApJ, 619, 41
- Sulentic et al. (2006) Sulentic, J. W., Dultzin-Hacyan, D., Marziani, P., Bongardo, C., Braito, V., Calvani, M., & Zamanov, R. 2006, Revista Mexicana de Astronomia y Astrofisica, 42, 23
- Telfer et al. (2002) Telfer, R. C., Zheng, W., Kriss, G. A., & Davidsen, A. F. 2002, ApJ, 565, 773
- Turnshek et al. (1988) Turnshek, D. A., Grillmair, C. J., Foltz, C. B., & Weymann, R. J. 1988, ApJ, 325, 651
- Turnshek et al. (1997) Turnshek, D. A., Monier, E. M., Sirola, C. J., & Espey, B. R. 1997, ApJ, 476, 40
- Vestergaard (2003) Vestergaard, M. 2003, ApJ, 599, 116
- Vestergaard & Wilkes (2001) Vestergaard, M., & Wilkes, B. J. 2001, ApJS, 134, 1
- Weymann et al. (1991) Weymann, R. J., Morris, S. L., Foltz, C. B., & Hewett, P. C. 1991, ApJ, 373, 23
- Weymann et al. (1985) Weymann, R. J., Turnshek, D. A., & Christiansen, W. A. 1985, in Astrophysics of Active Galaxies and Quasi-Stellar Objects, ed. J. S. Miller, 333
- White et al. (2000) White, R. L., et al. 2000, ApJS, 126, 133
- Wills et al. (1999) Wills, B. J., Brandt, W. N., & Laor, A. 1999, ApJ, 520, L91
- Wills et al. (1993) Wills, B. J., Brotherton, M. S., Fang, D., Steidel, C. C., & Sargent, W. L. W. 1993, ApJ, 415, 563
- Wise et al. (2004) Wise, J. H., Eracleous, M., Charlton, J. C., & Ganguly, R. 2004, ApJ, 613, 129
- Woodgate et al. (1998) Woodgate, B. E., et al. 1998, PASP, 110, 1183


| Power-law fit | |||||||
|---|---|---|---|---|---|---|---|
| Quasar | Redshift | (1800 Å) | (3000 Å) | We(C IV) | |||
| ( erg cm-2 s-1 Å-1) | (log erg s-1) | (Å) | |||||
| HE 0143-3535 | 0.446 | 45.477 | 0.006 | ||||
| PKS 0252-549 | 0.539 | 45.260 | 0.006 | 107 | 5 | ||
| HE 0354-5500 | 0.267 | 45.103 | 0.003 | 33 | 2 | ||
| HE 0409-5004 | 0.817 | 46.493 | 0.003 | ||||
| HE 0436-2614 | 0.690 | 46.209 | 0.009 | ||||
| HE 0441-2826 | 0.155 | 45.207 | 0.001 | 3.5 | 0.9 | ||
| HE 0502-2948 | 0.552 | 46.107 | 0.002 | 35 | 1 | ||
| HE 1006-1211 | 0.693 | 46.172 | 0.003 | 36 | 2 | ||
| HE 1101-0959 | 0.186 | 44.439 | 0.009 | 140 | 7 | ||
| HE 1105-0746 | 0.340 | 45.236 | 0.004 | ||||
| PG 1435-067 | 0.126 | 44.794 | 0.010 | 168 | 8 | ||
| PG 1552+085 | 0.119 | 44.573 | 0.003 | 51 | 4 | ||
| PG 2233+134 | 0.325 | 45.458 | 0.003 | 7 | 1 | ||
| HE 2327-5522 | 0.494 | 45.595 | 0.006 | 119 | 5 | ||
Note. — For the power-law fit, we adopt the convention . The rest-frame luminosity at 3000 Å was computed assuming a , , km s-1 Mpc-1 cosmology. The quoted error in both flux and luminosity reflect statistical fitting uncertainties only. The error associated with the uncertainty in absolute flux calibration, which dominates the error in both flux and luminosity, is 4%, or 0.02 dex. For quasars that do not show intrinsic/associated absorption, we list the C IV emission line equivalent width [We(C IV)].
| Quasar | BI | AI | (C IV) | |||
|---|---|---|---|---|---|---|
| ( km s-1) | ( km s-1) | (Å) | ( km s-1) | |||
| HE 0143-3535 | 2829 | 3701 | 36 | 4 | 13519 | 207 |
| HE 0409-5004 | 1.4 | 0.3 | 5417 | 165 | ||
| HE 0436-2614 | 11592 | 12740 | 118 | 3 | 24595 | 177 |
| HE 1105-0746 | 8 | 1 | 5151 | 224 | ||
Note. — For the BAL QSOs, we report balnicity and intrinsic absorption indices as defined by Weymann et al. (1991) and Hall et al. (2002). We also provide an estimate of the observed C IV absorption equivalent width (). The quoted confidence error includes both statistical and effective-continuum fitting uncertainties.