High spatial resolution T-ReCS mid-infrared imaging of Luminous Infrared Galaxies
Abstract
We present diffraction-limited () Gemini/T-ReCS mid-infrared (MIR: -band or narrow-band at m) imaging of four Luminous Infrared Galaxies (LIRGs) drawn from a representative local sample. The MIR emission in the central few kpc is strikingly similar to that traced by Pa, and generally consists of bright nuclear emission and several compact circumnuclear and/or extranuclear H ii regions. The central MIR emission is dominated by these powerful H ii regions, consistent with the majority of AGN in this local sample of LIRGs contributing a minor part of the MIR emission. The luminous circumnuclear H ii regions detected in LIRGs follow the extrapolation of the m vs. Pa relation found for M51 H ii knots. The integrated central kpc of galaxies, however, present elevated m/Pa ratios with respect to individual H ii regions, similar to the integrated values for star-forming galaxies. Our results show that the diffuse m emission, not directly related to the ionizing stellar population, can be as luminous as that from the resolved H ii regions. Therefore, calibrations of the star formation rate for distant galaxies should be based on the integrated m emission of nearby galaxies, not that of the H ii regions alone.
Subject headings:
galaxies: evolution — galaxies: nuclei — galaxies: Seyfert — galaxies: structure — infrared: galaxies1. Introduction
There is growing interest in using the mid-infrared (MIR) emission of infrared (IR) selected distant galaxies as an indicator of the massive and dusty star formation rate (SFR), analogously to the widely used SFR vs. IR calibration of Kennicutt (1998). The unprecedented sensitivity provided by Spitzer observations reveals the good overall morphological correspondence between the ionized gas (i.e., H, Pa) and the MIR (m) emission of nearby galaxies (Helou et al. 2004; Hinz et al. 2004; Gordon et al. 2004; Calzetti et al. 2005, CAL05 hereafter). This suggests that the MIR emission could be used as an accurate SFR indicator, especially for dusty galaxies. For instance, CAL05 and Alonso-Herrero et al. (2006, AAH06 hereafter) for resolved H ii knots in M51 and for local Luminous Infrared Galaxies (LIRGs111, see Sanders & Mirabel (1996).) respectively, found that the m continuum emission is a good local SFR indicator (see also Wu et al. 2005). CAL05 and Pérez-González et al. (2006) questioned the use of the IRAC m continuum emission based on the larger scatter of the m vs. H (or Pa) relation for resolved H ii regions in nearby galaxies, whereas Wu et al. (2005) found a good correlation for local star-forming galaxies. This demonstrates the need for further investigation of this issue.
Although Spitzer provides highly sensitive imaging of LIRGs (Mazzarella et al. 2005), it cannot resolve the sizes of the MIR emitting regions. We present the results of a pilot study intended to understand the MIR properties of LIRGs at high spatial resolution (tens-hundreds of parsecs), using the Thermal-Region Camera Spectrograph (T-ReCS; Telesco et al. 1998) on the 8.1 m Gemini-South Telescope. We observed four LIRGs from the representative sample of 30 local () LIRGs of AAH06 which was drawn from the IRAS Revised Bright Galaxy Sample (RBGS, Sanders et al. 2003) such that the Pa (m) emission line could be observed with NICMOS on the Hubble Space Telescope (HST). Gemini/T-ReCS and the NICMOS NIC2 camera provide comparable spatial resolutions, and , respectively, making them ideal for this kind of study. Throughout this paper we use km s-1 Mpc-1, , and .
2. T-ReCS MIR Imaging Observations
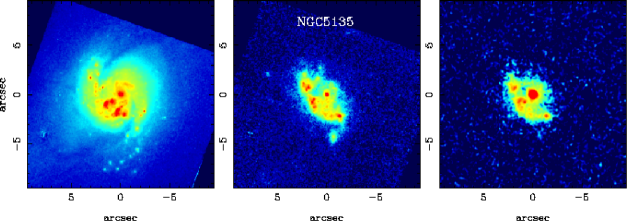
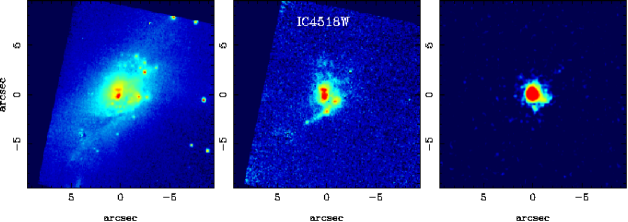
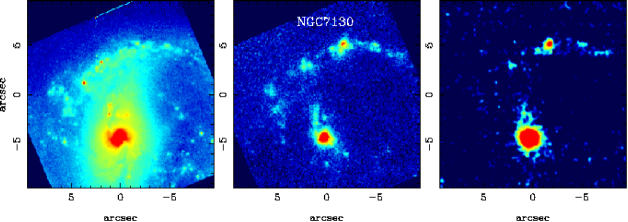
We obtained imaging observations of four LIRGs using T-ReCS in September 2005, and March-April 2006. T-ReCS has a plate scale of 0.089″pixel-1 which results in a field of view (FOV) of . Three LIRGs (NGC 5135, IC 4518W, and NCG 7130) were observed with the broad-band filter (central wavelength m and width at 50% cut-on/off m) and NGC 3256 with the narrow-band Si-2 filter (m, and m). The on-source integration times were NGC 3256: 304 s, NGC 5135 and NGC 7130: 608 s, and IC 4518W: 1216 s. Packham et al. (2005) described the observation procedures and data reduction. The uncertainties of the photometric calibration were . The standard star FWHMs (, Table 1) indicate that the T-ReCS observations were effectively diffraction limited, implying spatial resolutions of pc for our LIRGs. For details on the HST/NICMOS data reduction see AAH06. The T-ReCS and HST/NICMOS images are presented in Fig. 1.
| Galaxy | Class | Dist. | TReCS FWHM | NICMOS FWHM | T-ReCS | IRAC ) | ||||||||
|---|---|---|---|---|---|---|---|---|---|---|---|---|---|---|
| star | nuclear | nuclear | nuclear | nucleus | 5″ | 10″ | 5″ | 10″ | ||||||
| (Mpc) | (L⊙) | (mJy) | (″) | (″) | (″) | (pc) | (mJy) | (mJy) | ||||||
| NGC 3256 | HII | 35 | 11.56 | 3570 | 0.30 | 0.45 (N) | 0.40 (N) | 69 (N) | (N) | 462 | 1399 | 2436 | ||
| HII | 0.45 (S) | 0.40 (S) | 69 (S) | (S) | ||||||||||
| NGC 5135 | Sy2 | 52 | 11.17 | 630 | 0.31 | 0.35 | 0.16 | 80 | 214∗ | 408 | 490 | |||
| IC 4518W | Sy2 | 70 | 11.13∗∗ | 360∗∗ | 0.33 | 0.36 | 0.15 | – | 192 | |||||
| NGC 7130 | L/Sy | 66 | 11.35 | 580 | 0.31 | 0.45 | 0.60 | 190 | 148∗ | 232∗ | 372 | |||
Notes.—
Column (1): Galaxy. Column (2): Activity from optical spectroscopy (see
AAH06 for references). Columns (3), (4), and (5): Distance,
IR m luminosity, and IRAS
m flux density from Sanders et al. (2003). Columns (6), and (7):
T-ReCS FWHM of the standard stars, and nuclei. Columns (8) and (9): FWHM from
the continuum NICMOS images
of the nucleus in arcsec and parsec, respectively. Column (10):
nuclear (narrow-band m or -band, see §2) T-ReCS flux density. For the
resolved sources the flux density is
for a -diameter aperture. Columns (11) and (12): T-ReCS flux
densities for 5- and -diameter apertures. The errors only
account for the background estimate uncertainties. Columns (13), (14), and (15):
IRAC m flux
densities for 5- and -diameter
apertures, and the
NICMOS FOV (no aperture corrections have been applied for extended emission).
∗: Aperture correction for unresolved emission applied.
∗∗: The IRAS m density flux and IR luminosity are for both
the E and W components of IC 4518.
For the nuclei of NGC 3256 and NGC 7130 as well as for the high surface brightness regions (assumed to be H ii regions) clearly resolved in the T-ReCS images, we performed aperture photometry. The determination of the underlying background introduces typical MIR photometry uncertainties of , depending on the brightness of the source. For the unresolved sources (nuclei of NGC 5135 and IC 4518W) the aperture corrections to include all the flux from the point source were computed from standard star observations.
To compare our T-ReCS data with other galaxies (see §3.3), we converted the T-ReCS -band flux densities to IRAC m ones, convolving Spitzer/IRS spectra with the appropriate filter transmissions. For NGC 5135 and NGC 7130 we found and 0.76, respectively. These might be average values as spatial variations of the MIR spectral properties of the central regions have been observed in nearby galaxies (e.g., Smith et al. 2004). For the Seyfert (Sy) nuclei of NGC 5135 and IC 4518W, and using a ’generic’ IRS Sy2 template (Mrk 3, Weedman et al. 2005), we obtained . This ratio varies by up to 0.1dex in Sy galaxies observed by IRS (Buchanan et al. 2006). The T-ReCS m flux densities of NGC 3256 are approximately equivalent to the IRAC m ones. We also performed aperture photometry on the IRAC m images (Table 1) which have a spatial resolution of (Fazio et al. 2004).
3. Results and Discussion
3.1. MIR Structure on scales of tens-hundreds of parsecs
The morphological resemblance (see Fig. 1) between the MIR continuum emitting regions and the H ii regions (traced by the Pa emission) on scales of tens-hundreds of pc in LIRGs (see also Soifer et al. 2001) is remarkable. The near-IR (NIR) continuum emission on the other hand is more extended than the MIR emission (see Keto et al. 1997), and generally does not resemble the morphology of the ionized gas (see AAH06). As (Rieke & Lebofsky 1985), the lack of correspondence between the NIR and MIR (and Pa) emitting regions is probably not a differential extinction effect. Rather, this may reflect age differences since the NIR continuum is produced mostly by stellar populations older than the ionizing stellar populations (see e.g., Alonso-Herrero et al. 2002 and Díaz-Santos et al. 2006), even though highly obscured regions tend to be associated with the youngest regions in LIRGs (Soifer et al. 2001; Díaz-Santos et al. 2006).
The nuclei are the brightest MIR sources in all the galaxies. The Sy2 nuclei of NGC 5135 and IC 4518W222There are two Pa sources oriented north-south in the central region of IC 4518W. The Sy nucleus, the brightest Pa source and the dominant continuum source at m, is the south one. appear unresolved in the MIR (see Table 1), and this is confirmed by the detection of nuclear point sources (Table 1, and also AAH06) in the NICMOS continuum images. The nucleus of NGC 7130 (classified as a Sy or LINER) appears marginally resolved in the T-ReCS images, and the NICMOS continuum images reveal the presence of at least three sources of similar flux in the central pc. This suggests that the putative AGN in NGC 7130 does not dominate (see §3.2) the -band nuclear emission.
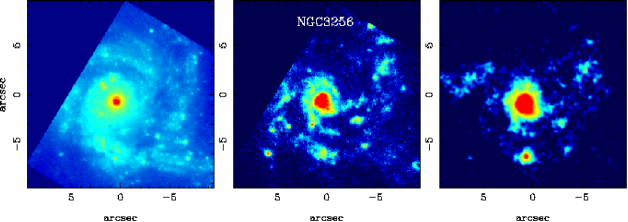
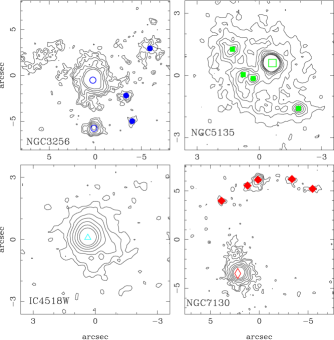
NGC 3256 is a well-studied merger galaxy, with two bright nuclei (north and south, see Fig. 2 for location). Kotilainen et al. (1996) and Neff, Ulvestad, & Campion (2003) suggested that the nuclei may host low luminosity AGN. The NIR (Lípari et al. 2000), X-ray (Lira et al. 2002), and MIR spectroscopic (see Martín-Hernández et al. 2006) properties of both nuclei are generally consistent with star formation. The extended (pc) nature of the NIR and MIR continuum emission of both nuclei further corroborates that such AGN, if present, are not dominant in the MIR.
3.2. AGN Contribution to MIR Emission of LIRGs
Approximately 25% of local LIRGs host spectroscopically confirmed AGN (Veilleux et al. 1995; Goldader et al. 1997; Tran et al. 2001; see Table 1 for our LIRGs). The Sy2 nucleus of NGC 5135 contributes of the -band emission within the central 10″, and even less to the IRAS integrated galaxy emission (Table 1). The AGN nucleus of NGC 7130, undetected as a point source, is responsible for of the total MIR emission (see Table 1). The MIR emission of IC 4518W is dominated by the Sy2 nucleus which accounts for up to (Table 1) of the -band flux density of this galaxy and approximately half of the MIR emission of the system (IC 4518W+E).
Three more galaxies in the LIRG sample of AAH06, not observed with T-ReCS, have spectroscopically confirmed Sy nuclei. For two of them, the B1 nucleus of the IC 694/NGC 3690 (Arp 299) system (García-Marín et al. 2006), and NGC 7469, the AGN contribution to the MIR emission is % (Keto et al. 1997; Genzel et al. 1995; Soifer et al. 2003). For the third one, there is no MIR information. Our results are consistent with the majority of AGN in our local LIRGs not dominating the MIR emission.
3.3. The m MIR Emission as a SFR Indicator?
Deep surveys at m with Spitzer are detecting a large number of LIRGs at and above. These LIRGs contribute significantly to the cosmic SFR density and IR background at (Le Floc’h et al. 2005; Lagache, Puget, & Dole 2005; Pérez-González et al. 2005). Since the observed m flux densities translate into rest-frame m ones at , it is important to assess the accuracy of the MIR-based SFR indicators. A number of works (e.g., CAL05; Pérez-González et al. 2006) find that the rest-frame m (only dust-emission) monochromatic luminosity is not as tightly correlated with the number of ionizing photons as the m emission (c.f., Wu et al. 2005).
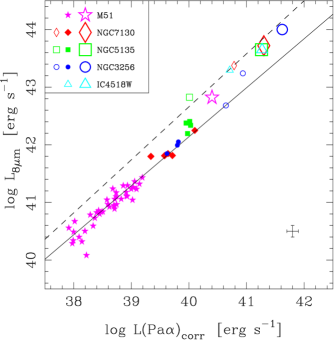
We further explore the Pa vs. m relation in Fig. 3. The LIRG Pa and MIR emissions are corrected for extinction using the Rieke & Lebofsky (1985) extinction law, and the averaged over the central emitting regions (AAH06). For the nuclei of NGC 3256, we used the nuclear . We assumed that the stellar emission contribution at m is negligible for our LIRGs. As can be seen from Fig. 3, although the LIRG H ii regions are up to 10 times more luminous than those in M51, they tend to follow the extrapolation of the CAL05 relation. Conversely, the integrated kpc emission of LIRGs deviates significantly from the relation found for individual H ii regions, but only slightly from the fit of Wu et al. (2005) for star-forming galaxies (Fig. 3). This could arise from two causes. First, Wu et al. (2005) may have underestimated the reddening (obtained from the Balmer decrements) in these dusty star-forming galaxies. Second, the m emission may be dominated by diffuse emission not associated directly with the H ii regions (see below).
The LIRG nuclei (except the south nucleus of NGC 3256) show elevated MIR/Pa ratios when compared to H ii regions. Such spatial differences in the MIR emission of nuclear and circumnuclear regions of nearby galaxies have also been observed (e.g., Smith et al. 2004). One possibility is that an insufficient extinction correction (as nuclear extinctions in LIRGs tend to be higher than in extranuclear regions) will produce a differential effect, making the nuclei appear more MIR-luminous. The AGN present in three of our LIRGs may also play a role, as their continua are produced by dust heated to higher temperatures than H ii regions, and do not present the strong PAH emission characteristic of H ii+photodissociation regions (e.g., Laurent et al. 2000; Roche et al. 2006).
The similar behavior of the m vs. Pa relation for a variety of H ii regions in M51 and LIRGs suggests that the m emission is well characterized by a thermal continuum plus PAH features with no strong variations over the range of conditions probed here (e.g., metallicity near or over solar, see AAH06 and CAL05). However, the integrated central kpc m vs. Pa emission differs significantly in all these environments from the relation found for the individual H ii regions. This may be explained by the presence, in addition to the bright and compact H ii regions, of a more diffuse and extended m component (see Figs. 1 and 2, and Helou et al. 2004). This extra emission at m would be produced not by local, strong ionizing sources, but by the diffuse radiation field (see e.g., Tacconi-Garman et al. 2005) that permeates the ISM. As such, the spectrum in these regions would be characterized by a weak continuum and strong PAH features with a large equivalent width. Hence when compared to individual H ii regions, an excess of m/Pa emission can be expected for the integrated properties over a few kpc. This is supported by the fact that the central kpc emission of LIRGs falls only slightly below the H vs. m relation found for the integrated properties of the galaxies studied by Wu et al. (2005), as indicated in Fig. 3. For a galaxy with erg s-1, the m vs. Pa relation for H ii regions alone predicts ) (and thus SFR) a factor of larger than that given by the relation found for the integrated properties of nearby galaxies.
4. Summary
The -band (also, the narrow-band at m) emission of local LIRGs resembles the nuclear and H ii region emission, as traced by Pa, on scales of tens-hundreds of parsecs. The AGN contribution to the observed MIR emission in our sample of LIRGs is generally small (). The luminous circumnuclear H ii regions of LIRGs provide evidence that the m vs. Pa relation found for M51 knots by CAL05 may extend for a further order of magnitude. The central kpc regions of LIRGs present elevated m/Pa ratios with respect to individual H ii regions, but similar to those of star-forming galaxies (see Wu et al. 2005). This is probably due to the presence of an extended, diffuse m component not directly related to the ionizing stellar population. A better understanding of the Pa (or H) vs. m relation for larger samples of nearby star-forming galaxies and LIRGs is required before using the IRAC m emission as a SFR tracer for IR-selected high- galaxies.
Support was provided by the Spanish PNE (ESP2005-01480) and the NSF (0206617). Based on observations obtained at the Gemini Observatory, which is operated by AURA, Inc., under a cooperative agreement with the NSF on behalf of the Gemini partnership: NSF (USA), PPARC (UK), NRC (Canada), CONICYT (Chile), ARC (Australia), CNPq (Brazil) and CONICET (Argentina). Based on observations with the NASA/ESA HST, obtained at the STScI, which is operated by AURA, Inc., under NASA contract NAS 5-26555.
References
- (1) Alonso-Herrero, A., et al. 2002, AJ, 124, 166
- Alonso-Herrero et al. (2006) Alonso-Herrero, A., et al. 2006, ApJ, 650, 835 (AAH06)
- (3) Buchanan, C. L. et al. 2006, AJ, 132, 401
- (4) Calzetti, D., et al. 2005, ApJ, 633, 871 (CAL05)
- (5) Díaz-Santos, T., et al. 2006, ApJ, submitted
- (6) Fazio, G. G., et al. 2004, ApJS, 154, 10
- (7) García-Marín, M., et al. 2006, ApJ, 650, 850
- (8) Genzel, R., et al. 1995, ApJ, 444, 129
- (9) Goldader, J. D., et al. 1997, ApJ, 474, 104
- (10) Gordon, K. D., et al. 2004, ApJS, 154, 215
- (11) Helou, G., et al. 2004, ApJS, 154, 253
- (12) Hinz, J. L., et al. 2004, ApJS, 154, 259
- Kennicutt (1998) Kennicutt, R. C. Jr. 1998, ARA&A, 36, 189
- (14) Keto, E., et al. 1997, ApJ, 485, 598
- (15) Kotilainen, J. K., et al. 1996, A&A, 305, 107
- (16) Lagache, G., Puget, J.-L., & Dole, H. 2005, ARA&A, 43, 727
- (17) Laurent, O., et al. 2000, A&A, 359, 887
- (18) Le Floc’h, E., et al. 2005, ApJ, 632, 169
- (19) Lípari, S., et al. 2000, AJ, 120, 645
- (20) Lira, P., et al. 2002, MNRAS, 330, 259
- (21) Martín-Hernández, N. L., et al. 2006, A&A, 455, 853
- (22) Mazzarella, J. M., et al. 2005, AAS, 207, 2106
- (23) Neff, S. G., Ulvestad, J. S., & Campion, S. D. 2003, ApJ, 599, 1043
- Packham et al. (2005) Packham, C., et al. 2005, ApJ, 618, L17
- (25) Pérez-González, P. G., et al. 2005, ApJ, 630, 82
- (26) Pérez-González, P. G., et al. 2006, ApJ, 648, 987
- (27) Rieke, G. H., & Lebofsky, M. J. 1985, ApJ, 288, 618
- (28) Roche, P. F., et al. 2006, MNRAS, 367, 1689
- Sanders & Mirabel (1996) Sanders, D. B., & Mirabel, I. F. 1996, ARA&A, 34, 749
- (30) Sanders, D. B., et al. 2003, AJ, 126, 1607
- (31) Smith, J. D. T., et al. 2004, ApJS, 154, 199
- Soifer et al. (2001) Soifer, B. T., et al. 2001, AJ, 122, 1213
- Soifer et al. (2003) Soifer, B. T., et al. 2003, AJ, 126, 143
- (34) Tacconi-Garman, L. E., et al. 2005, A&A, 432, 91
- Telesco et al. (1998) Telesco, C. M., et al. 1998, Proc. SPIE, 3354, 534
- (36) Tran, Q. D., et al. 2001, ApJ, 552, 527
- (37) Veilleux, S., et al. 1995, ApJS, 98, 171
- (38) Weedman, D. W., et al. 2005, ApJ, 633, 706
- (39) Wu, H., et al. 2005, ApJ, 632, L79