First hints of large scale structures in the ultra-high energy sky?
Abstract
The result of the recent publication Kachelriess:2005uf of a broad maximum around 25 degrees in the two-point autocorrelation function of ultra-high energy cosmic ray arrival directions has been intriguingly interpreted as the first imprint of the large scale structures (LSS) of baryonic matter in the near universe. We analyze this suggestion in light of the clustering properties expected from the PSCz astronomical catalogue of LSS. The chance probability of the signal is consistent within 2 with the predictions based on the catalogue. No evidence for a significant cross-correlation of the observed events with known overdensities in the LSS is found, which may be due to the role of the galactic and extragalactic magnetic fields, and is however consistent with the limited statistics. The larger statistics to be collected by the Pierre Auger Observatory is needed to answer definitely the question.
pacs:
98.70.Sa DSF-33/2006, FERMILAB-PUB-06-372-AI Introduction
The origin of ultra-high energy cosmic rays (UHECRs) is still an open problem and, at the present, two different classes of models compete to explain the most energetic events observed. In “bottom-up” mechanisms the acceleration up to extreme energy occurs in suitable astrophysical environments, whereas in “top-down” scenarios UHECRs are produced by the decay or annihilation of super-massive relic particles in the halo of our Galaxy or by cosmological diffuse topological defects. The observation that UHECR arrival directions (in particular at energies eV) may cluster according to the underlying large scale structure (LSS) of the universe would represent a clear evidence in favor of the “bottom-up” mechanisms, and should co-exist with the flux suppression known as the Greisen-Zatsepin-Kuzmin (GZK) effect Greisen:1966jv ; Zatsepin:1966jv . The challenging and fascinating problem of determining at which energy (if any) astronomy with charged particles becomes possible is thus strictly related to the identification of the sources of UHECRs, which in turn would constrain the galactic and extragalactic magnetic fields as well as the chemical composition of the primaries. The latter point is an important prerequisite to use UHECR data to study particle interactions at energy scales otherwise inaccessible to laboratory experiments.
It is well known that the chances to perform cosmic rays astronomy increase significantly at extremely high energy, in particular due to the decreasing of deflections in the galactic/extragalactic magnetic fields. Moreover, at eV the opacity of the interstellar space to protons drastically grows due to the photo-pion production on cosmic microwave background (CMB) photons (GZK effect). A similar phenomenon at slightly different energies occurs for heavier primaries via photo-disintegration energy losses. Above this range of energy, most of the flux comes from sources within a distance of few hundred Mpc (see e.g. Harari:2006uy ), and this should facilitate the source identification. Thus, the GZK feature in the spectrum and the large-scale anisotropy should be correlated signatures. The drawback is that in the trans-GZK regime the flux is greatly suppressed, even beyond the expected power-law extrapolation of UHECR spectrum, and instruments with huge collecting areas are required to accumulate sufficient statistics to attack the problem. A final answer is expected when the Pierre Auger Observatory Auger ; Abraham:2004dt will have detected enough events.
Until now, the experiments of the previous generation have collected (100) events above eV, and one may wonder if any useful hint of the UHECR sources already hides in the available catalogues. In the recent publication Kachelriess:2005uf , the authors found some evidence of a broad maximum of the two-point autocorrelation function of UHECR arrival directions around 25 degrees. The evidence was obtained combining the data with energies above eV of several UHECR experiments, after an a priori adjustment of their energy scale. This signal becomes significant only when several data-sets are added, but it is not caused solely by an incorrect combination of the exposure of different experiments. Both the signal itself and the exact value of the chance probability have to be interpreted with care, since the authors did not fix a priori the search and cut criteria. Although the nominal value of the chance probability for the signal to arise from random fluctuations is around , when taking into account a penalty factor of 30 they estimated the “ true chance probability” of the signal to be of the order of . The authors suggest that, given the energy dependence of the signal and its angular scale, it might be interpreted as a first signature of the large-scale structure of UHECR sources and of intervening magnetic fields.
The aim of this work is to test their qualitative interpretation of the result on the light of the signal expected if UHECR data reflect the large scale structure distribution of galaxies in the nearby universe. In Ref. Cuoco:2005yd , we have performed a forecast analysis for the Pierre Auger Observatory, to derive the minimum statistics needed to test the hypothesis that UHECRs trace the baryonic distribution in the universe. Assuming proton primaries, we found that a few hundred events at eV are necessary at Auger to have reasonably high chances to identify the signature, independently of the details on the injection spectrum. In this work we calculate the expected signal in terms of the autocorrelation function as in Kachelriess:2005uf for the presently available statistics, and discuss quantitatively how well predictions based on the LSS distribution can reproduce their findings. The method and the results obtained are presented in Sec. II; in Sec. III we briefly discuss our findings and conclude.
II UHECR clustering on medium scales and LSS
In our analysis, we closely follow the approach reported in Kachelriess:2005uf , using a similar dataset extracted from available publications or talks of the AGASA Hayashida:2000zr , Yakutsk yakutsk , SUGAR Winn:1986un , and HiRes collaborations Abbasi:2004ib ; Hires2 . In particular, in order to match the flux normalization of HiRes, the energies of the AGASA data must be rescaled downwards by , while the energies of Yakutsk and SUGAR data by . We address the reader to Kachelriess:2005uf for further details.
We define the (cumulative) autocorrelation function as a function of the separation angle as
| (1) |
where is the step function, the number of CRs considered and is the angular distance between the two cosmic rays and with coordinates on the sphere. We perform a large number of Monte Carlo simulations of data sampled from an uniform distribution on the sky and for each realization we calculate the autocorrelation function . The sets of random data match the number of data for the different experiments passing the cuts after rescaling, and are spatially distributed according to the exposures of the experiments. The formal probability to observe an equal or larger value of the autocorrelation function by chance is
| (2) |
where is the observed value for the cosmic ray dataset and the convention is being used. Relatively high values of and indicate that the data are consistent with the null hypothesis being used to generate the comparison samples, while low values of or indicate that the model is inappropriate to explain the data. Note also that by construction the values at different of the function are not independent. Nonetheless, studying the cumulative distribution function (as opposed to the differential one) is the only realistic way to extract information in a low statistics “noisy” sample. In addition, an autocorrelation study—differently from the approach of Ref. Cuoco:2005yd where a -analysis was used—only relies on the clustering probability in the data, while any directionality in the signal is lost. Although providing less compelling evidence, this method has the advantage of being more robust towards large magnetic deflections. As long as the energy and the charge of primaries from the same source are similar, their relative displacement should be small compared with the absolute displacement with respect to their sources. Thus it is natural to expect that the first (although more ambiguous) hints of a signal may come from the study of .
Figure 1 summarizes our main results. The solid, black curve shows that under the same assumptions of Ref. Kachelriess:2005uf , we obtain the same behavior for the function (compare with their Fig. 5).
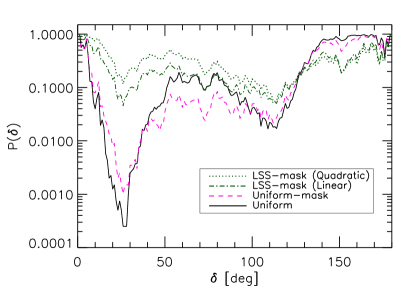 |
To proceed further, we have to compare the previous signature with the one expected from a model of the LSS. As in Cuoco:2005yd , we use the IRAS PSCz galaxy catalogue saunders00a . We address to our previous work Cuoco:2005yd as well as to the original paper saunders00a for technical details about the catalogue and about the calculation of the UHECR sky map—which takes into account energy losses as well—that we use in the following. It is important reminding that the catalogue suffers of an incomplete sky coverage. This includes a zone centered on the galactic plane and caused by the galactic extinction and a few, narrow stripes which were not observed with enough sensitivity by the IRAS satellite. These regions are excluded from our analysis with the use of the binary mask available with the PSCz catalogue itself. This reduces the available sample (by about 10%) to 93 events and the nominal chance probability to 0.1% (Fig. 1, dashed–purple line). Note that this is a quality factor of the catalogue, not an intrinsic problem of the data or theoretical prediction. The green/dot–dashed line in Fig. 1 shows the chance probability of the signature found in Kachelriess:2005uf , if the random events are sampled according to the LSS distribution (obviously convolved with the experimental exposures), rather than from an uniform one. Finally, the dotted line shows the same result if the random events are sampled according to the square of the LSS distribution, as one would expect e.g. for a strongly biased population of sources.
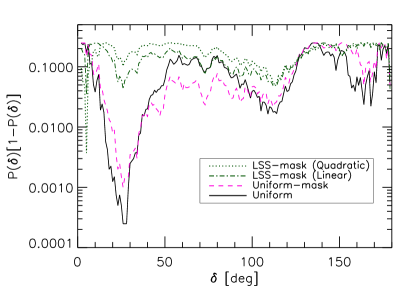
The prominent minimum of Kachelriess:2005uf is greatly reduced when using as null hypothesis the LSS model instead of the uniform one; this effect is even more prominent in the quadratic map. Also, the data are less clustered than expected from an uniform distribution at , where . This additional puzzling feature disappears when using the LSS null hypothesis, as it appears clearly in Fig. 2, where we plot the function for the same cases of Fig. 1. This function vanishes if any of or vanishes and has the theorethical maximum value of . Thus, the higher its value is the more consistent the data are with the underlying hypothesis. Apart from the very small scales, where our results are unrealistic since we did not include magnetic smearing or detector angular resolution, the better concordance of the UHECR distribution with the LSS distribution than with the uniform one is evident at any scale. Taken at face value, our result implies a nominal probability that the main signature found in Ref. Kachelriess:2005uf arises as a chance fluctuation from the LSS distribution. This suggests that the clustering properties of LSS are in much better agreement with the experimental data than a pure isotropic distribution. This is not an unexpected feature given that, as found in Cuoco:2005yd , the typical size on the sky of the clusters of structures lie in the range 15∘-30∘.
The absolute scale of the curves shown in Fig. 1 is affected by an uncertainty due to the true energy scale: we calculated the map assuming that the HiRes energy scale is the correct one, in agreement with Berezinsky et al.’s fit of the dip due to pair production of protons on CMB Berezinsky:2005cq . But if the true energy is higher, as a compromise solution with the other experiments may require, the chance probability is slightly higher. In this respect, one may look at our result as a conservative one. Hence, the largest sample of Kachelriess:2005uf which we chose on the basis of the strongest signal is consistent within “” with the clustering properties expected from LSS distribution111Consistent within “” means here at least in 5% of the cases. The distribution is indeed far from gaussian, and the number of can be used in its loose sense only.. Also given the fact that the “true probability” is higher than the nominal one (due to the penalty factor of the search a posteriori performed in Kachelriess:2005uf ), this may be considered as an argument in favor of their interpretation.
 |
In order to understand why their result is consistent with our sampled catalogue, it is useful to look at the chance probability of the autocorrelation signal of events sampled from the LSS according to the experimental exposures, assuming linear correlation. We show this function in Fig. 3 for two samples of 93 and 279 data, respectively the same statistics of the dashed and dot–dashed curves in Fig. 1, and a factor 3 higher. The curves are obtained as follows: a large number Monte Carlo realization of events is sampled according to the LSS probability distribution, and for each realization we calculate the function . We generate analogously random datasets from an uniform distribution, and calculate . We have thus independent couples of functions . The fraction of the simulations where the condition is fulfilled is the probability
| (3) |
which is the function shown in Fig. 3.
An important qualitative feature is that the shape of the curve presents indeed a broad minimum at scales of , and a moderate plateau at scales of . As shown by the case, in particular the first feature is intrinsic to the data: the more data are sampled, the more enhanced it appears. This is also the trend shown in Kachelriess:2005uf when enlarging the experimental statistics considered. Also, the higher the energy cut in the map, the stronger the signature, since the local structures are more and more prominent. Finally, the LSS data samples are typically less clustered than the uniform ones at ().
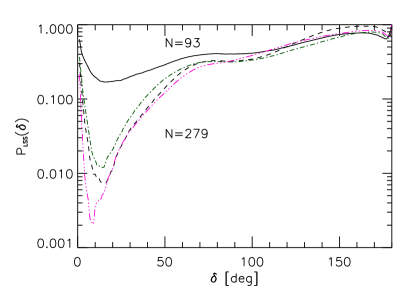 |
On the other hand, the minimum found in Fig. 3 for the sample of 93 data is much less prominent than the one shown by the dashed curve in Fig. 1. This explains why the consistency is “only” at the level of . This fact is not unexpected, given the predictions of Ref. Cuoco:2005yd : events are too few to guarantee a detection of the imprint of the LSS with a high significance. Consistently with the results of Fig. 1, we checked that the dip in Fig. 3 becomes more pronounced if we use a quadratic bias with LSS. Although not statistically significant at the moment, a confirmation of a highly clustered signal at intermediate scales may suggest thus a more than linear correlation of UHECR sources with the galaxy density field. Alternatively, the signal may be due to the magnetic smearing of a few relatively strong point-sources.
Clearly, a smoking gun in favor of the LSS-distribution would be a correlation between the data and the expected excess in the LSS map. By performing an analysis similar to the previous one, but in terms of the cross-correlation function between simulated data and sampled ones, we did not find any evidence favoring a LSS origin with respect to the uniform case. Actually this is not unexpected within the model considered in Cuoco:2005yd , since data at energy eV is still a too low statistics to draw a firm conclusion in this sense. However, the lack of this signature may also be related to the role of intervening magnetic fields. Acting on an energetically (and possibly chemically) inhomogeneous sample, magnetic fields may displace the observed positions with respect to the original ones in a non trivial way, without evidence for a characteristic scale, at least in a poor statistics regime. A possible hint towards a non-negligible role of magnetic fields is given also by the fact that the dip in the LSS signal is already present at relatively small angles. This feature may have disappeared in the UHECR sample due to a smearing effect of the magnetic fields.
III Discussion and Conclusions
We have analyzed the hypothesis that the broad maximum of the two-point autocorrelation function of the UHECRs arrival directions around 25∘ found in Ref. Kachelriess:2005uf may be due to the imprint of the LSS. We have concluded that this suggestion is at least partially supported by the UHECR sky map constructed starting from a LSS catalogue. Even their nominal (non penalty factor-corrected) result for the autocorrelation function is consistent within 2 with our expectations. A stronger correlation with source luminosity or a more-than-linear bias with overdensity may improve the agreement. Also, the correlation may not be directly with the LSS themselves: any class of sources which is numerous enough is expected to show some indication in favor of this correlation. The low statistics and the role of the magnetic field deflections may explain why no significant cross-correlation between data and LSS overdensities is found.
The authors of Ref. Kachelriess:2005uf also claim that the if the signal found is real, a heavy composition of the UHECRs is disfavored. However, we note that a heavy or mixed composition of the UHECRs may well be consistent with the signature. If we limit to the role of the (relatively well known) galactic magnetic field, a naive extrapolation of the simulations performed in Kachelriess:2005qm would indicate in the linear regime deflections for iron nuclei of about with respect to the incoming direction. UHE iron nuclei would then be in a transition from diffusive to ballistic regime. Nonetheless, the signal is sensitive to the relative deflections of “bunches” of cosmic rays originating from a similar region of the extragalactic sky, for which typical models of the regular galactic magnetic field predict a smearing even for iron nuclei, as long as their energies do not differ by more than about 30%. One may even speculate that the second dip at large angles (arising from cross-correlation of different groups of overdensities) might originate from primaries of different rigidity coming from the same few sources, splitted apart by intervening fields. Also, the consideration in Kachelriess:2005uf that accounting for the medium scale structure in UHECRs may change the significance of claims of small-scale clustering should be carefully examined. If the picture emerging from Ref. Kachelriess:2005uf and this paper is consistent, both LSS and magnetic fields play a role in shaping the signal, otherwise it is hard to explain the lack of cross-correlation with known overdensities of LSS. “Filaments and voids” in the observed data do not match the position of filaments and voids in the LSS. But if they are nonetheless connected, this difference must be rigidity-dependent. Thus, a cluster of events with high rigidity may well arise in a void of the presently known UHECR filamentary structure, which may sit closer to an overdensity of the LSS. Indeed, the clustered component of the AGASA data favoring small-scale clustering does show a different energy spectrum than the non-clustered component. This discussion emphasizes that, unfortunately, it is virtually impossible to draw strong conclusions at present, even assuming that the clustering at intermediate scales is physical.
In conclusion, the analysis performed in this paper does not exclude
that the signal found in Kachelriess:2005uf may be due to the
imprint of the LSS, an indeed gives some support in this sense.
Definitely, the larger statistics that the Auger Observatory is
going to collect in the next years is needed to tell us finally if
astronomy is possible with UHECRs or, equivalently, if we will be
ever able to look at the sky with new and “ultra-energetic”
eyes.
Acknowledgments
We thank M. Kachelrieß
for useful comments. P.S. acknowledges support by the US Department
of Energy and by NASA grant NAG5-10842. This work was also supported
by the PRIN04 Fisica Astroparticellare of Italian MIUR.
References
- (1) M. Kachelrieß and D. V. Semikoz, “Clustering of ultra-high energy cosmic ray arrival directions on medium scales,” Astrop. Phys. 26, 10-15 [astro-ph/0512498].
- (2) K. Greisen, “End To The Cosmic Ray Spectrum?,” Phys. Rev. Lett. 16, 748 (1966).
- (3) G. T. Zatsepin and V. A. Kuzmin, “Upper Limit Of The Spectrum Of Cosmic Rays,” JETP Lett. 4, 78 (1966) [Pisma Zh. Eksp. Teor. Fiz. 4, 114 (1966)].
- (4) D. Harari, S. Mollerach and E. Roulet, “On the ultra-high energy cosmic ray horizon,” J. Cosmol. Astropart. Phys. 11 (2006) 012 [astro-ph/0609294].
- (5) Pierre Auger Collaboration, 1996 The Pierre Auger Project Design Report, FERMILAB-PUB-96-024.
- (6) Abraham J et al. (Pierre Auger Collaboration), “Properties and performance of the prototype instrument for the Pierre Auger Observatory,” 2004 Nucl. Instrum. Meth. A 523 50.
- (7) A. Cuoco et al., “The footprint of large scale cosmic structure on the ultra-high energy cosmic ray distribution,” JCAP 0601, 009 (2006) [astro-ph/0510765].
- (8) N. Hayashida et al., “Updated AGASA event list above 41019 eV,” astro-ph/0008102.
-
(9)
Talk of M. Pravdin at the 29th ICRC Pune 2005,
http://icrc2005.tifr.res.in/htm/
PAPERS/HE14/rus-pravdin-MI-abs1-he14-poster.pdf - (10) M. M. Winn et al., “The cosmic ray energy spectrum above 1017 eV,” J. Phys. G 12 (1986) 653.
- (11) R. U. Abbasi et al. [The High Resolution Fly’s Eye Collaboration (HIRES)], “Study of small-scale anisotropy of ultrahigh energy cosmic rays observed in stereo by HiRes,” Astrophys. J. 610, L73 (2004). [astro-ph/0404137].
-
(12)
Talk of S. Westerhoff at the CRIS-2004 workshop “GZK and
Surrounding”, Catania, Italy,
http://www.ct.infn.it/cris2004/talk/westerhoff.pdf - (13) W. Saunders et al., “The PSCz Catalogue,” Mon. Not. Roy. Astron. Soc. 317, 55 (2000). [astro-ph/0001117].
- (14) V. Berezinsky, A. Z. Gazizov and S. I. Grigorieva, “Dip in UHECR spectrum as signature of proton interaction with CMB,” Phys. Lett. B 612, 147 (2005). [astro-ph/0502550].
- (15) M. Kachelrieß, P. D. Serpico and M. Teshima, “The Galactic magnetic field as spectrograph for ultra-high energycosmic rays,” Astropart. Phys. 26, 378-386 [astro-ph/0510444].