A Bar Fuels a Super-Massive Black Hole?:
Host Galaxies of Narrow-Line Seyfert 1 Galaxies
111Based on data collected at University of Hawaii 88inch telescope,
Canada France Hawaii Telescope, Subaru Telescope which is operated by
the National Astronomical Observatory of Japan,
and Kitt Peak National Observatory 2.1m telescope,
which is operated by the National Optical Astronomy Observatories
(NOAO), operated by AURA, Inc., under contract with the National Science
Foundation.
Abstract
We present optical images of nearby 50 narrow-line Seyfert 1 galaxies (NLS1s) which cover all the NLS1s at and known at the time of 2001. Among the 50 NLS1s, 40 images are newly obtained by our observations and 10 images are taken from archive data. Motivated by the hypothesis that NLS1s are in an early phase of a super-massive black hole (BH) evolution, we present a study of NLS1 host galaxy morphology to examine trigger mechanism(s) of active galactic nuclei (AGNs) by seeing the early phase of AGN. With these images, we made morphological classification by eye inspection and by quantitative method, and found a high bar frequency of the NLS1s in the optical band; the bar frequency is % among disk galaxies (% in total sample) which is more frequent than that (% ) of broad-line Seyfert 1 galaxies (BLS1s) and normal disk galaxies, though the significance is marginal. Our results confirm the claim by Crenshaw et al. (2003) with a similar analysis for 19 NLS1s. The frequency is comparable to that of HII/starburst galaxies. We also examined the bar frequency against width of the broad H emission line, Eddington ratio, and black hole mass, but no clear trend is seen. Possible implications such as an evolutionary sequence from NLS1s to BLS1 are discussed briefly.
1 INTRODUCTION
Narrow-line Seyfert 1 galaxies (NLS1s) are a subclass of active galactic nuclei (AGNs) which have the following characteristics (see Pogge 2000): (1)They have relatively narrower permitted lines (full width at half-maximum (FWHM) of H 2000 km s-1) than those of usual broad-line Seyfert 1 (BLS1s). (2)Their X-ray spectra are significantly softer (photon index () in a soft X-ray band is 1.5–5) than those of BLS1s () (Boller et al. 1996). (3)They show rapid soft/hard X-ray variability (Leighly 1999). (4)They often emit strong Fe II multiplets or higher ionization iron lines, that are seen in Seyfert 1s but not seen in Seyfert 2s (Osterbrock & Pogge 1985).
The most attractive and likely interpretation of the characteristics above is that NLS1s contain less massive black-holes (BHs) with a high accretion rate for a given luminosity, as described below. If the distance between the clouds emitting the broad-component of H and the central BH () is determined by dust-sublimation (Netzer & Laor 1993) or by the intensity of the ionizing UV on the clouds (Baldwin et al. 1995; Korista et al. 1997), would scale with the luminosity of the central accretion disk () as (e.g., Kaspi et al. 2000, 2005). By assuming that the clouds in BLR are virialized (Peterson & Wandel 1999, 2000) and that the luminosity is roughly in proportion to the accretion rate (), the FWHM of the broad H emission-line is proportional to ( refers to a BH mass.). Then, the relatively narrow H emission-lines can be attributed to a smaller and a higher . This view is also supported by results of reverberation mapping; smaller s and higher Eddington ratios for objects with narrower H width (Kaspi et al. 2000; Collin et al. 2002; Peterson et al. 2004). The softness of the X-ray emission is also explained in the same hypothesis, because the maximum temperature of an accretion disk, which would determine the soft X-ray index, is predicted to scale as in the standard accretion disk model (Shakura & Sunyaev 1973). Similar (but not exactly the same) - and -dependencies of the temperature hold even for an accretion rate larger than the critical one below which the standard model works (Mineshige et al. 2000; Kawaguchi 2003). Since a smaller -system (i.e. smaller Schwartzschild-radius and thus more compact system) would be fluctuating more rapidly than a larger system, NLS1s are thought to harbor smaller mass BHs (Hayashida 2000).
Less massive BHs with high accretion rates suggest that BHs in NLS1s have not yet been fed enough to become massive ones, and their BHs are now rapidly growing (Mathur 2000; Kawaguchi et al. 2004). If NLS1s are indeed in an early phase of BH evolution, they can be key objects for studying formation and evolution of AGNs. Detailed studies on nearby NLS1s will enable us to reveal the formation mechanism(s) and process(es) of central BHs in low-redshift universe, which of course helps the understanding of QSO formation and evolution in high redshift universe.
A scenario that QSO/AGN activity is triggered by galaxy-galaxy interaction and/or by bar structure has been proposed (e.g., Simkin et al. 1980; Noguchi 1988; Shlosman et al. 1990). In observational studies, although the excess of companion galaxies for Seyfert galaxies was claimed (Dahari 1984; Keel et al. 1985), recent studies do not support it (Schmitt 2001; Laurikainen & Salo 1995). The fraction of barred spiral galaxies among Seyfert galaxies is also comparable to that of normal spiral galaxies (Heckman 1978; Simkin et al. 1980; Ho et al. 1997; Mulchaey & Regan 1997; Hunt & Malkan 1999).
If NLS1s are indeed in an early phase of AGN evolution, we may be able to see such features (companions, bars) more clearly in NLS1s. Motivated by this speculation, we started imaging observations of nearby NLS1s in optical band. During we had been conducting this program, Crenshaw et al. (2003) studied morphology of 91 Seyfert 1 galaxies (13 NLS1s and 78 BLS1s) at , which were taken with HST WFPC2 through the F606W filter by Malkan et al. (1998), and additional six more NLS1s at from archival WFPC2 data taken through F814W or F547M filters. They found that among 84 disk galaxies (17 NLS1s and 67 BLS1s) the NLS1s tend to reside in barred galaxies more frequently than BLS1s; 11 out of 17 NLS1s (65%) have bars, while only 25% (17/67) of BLS1s have bars. When the sample is further limited to FWHM less than 1000 km s-1, 100% (4/4) of the NLS1s show the bar structure. Our sample in the present study includes 50 NLS1s taken from literatures and from our own observations, and it covers all the known NLS1s at (and ).
In this paper, we present results of optical imaging observations of the NLS1 sample and examine the morphology of their host galaxies, especially the frequency of bar structure. Sample selection is presented in the next section, and the data collection (mostly through our own observations) is described in §3. Morphology classification is made in §4 and resulting bar frequency and its comparisons with other samples are discussed in §5. Possible implications of the results are discussed in §6, followed by the summary of the paper in §7. We adopt a cosmological parameter set of km s-1, , and .
2 SAMPLE
Our sample consists of 50 NLS1s at ( km s-1) and , and covers virtually all the NLS1s known to date as of 2001. The redshift limit is introduced in order to resolve the bar structure; corresponds to less than kpc which should be compared with a typical length (semi-major axis) of a global bar of a few to several kpc (e.g., Elmegreen and Elmegreen 1985; Ohta et al. 1990; Ervin 2005). The sample size is 2.6 times larger than that of NLS1s (19) studied by Crenshaw et al. (2003). Most of the present sample were taken from “a catalogue of quasars and active galactic nuclei, 10th edition” (Véron-Cetty & Véron 2001) in VizieR service (Ochsenbein et al. 2000). However, among 54 NLS1s in the catalog, we removed 14 objects by checking their original spectra shown in the literatures and our own spectrum with a higher spectral resolution () taken with the GoldCam attached to the KPNO 2.1m telescope (details of the observing set up is described by Aoki et al. 2005); they show H emission lines broader than 2000 km s-1 or show type-2 feature. We also extracted NLS1s from Boller et al. (1996) and Xu et al. (1999) with the same criteria, but not listed in the catalogue by Véron-Cetty & Véron (2001). Again, by examining the original spectra in the literatures we chose four NLS1s. In addition to these, six NLS1s which satisfy the criteria were picked up from the Bright Quasar Survey (Schmidt and Green 1983) by checking the FWHM of the broad H emission-line presented by Boroson and Green (1992), if it is less than 2000 km s-1. The resulting sample is listed in TableA Bar Fuels a Super-Massive Black Hole?: Host Galaxies of Narrow-Line Seyfert 1 Galaxies 111Based on data collected at University of Hawaii 88inch telescope, Canada France Hawaii Telescope, Subaru Telescope which is operated by the National Astronomical Observatory of Japan, and Kitt Peak National Observatory 2.1m telescope, which is operated by the National Optical Astronomy Observatories (NOAO), operated by AURA, Inc., under contract with the National Science Foundation. in order of the width (FWHM) of H emission line. Although the sample is heterogeneous, it was the largest sample of nearby NLS1s at that time.
For each object, we calculate an optical continuum luminosity (), a black hole mass (), and an Eddington ratio, and the values are listed in Table 1. The optical continuum luminosity is derived from the magnitude given by Véron-Cetty & Véron (2003) and is corrected for the Galactic extinction by using the NASA/IPAC Extragalactic Database (NED) (Schlegel et al. 1998). The -correction was done by assuming (Vanden Berk et al. 2001). The black hole mass is calculated by using the FWHM of H broad-emission line and the optical continuum luminosity following the method by Kaspi et al. (2000, 2005). The Eddington ratio is calculated from the Eddington luminosity () and the bolometric luminosity (), which is assumed to be 13 (Elvis et al. 1994). It should be noted that the black hole masses and thus the Eddington ratios have a large uncertainty, because the estimated continuum luminosity () includes the light both from the nucleus and the host galaxy. It is possible that roughly up to 50% of the magnitude may come from the host galaxies (Surace et al. 2001; Bentz et al. 2006), which would be the dominant source of uncertainty in the estimations.
3 IMAGING DATA SOURCES
Most of the imaging data of the sample were collected through our observations with University of Hawaii 88 inch telescope during the period from Apr 2003 to May 2005. The imagers used were the OPTIC (Tonry et al. 2004) and the Tek 2k camera. The field of view and pixel size were and 0.′′138 (or 0.′′276 in the 2 binning mode), respectively for OPTIC, and and 0.′′22, respectively for Tek 2k. We adopted -band to trace stellar continuum. A typical exposure time of each frame was 25 minutes to avoid saturation of a bright nucleus. A total exposure time for each object was 10–30 minutes for most of them. Seeing sizes during observations were 0. to 1.′′4. The weather condition was not photometric for most of the observing runs.
We also observed a part of the sample in -band in March 2003 with the MegaCam attached to Canada France Hawaii Telescope (CFHT) in Queue mode as a Snapshot program. The field of view was and the pixel size was 0.′′185. Each exposure time was 3 minutes, and a total exposure time for each object was 21–27 minutes. The seeing size was around 0.′′8 to 1′′4. The weather condition was partly photometric. We took an additional image with FOCAS (Kashikawa et al. 2002) on the Subaru telescope (Iye et al. 2004) in band in Nov. 2004. Totally, we obtained 40 images out of the 50 targets. The journal of the observations is shown in Table 2.
The imaging data were reduced with usual manner; after subtracting bias, a flat fielding was applied. Since the OPTIC moves charges at pixels during an exposure, a flat field frame cannot be made with usual manner. Thus we made the flat frame by using ‘conflat’ program developed by Tonry, which makes a flat frame by weighting net exposure times and efficiencies of pixels where the charge was staying.
Figure 1 shows montages of all the NLS1s in our sample in the order of H emission-line width from smaller FWHM to larger FWHM (same as the order in Table 1). For the 10 remainders we took images from HST archive, Sloan Digital Sky Survey (SDSS) Data Release 5 (DR5), and digitized Palomar Observatory Sky Survey (POSS), though quality of some of the POSS data are poor.
Since the weather conditions were not good, it is impossible to make photometric calibration for these targets with our data. Nevertheless, in order to assess the depth of the imaging data roughly, we made the calibration as follows. For about 30% of the sample, SDSS photometric data are available. For these objects, we derived magnitudes from SDSS magnitudes and colors using a recently obtained magnitude transfer equation by Lupton (2005)333 www.sdss.org/dr4/algorithms/sdssUBVRITransform.html for UH88 data, magnitudes from magnitudes for CFHT data, and magnitude from magnitude and color for POSS data. For other objects, we derived - (UH88 and Subaru data) and - (CFHT data), and - (POSS data) magnitudes from the cataloged magnitudes by using the transformation equations (Lupton 2005) with use of average colors of , , , and calculated from the colors of the above NLS1s having SDSS data ( mag, mag, mag, and mag). Since the standard deviations of the average colors shown are not very small, it should be kept in mind that this estimation may have uncertainty of up to 1.0 mag, and only gives a rough idea on the surface brightness achieved by each imaging data. As for the data taken with HST (F606 and F814) and the SDSS data (-band), the photometric calibration was done by using its FITS header and the total magnitude in the catalog, respectively. The radial surface brightness distributions derived by using ‘ellipse’ task in IRAF are shown in Figure 1.
4 MORPHOLOGY OF NARROW-LINE SEYFERT 1s
4.1 Morphology by Eye Inspection
We assigned a morphological type for each object by eye inspection based on the images (Figure 1). When the global bar structure is clearly seen, we assign SB. If the bar seems to be weak or oval, SAB is assigned. Hubble sequences of 0/a (), a (), ab (), b (), bc (), and c () are also assigned; a typical accuracy would be in . When an interaction/merge or peculiar feature is seen, we assign ‘int’ or ‘P’, respectively. Although ‘?’ mark is labeled when we are not perfectly convinced of the classification, we include them for the following statistics unless otherwise mentioned.
We made eye inspection again several months after the first assignment of morphology without looking at the previous assignment. The results are almost consistent. For 95% of the sample, the morphology agrees with each other within . Three SB galaxies are classified as SAB, one SAB is classified as SB, and two SAs as SABs; consequently the changes in the total number of SB and SAB are and , respectively. The uncertainty in the classification does not affect so much for SBs and SBs+SABs, because most of the NLS1s are classified as SB or SAB as described below. The resulting assignment of morphology is shown in Table A Bar Fuels a Super-Massive Black Hole?: Host Galaxies of Narrow-Line Seyfert 1 Galaxies 111Based on data collected at University of Hawaii 88inch telescope, Canada France Hawaii Telescope, Subaru Telescope which is operated by the National Astronomical Observatory of Japan, and Kitt Peak National Observatory 2.1m telescope, which is operated by the National Optical Astronomy Observatories (NOAO), operated by AURA, Inc., under contract with the National Science Foundation. together with the data sources of the eye inspection.
Morphology in parenthesis in Table A Bar Fuels a Super-Massive Black Hole?: Host Galaxies of Narrow-Line Seyfert 1 Galaxies 111Based on data collected at University of Hawaii 88inch telescope, Canada France Hawaii Telescope, Subaru Telescope which is operated by the National Astronomical Observatory of Japan, and Kitt Peak National Observatory 2.1m telescope, which is operated by the National Optical Astronomy Observatories (NOAO), operated by AURA, Inc., under contract with the National Science Foundation. is that shown in Crenshaw et al. (2003). These classifications were also made by eye inspection. For four objects, morphology assignment is different from those by us; we assign SAB for three objects classified as SA by Crenshaw et al. (2003) because there seems to be a weak bar-like structure, while for one case we cannot recognize the strong bar structure and hence assign SAB instead of SB.
We compared our classification with those in the Third Reference Catalogue of Bright Galaxies (RC3; de Vaucouleurs, et al. 1991). Since our sample contains galaxies with rather large redshifts, most of the galaxies are not listed in RC3. 14 objects are classified in RC3, but among them eight objects are classified with ‘?’ (e.g., ‘S?’), and thus it is not meaningful to make comparison. Among the remaining six objects which we assigned SB, four objects are classified as SB, one object (NGC 4051) as SAB, and one object (Mrk 1044) as peculiar in RC3.
4.2 Quantitative Classification of Morphology
We also tried to make a quantitative classification of the bar structure. There are several ways to detect a bar; Fourier analysis of azimuthal profiles (e.g., Buta and Block 2001), ellipse fitting of isophotes (e.g., Mulchaey et al. 1997), axial ratio and twist of isophotes (Abraham et al. 1999), and variations of these methods. Here we adopt the method with use of radial variation of ellipticity and position angle of isophotes of a galaxy, because now it seems to be widely used and is rather robust for a galaxy with a relatively small angular extent. Following Jogee et al. (2004), we employ the following criteria to identify the bar: (1)the ellipticity should have global maximum value () of larger than 0.25 and the value should be larger than that of the outer disk, (2) the position angle (PA) in the bar region should not change larger than , and (3)the ellipticity should drop by () and the PA usually changes by at around the bar end.
We used ‘ellipse’ task in IRAF and examined the radial variation of the ellipticity and the position angle. When a companion or a star is located close to the target object, we masked it out. The resulting profiles are shown in lower panels of right side of Figure 1; solid circles and solid squares refer to the ellipticity with the left side ordinate and the position angle with right side ordinate, respectively. A horizontal dotted line, dashed line, and dot-dashed line show , global maximum value of ellipticity , and , respectively. The latter two lines are shown only for the objects classified as SB or SAB.
Results of the quantitative identification are shown in column 10 of Table 1; when the criteria are satisfied, we assign ‘SB’, while the criteria are not satisfied, ‘no’ is assigned, though it may not appropriate for Mrk 335, in which the nucleus dominates the light distribution and we may not trace its host. In two cases (Zw493.004 and NPM1G 14.0512), were obtained with . We assign ‘SAB’ for these objects, though usual quantitative classification does not assign ‘SAB’. Since Zw493.004 and NPM1G 14.0512 show a clear bar structure, we judge it is reasonable to assign ‘SAB’. For IZw1, we obtained and the constant position angle, but we assign ‘no’, because is seen only in one data point. PG 1535+547 and WAS 61 show large s of and . Although these may be edge-on galaxies, we assign ‘SB’ following the criteria. For some of the targets we failed to make the analysis due to the presence of a strong interaction or merger (RX J0140.1+1129, Mrk 507, Mrk 739E, and KAZ 163), or due to the presence of a clear feature such as spiral arm of which isophotes deviate from an ellipse significantly (NGC 4051). In these cases, we assign ‘’ in Table 1 and do not show the radial profiles of ellipticities and position angles.
As seen from Table 1, most (21/24, 88%) of the SB galaxies assigned by eye inspection are identified with SBs in the quantitative classification. Differences with respect to the classification by eye inspection are as follows: Three SAs in the eye inspection are identified with three SBs in the quantitative classification, eight SABs with six SBs and two unbarred galaxies (i.e., ‘no’), and three SBs with two SABs and one ‘’. Hence the total numbers of SABs and SBs in eye inspection, respectively, are six more and six less compared with those in the quantitative classification. But the total number of SBs plus SABs does not change.
We also compared the results with the classification in RC3. Among the six objects, which are classified without ‘?’ in RC3, three objects we assigned SB are classified as SB, one object (Zw493.004) we assigned SAB is classified as SB, one object (Mrk 1044) we assigned SB is classified as P, and one object (NGC 4051) which we could not make quantitative classification is classified as SAB.
There seems to be advantages and disadvantages to use either of the classification method. Morphology assignment is different from each other for a part of the sample, which gives different resulting bar frequencies. Therefore, we adopted both of the classification methods and discuss the bar frequencies using the two classifications.
The quantitative classification can distinguish the presence or the absence of the bar. It cannot, however, give us information about the disk or elliptical for unbarred galaxies. Thus we supplementary examined the images of the unbarred galaxies and their radial surface brightness distribution to see whether it shows the exponential-law or -law distribution. PG 1244+026, RX J1531.6+2019, IRAS 150912107, and KAZ 320 show the -law dominated profiles, though IRAS 150912107 may show the presence of a slight disk component. These galaxies are classified as E/S0s in the eye inspection. RX J1032.7+3913 and RX J1402.5+2159, which are classified as E/S0? in the eye inspection, also show the -law like profiles. RX J1618.1+3619, Mrk 1239, IZw1, RX J17450+4802, and PG0923+129 show disk dominated features and they are all classified as disk galaxies in the eye inspection. Remaining two galaxies, PG 1448+273 and Mrk 335 are interacting or peculiar galaxies. Thus for the E/S0 classification we adopt the eye inspection in the quantitative classification. When we take a disk-galaxy sample in the following statistics, we exclude all the galaxies classified as ‘’ as well as E/S0s, and interacting or peculiar galaxies among unbarred galaxies.
5 FREQUENCY OF BARRED GALAXIES
5.1 Bars in NLS1s
As seen in Figure 1, the frequency of barred galaxies is fairly high. Among 50 NLS1s for which we assigned morphological type by eye inspection, 24 NLS1s show clear bar structure (SB) and 8 NLS1s show weak or oval structure (SAB), which leads to the bar frequency of % (24/50) and %444The uncertainty for the frequency is estimated from , where is an observed frequency of bars in the sample and is its sample size. (32/50) for SB and SB+SAB, respectively (Table 3). (If we exclude galaxies classified with ‘?’, they are % (23/42) and % (29/42), respectively.) The frequencies are comparable in the quantitative classification; the SB frequency is % (30/50) and the SB+SAB frequency is % (32/50). If we exclude the galaxies which cannot be classified (i.e., ‘’), the SB and SB+SAB frequencies go up to % (30/45) and % (32/45), respectively (Table 4). Hereafter statistics derived with the quantitative classifications always exclude the five objects classified as ‘’.
Following Crenshaw et al. (2003), we see the frequencies among disk galaxies by excluding E and E/S0 galaxies, interaction or peculiar galaxies, and no morphological assignment (‘’ in Table 1) as well from the sample. The resulting bar frequency amounts up to % (24/38) and % (32/38) for SB and SB+SAB, respectively in the classification by eye inspection (Table 3). (If we exclude galaxies classified with ‘?’, they are %(23/32) and % (29/32), respectively.) The SB and SB+SAB frequencies are % (30/37) and % (32/37), respectively in the quantitative classification (Table 4). If we take NLS1s with H FWHM less than 1000 km s-1, the frequency (SB+SAB) goes up to % (9/10) in both classifications, confirming the results by Crenshaw et al. (2003). Below we adopt the value of % as the bar frequency of the NLS1s among disk galaxies, considering the frequencies in the eye inspection and the quantitative classification. It should be kept in mind, however, that the uncertainty is a statistical one and it does not include the uncertainty of the classification; if we miss-classified one galaxy to be a barred galaxy, then the frequency changes about 3%. Since the difference in the total number of SBs is two between the two eye inspections and we have two SABs in the quantitative classification, this number would give an estimation of the uncertainty of the classification.
We see the bar frequencies against distance of galaxy to examine whether our classification shows some incompleteness or bias. We divide the sample into two subsamples with a comparable size number; nearby subsample (, 24 galaxies) and distant subsample (, 26 galaxies). In the eye inspection classification, the bar frequency (SB+SAB) in the nearby subsample is 75% (18/24), while it is 54% (14/26) in the distant subsample. In the quantitative classification, the fractions in the nearby and distant subsamples are 77% (17/22) and 65% (15/23), respectively. The cause for the lower frequency in the distant sample is the presence of E/S0 galaxies and of interacting or peculiar galaxies. When we calculate the bar frequency among disk galaxies, the bar frequencies are % (18/21) and % (14/17) for the nearby and distant subsamples, respectively in the eye inspection classification. In the quantitative classification, the frequencies are % (17/20) and % (15/17) for the nearby and distant subsamples, respectively. Thus in both classifications, the frequencies among disk galaxies agree with each other and they do not change against the distance.
Next we examine the dependency of the frequencies against H FWHM. The bar (SB+SAB) frequency among the total sample seems to decrease with increasing H FWHM in the eye inspection classification; % (9/11), % (12/19), and % (11/20) for FWHM of km s-1, 1000 – 1500 km s-1, and 1500 – 2000 km s-1, respectively (Table 3). In the quantitative classification, although the frequency is high among galaxies with H FWHM less than 1000 km s-1, no such clear trend is seen; % (9/11), % (10/18), and % (13/16), for FWHM of km s-1, 1000 – 1500 km s-1, and 1500 – 2000 km s-1, respectively (Table 4). If we take the frequencies among disk galaxies, the frequencies for the three cases are % (9/10), % (12/14), and % (11/14) for FWHM of km s-1, 1000 – 1500 km s-1, and 1500 – 2000 km s-1, respectively for the eye inspection classification (Table 3), and % (9/10), % (10/13), and % (13/14) for FWHM of km s-1, 1000 – 1500 km s-1, and 1500 – 2000 km s-1, respectively for the quantitative classification (Table 4). Thus no clear trend is seen among disk galaxies.
We here recall the original motivation of this imaging program. NLS1s likely have smaller and higher ratios. Thus, the elapsed time since central BHs begun to grow by accretion events ( assuming quasi-steady accretion) is likely to be shorter for NLS1s on average than for BLS1s. Such “young AGNs” may still keep (while “older AGNs” could have lost) traces of unknown process(es) that triggered an major accretion event towards a central BH. For this purpose, sorting the sample NLS1s by the Eddington ratio (roughly scales with ratio) would be more physically meaningful than sorting by line width examined above. We divide the NLS1s into three subsamples, according to their Eddington ratios. The resulting bar frequencies (SB+SAB) for subsamples with , , and are % (11/20), % (12/19), and % (9/11), respectively in the eye inspection classification (Table 3). There seems to be a rough correlation between the bar frequency and Eddington ratio. In the quantitative classification, however, no trend can be seen; the bar frequencies are % (12/16), % (12/18), and % (8/11) for , , and , respectively (Table 4). If we take the frequencies among the disk galaxies, the bar frequencies are high and the trend is not clear; % (11/14), % (12/15), and 100% (9/9) for , , and , respectively in the eye inspection classification (Table 3). The situation is the same when we take the quantitative classification; the frequencies are % (12/13), % (12/15), and % (8/9) for , , and , respectively (Table 4). Thus no significant trend is seen.
We also examine the bar frequency against . The frequencies of SB + SAB are % (8/13), % (15/22), and % (9/15) for subsamples of , , and , respectively in the classification by eye inspection (Table 3). The frequencies in the quantitative classification range from 67 % to 75 % (Table 4) and no trend is seen. If we take statistics among disk galaxies, the bar frequencies are % (8/11), % (15/17), and % (9/10), for , , and , respectively in the eye inspection classification (Table 3). The frequencies are % (8/10), % (15/17), and % (9/10) for , , and , respectively in the quantitative classification (Table 4). Although in the eye inspection classification the frequencies might show a slight increase with increasing black hole mass, no trend is also acceptable within the errors. Hence there is no clear trend against .
5.2 Comparisons of Bar Frequencies
Since we collected all the known NLS1s, it is a kind of heterogeneous sample (though we set the limit on their distance, ), and thus it is not obvious what kind of control sample we should take to compare. Nevertheless, as described below, many ‘control’ samples point to the canonical value of bar frequency. First, we confront the bar frequency of NLS1s with that of nearby galaxies. Classically, for instance, de Vaucouleurs (1963) made a classification of 1500 bright galaxies in the local universe and 65% of disk galaxies were classified as barred galaxies (SB (37%) and SAB(28%)). More recently, Hunt & Malkan (1999) examined the frequency of barred galaxies by sampling galaxies selected from the Extended 12 m Galaxy Sample (Rush et al. 1993), and found 68–69% (with a typical statistical uncertainty of %) of non-active normal galaxies (i.e., excluding Seyferts, LINERs, HII/starburst galaxies) are classified as strong bar (SB) or weak bar (SAB), based on RC3. Laurikainen et al. (2004) also examined the bar frequency of non-active galaxies for a sample ( mag, diameter , inclination , etc from RC3) and found again 57–69% (with a typical uncertainty of %) are SB or SAB. In a magnitude limited sample ( mag and ), Ho et al. (1997) showed that 40–80 % of disk galaxies are classified as SB or SAB based on RC3.
The frequency of SB and SAB varies with Hubble type; the percentage increases in later type (Ho et al. 1997). Since almost all the NLS1s in our sample is earlier than Sc, considering galaxies earlier than Sc is reasonable for comparison. For such galaxies, Ho et al. (1997) found the bar frequency of 40-60%. It is worth noting that photometric properties of bars in early-type are quite different from those in late-type, and its boundary is around SBbc; e.g., surface brightness distribution of the early-type bar is flat with a sharp cutoff at the bar end while that of the late-type is steep without a sharp cutoff (Elmegreen & Elmegreen 1985; Ohta 1996). Hence the origin of bars may be different between bars in early- and in late-type disk galaxies.
In summary, all the samples of which criteria are different each other show the bar frequency of 40 to 70% for normal disk galaxies. Therefore, the bar fraction (SB+SAB) of % among disk NLS1s in both the eye inspection and the quantitative classifications is high as compared with that of normal disk galaxies. If we adopt the average bar frequency for normal disk galaxies as 70% (60%), then the significance of the excess would be 2.1 (3.6). However it should be noted that this significance level does not include the miss-classification in our morphology assignment as well as that in other studies. For instance, if we miss-classify one object in our sample, the significance level reduces (or increases) about 0.5.
Next, we confront the value with that for Seyfert galaxies (and LINERs). According to Hunt & Malkan (1997), the bar frequency (SB and SAB) depends on a sample chosen, but it ranges 56% to 70% with a statistical uncertainty of % for each sample. They claim that the frequency is comparable to that of non-active galaxies and that no significant excess of the bar frequency can be seen. Laurikainen et al. (2004) also examined the bar frequency and found 56–62% (with an uncertainty of for each sample) for Seyferts and LINERs. Again they claimed no significant bar excess against non-active galaxies. The same conclusion was obtained by Ho et al. (1997). Therefore, the frequency of bar seen in NLS1s (% in disk galaxies) is high as compared with Seyferts/LINERs with the similar significance level for normal disk galaxies.
It is also interesting to see the bar frequency among HII/starburst galaxies. Hunt & Malkan (1999) found that the bar frequency (SB+SAB) of HII/starburst galaxies is high (82–85%) (with an uncertainty of (6–7)% for each sample). The high frequency (%) is also found in a study by Laurikainen et al. (2004). These high bar frequencies may occur by inclusion of late type galaxies. However distribution of the frequency against the Hubble type does not show such trend clearly (Hunt & Malkan 1999), and they are % and % among early (S0/a – Sbc) and late (Sc – Sm) type galaxies, respectively (Ho et al. 1997). Although the bar frequency by Ho et al. (1997) is not so high, they are comparable to each other. The high occurrence of bar in HII/starburst galaxies seems to be a general trend, and the frequency seems to be comparable to that of NLS1s.
We note that the bar frequencies described above are all based on optical images. Since the optical light is affected by dust extinction, NIR is more suitable to recognize stellar bars. In fact, Mulchaey & Regan (1997) made -band imaging and found the bar frequency of % for normal galaxies. Seigar & James (1998) even found that almost 90% of their sample spirals (45) show bar structure in and -band. Eskridge et al. (2000) made -band imaging observations for 186 spiral galaxies drawn from the Ohio State University Bright Spiral Galaxy Survey and found 56% are strong bar and 16% are weak bar, totaling 72% of the bar frequency. Although Knapen et al. (2000) found the bar frequency of 59% in spite of the use of NIR data, NIR data tend to give a higher bar frequency for normal galaxies than optical data. Since our observations were made in optical bands, it is not adequate to compare our results with these NIR values. However, we need to pay attention that -band and -band we used cover slightly longer wavelength than those described above for the optical bar frequency (mostly - or -bands). Thus we cannot completely rule out a possibility that the high bar frequency found in this study is affected by the band effect, although it is unknown how much degree the band effect is serious in -band and -band.
5.3 Frequency of Ring and Companion/Interaction
We briefly mention the frequency of ring structure among NLS1s. Hunt & Malkan (1999) found a high ring frequency, particularly the frequency of an outer ring ( kpc in radius) among Seyfert galaxies. The frequency of outer rings, including pseudo outer rings, is 19–41% (depending on subsamples with a statistical uncertainty of % for each subsample) which contrasts to 4–11% for normal or HII/starburst galaxies. If our NLS1s also have the same high outer ring frequency, 10 to 20 galaxies with the outer ring are expected. However, in our sample, only one NLS1 shows a clear outer ring (PG 0923+129), and we do not find many NLS1s with the outer ring. The surface brightness of the outer ring in PG 0923+129 is mag arcsec-2, which seems not be too faint to detect the similar outer ring in other galaxies in our sample, because we reached the fainter surface brightness for most of the sample galaxies. Thus, it is possible that the frequency of outer rings associated with NLS1s is likely to be much smaller than that of BLS1s, provided that the surface brightness of the outer ring of PG 0923+129 is typical. However, whether the surface brightness of the outer ring is almost universal or not is unclear and our surface brightness estimation has a large uncertainty, hence further examination with deeper images is desirable to be definitive.
The number of interacting galaxies and mergers (including peculiar morphology) is not large in our sample; among 50 NLS1s four to eight NLS1s (8–16%) show such features. This is a rather small number if we compare it with the results for Seyfert galaxies e.g., 20–30 % by Schmitt (2001). This contrasts the result by Krongold et al. (2001) who studied environment of NLS1s and BLS1s using the Digitized Sky Survey data, and found no systematic difference in the environments between them. However, the quantitative comparison is not straightforward, since we do not have redshift information of close companions of the sample galaxies.
It is worth noting that the fraction of interacting galaxies and mergers (including peculiar) tends to be larger among NLS1s with larger FWHM of H emission lines. For the NLS1s with FWHM smaller than 1000 km s-1, no such galaxies are found, i.e., 0% (0/11). The frequency is % (1/19) for NLS1s with FWHM between 1000 km s-1 and 1500 km s-1. For the NLS1s with FWHM larger than 1500 km s-1 (and less than 2000 km s-1 by definition), it is % (7/20). If we discard the interacting galaxies classified as ‘?’, the frequency is % (4/20). Since it is unlikely that the tidal force affects the line width of the broad line region, the cause for this tendency is not clear.
6 IMPLICATIONS OF THE DISTINCT HOST MORPHOLOGY
Although the excess of the bar frequency in NLS1s as compared with those of normal disk galaxies as well as of BLS1s is marginal, we briefly discuss possible implications in case that the morphology distribution of NLS1s is really different from those of normal disk galaxies and BLS1s.
6.1 Are Narrow-line Seyfert 1s Broad-line Seyfert 1s with Different Viewing Angles?
The difference in the morphology distribution of host galaxies between NLS1s and BLS1s gives an important implication to the nature of NLS1s. Although many observational properties point to that the NLS1s are different population from BLS1s, there has been the claim that the NLS1s are BLS1s with different viewing angles: face-on view of a disk-like BLR (Puchnarewicz et al. 1992; Boller et al. 1996; Taniguchi et al. 1999) or partial obscuration (angles somewhere between Seyfert 1s and 2s). Disks of host galaxies and accretion disks are not necessarily aligned (Schmitt et al. 2002). Thus if NLS1s are objects with such specific viewing angles, there should not be any difference in morphology of host galaxies between NLS1s and BLS1s. Therefore, the difference in the host morphology between NLS1s and BLS1s (more frequent bars and rare outer rings in NLS1s) disproves the simple hypotheses above involving the viewing angle of the central engine, though the difference is not so significant.
6.2 Evolutionary Sequence of Seyfert Galaxies?
The difference of morphology frequency of the host galaxies of NLS1s against BLS1s (more frequent bars and rare outer rings) and the similarity of it to HII/starburst galaxies (comparable bar frequency) suggest the following evolutionary sequence scenario of these populations. In actively star-forming galaxies with bar structure, the gas accretion towards the central BH (i.e., ignition of AGN activity) is induced by bar by transforming gas angular momentum outside of the bar region (e.g., Simkin et al. 1980; Noguchi 1988; Shlosman et al. 1990). Since a gas accretion rate onto a central BH is likely determined by external reasons such as bar strength or amount of gas rather than internal reasons such as radiation pressure or gas outflow from the vicinity of the BHs (Collin & Kawaguchi 2004), does not necessarily follow the increase of BH mass with time. Accordingly, if we assume that is nearly constant during the lifetime of an AGN activity, BHs will be fed via super-Eddington accretion rates (i.e. NLS1 phase) in the beginning, and via sub-Eddington rates (BLS1 phase) later on due to the increase of BH mass. If the BLS1 phase indeed follows the NLS1 phase (e.g., Mathur 2000; Wandel 2002; Kawaguchi et al. 2004), the outer ring could be expected to form due to the gas angular momentum transfer to the outer region of the galaxy as an reaction of the gas accretion into the central region of the galaxy (e.g., Hunt & Malkan 1999).
6.3 Bar Destruction?
If a NLS1 indeed includes a young growing massive BH and will evolve to a BLS1, the difference of the bar frequency implies that bars of NLS1s should be dissolved during the transition period from the NLS1 phase to the BLS1 phase. (Of course, some fraction of host galaxies of BLS1 show the bar structure, thus not all the bars of NLS1s should be dissolved.) One possibility is that a bar is destroyed by central mass concentration (CMC; e.g., Hasan & Norman 1990); a rapidly growing massive BH located at the center of a galaxy could be a CMC and may dissolve the bar structure. Recent numerical studies show that a few to several percent of a disk mass is necessary to dissolve the bar (Shen & Sellwood 2004; Athanassoula et al. 2005). Although the central BH in a NLS1 seems to be slightly less massive () than this threshold, the mass could increase up to or more during the transition phase from NLS1 to BLS1. Furthermore, if we regard the CMC as a central BH together with the gas fallen into the central region of the galaxy, the total (BH plus gas) mass would exceed the threshold. Therefore, it is expected to be possible that the bar destruction by central BH (and gas in the central region as well) can occur in terms of the threshold mass.
The time-scale for the bar destruction is also an important clue. The time-scale of the bar destruction is likely to be a few Gyr (Shen & Sellwood 2004; Athanassoula et al. 2005), which is about 10 times galactic rotation in a disk region. Meanwhile, the duration (lifetime) of the NLS1 phase is estimated to be 10–30 Myr based on the relative fraction of NLS1s among type 1 AGNs (Grupe 1996; Kawaguchi et al. 2004). It can also be estimated from the -folding time-scale (Salpeter time-scale) for the Eddington-limited accretion. A BH mass increases by a factor of during the period of 120 Myr ( times the Salpeter time-scale). Since the FWHM is in proportion to and thus to in this case, it results in a factor of 2.1 increase in FWHM, which makes most NLS1s evolve to BLS1s. Thus, 120 Myr is another estimation for the lifetime of NLS1. For cases with constant , on the other hand, a factor of 2 increase in the FWHM requires a factor of 4 increase in . Since many of NLS1s show super-Eddington accretion rates (Kawaguchi 2003; Collin & Kawaguchi 2004), the time-scale can be as small as 3 times Salpeter time-scale or even smaller. If we accept super–Eddington accretion in NLS1s, a significant increase of is possible during 30Myr (Kawaguchi et al. 2004). If the NLS1 phase appears episodic, the durations of the NLS1 phase discussed above must be the sum of a number of shorter episodic phases. In any cases, the duration of the NLS1 phase is considered to be too short to dissolve the bar. Alternatively, the bar structure could be dissolved gradually during the BLS1 phase followed after NLS1 phase. The period of BLS1 is estimated to be yr (e.g., Martini 2004; Jakobsen et al. 2003; Croom et al. 2005), which is still rather shorter than a few Gyr leaving the problem of bar destruction unsolved. To summarize, the time-scale for the bar destruction is expected to be rather longer than that of the NLS1 and BLS1 phases. Thus, we may need a new idea to destroy the bar structure rapidly, though it may not be serious because we do not need to dissolve all the bars of NLS1s.
7 SUMMARY
Based on multi-wavelength observations and theoretical modeling, NLS1s are likely in an early phase of a super-massive BH evolution. Less massive BHs with high accretion rates suggest that BHs in NLS1s have not yet been fed enough to become massive ones, and their BHs are now rapidly growing (e.g., Mathur 2000; Wandel 2002; Kawaguchi et al. 2004). If NLS1s are indeed in the early phase of BH evolution, they can be key objects for studying formation and evolution of AGNs (Wandel 2002). Revealing morphology of their host galaxies in their early phase of AGN activity would be important to examine trigger mechanism(s) of AGNs. Motivated by the idea, we started imaging observations of nearby 50 NLS1s, which were all the known NLS1s at (and ) at the time of starting this program in 2001. We obtained 40 new images mainly with UH88 inch telescope in -band and with CFHT in -band. Combining additional 10 images from archive data, we presented the optical images of these 50 NLS1s.
With these imaging data, we made morphology classification of them by eye inspection and by quantitative classification (radial variation of ellipticity and position angle of isophotes). Based on the classifications, we derived frequency of global bar structure among the NLS1s. It is found that their host galaxies have the bar structure in the optical bands more frequently (%) among disk galaxies than BLS1s (%) and normal disk galaxies (%), confirming the results by Crenshaw et al. (2003) with a similar analysis for 19 NLS1s. The significance is, however, marginal particularly when we consider the uncertainty of the classification. The bar frequency is comparable to that of HII/starburst galaxies (%). We also examine the bar frequencies of NLS1s against FWHM of the H broad emission-line, Eddington ratio, and BH mass. Although possible correlations that the bar frequency in the total sample increases with decreasing FWHM and with increasing Eddington ratio are seen in the eye inspection classification, the trends are not seen in quantitative classification, and the no trend is consistent with the resulting bar frequencies in the eye inspection classification. An outer ring structure in NLS1s is very rare in this study as compared with the BLS1s. However the completeness of the observations may not be good enough to detect outer ring and a further study is desirable to be conclusive.
If the difference of morphology frequency of the host galaxies of NLS1s against BLS1s (more frequent bars and rare outer rings) is significant, it argues against the idea that a NLS1 is a BLS1 with a different viewing angle. If the difference of the bar frequency against BLS1s and the similarity of it to HII/starburst galaxies (comparable bar frequency) are significant, these suggest that a NLS1 phase starts from a starburst phase and evolves to a BLS1 phase after the NLS1 phase. Further, a plausible mechanism for AGN trigger can either a galactic bar structure or something else that has excited a bar, and the bar would fuel the central BH and form the outer ring by transforming angular momentum of gas. The bar destruction seems to be possible in terms of the necessary mass concentration estimated by numerical simulations. However, the time-scale necessary to dissolve the bar structure seems to be rather longer than the periods of NLS1 and BLS1 phases, which might challenge to current understanding of destruction process(es) of the bar.
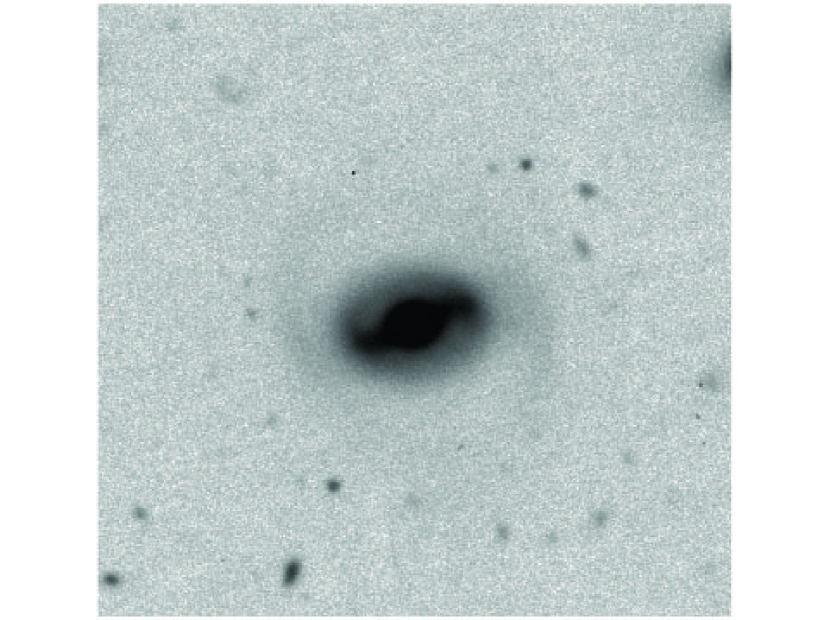
Appendix A RX J0024.7+0820 at
During the course of the imaging program, we took an image of RX J0024.7+0820 with FOCAS on Subaru, though the redshift (0.067) is slightly larger than our criteria (0.0666) (Xu et al. 1999). Figure 2 shows a clear bar structure with outer-ring-like arms. The redshift determined by ourselves based on the KPNO spectrum is 0.0671.
References
- (1) Abraham, R. G., Merrifield, M. R., Ellis, R. S., Tanvir, N. R., & Brinchmann, J. 1999, MNRAS, 308, 569
- Aoki et al. (2005) Aoki, K., Kawaguchi, T., & Ohta, K. 2005, ApJ, 618, 601
- Athanassoula et al. (2005) Athanassoula, E., Lambert, J.C., & Dehnen, W. 2005, MNRAS, 363, 496
- (4) Baldwin, J., Ferland, G., Korista, K., & Verner, D. 1995, ApJ, 455, L119
- Bentz et al. (2006) Bentz, M. C., Peterson, B. M., Pogge, R. W., Vestergaard, M., & Onken, C. A. 2006, ApJ, 644, 133
- Boller et al. (1996) Boller, T., Brandt, W. N., & Fink, H. 1996, A&A, 305, 53
- (7) Boroson, T. A., & Green, R. F. 1992, ApJS, 80, 109
- (8) Buta, R., & Block, D. L. 2001, ApJ, 550, 243
- Collin et al. (2002) Collin, S., Boisson, C., Mouchet, M., Dumont, A.-M., Coupé, S., Porquet, D., & Rokaki, E. 2002, A&A, 388, 771
- Collin and Kawaguchi (2004) Collin, S., & Kawaguchi, T. 2004, A&A, 426, 797
- Crenshaw et al. (2003) Crenshaw, D. M., Kraemer, S. B., & Gabel, J. R. 2003, AJ, 126, 1690
- (12) Croom, S. M., et al. 2005, MNRAS, 356, 415
- [Dahari (1984) Dahari, O. 1984, AJ, 89, 966
- de Vaucouleurs (1963) de Vaucouleurs, G. 1963, ApJS, 8, 31
- de Vaucouleurs, et al. (1991) de Vaucouleurs, G., de Vaucouleurs, A., Corwin, H. G., Jr., Buta, R.J., Paturel, G., & Fouqué, R. 1991, Third Reference Catalogue of Bright Galaxies (New York:Springer)(RC3)
- Elmegreen & Elmegreen (1985) Elmegreen, B.G., & Elmegreen, D.M. 1985, ApJ, 288, 438
- (17) Elvis, M., et al. 1994, ApJS, 95, 1
- (18) Ervin, P. 2005, MNRAS, 364, 283
- Eskridge et al. (2000) Eskridge, P.B., et al. 2000, AJ, 119, 536
- (20) Grupe, D. 1996, Ph.D. Thesis, Göttingen University
- (21) Grupe, D., Beuermann, K., Mannheim, K., & Thomas, H.-C. 1999, A&A, 350, 805
- Hasan and Norman (1990) Hasan, H., & Norman, C. 1990, ApJ, 361, 69
- Hayashida (2000) Hayashida, K. 2000, New Astronomy Reviews, 44, 419
- Heckman (1978) Heckman, T.M. 1978, PASP, 90, 241
- Ho et al. (1997) Ho, L.C., Filippenko, A.V., & Sargent, W.L.W. 1997, ApJ, 487, 591
- Hunt & Malkan (1999) Hunt, L.K., & Malkan, M.A. 1999, ApJ, 516, 660
- (27) Iye, M., et al. 2004, PASJ, 56, 381
- (28) Jakobsen, P., Jansen, R.A., Wagner, S., & Reimers, D. 2003, A&A, 397, 891
- (29) Jogee, S. et al. 2004, ApJ, 615, L105
- (30) Kashikawa, N., et al. 2002, PASJ, 54, 819
- Kaspi et al. (2000) Kaspi, S., et al. 2000, ApJ, 533, 631
- Kaspi et al. (2005) Kaspi, S., et al. 2005, ApJ, 629, 61
- Kawaguchi (2003) Kawaguchi, T. 2003, ApJ, 593, 69
- Kawaguchi et al. (2004) Kawaguchi, T., Aoki, K., Ohta, K., & Collin, S. 2004, A&A, 420, L23
- Keel et al. (1984) Keel, W.C., Kennicutt, R.C., Jr., Hummel, E., & van der Hulst, J.M. 1985, AJ, 90, 708
- Knapen et al. (2000) Knapen, J.H., Shlosman, I., & Peletier, R.F. 2000, ApJ, 529, 93
- (37) Korista, K., Baldwin, J., Ferland, G., & Verner, D. 1997, ApJS, 108, 401
- Krongold et al. (2001) Krongold, Y., Dultzin-Hacyan, D., & Marziani, P. 2001, AJ, 121, 702
- Laurikainen & Salo (1995) Laurikainen, E., & Salo, H. 1995, A&A, 293, 683
- Laurikainen et al. (2004) Laurikainen, E., Salo, H., & Buta, R. 2004, ApJ, 607, 103
- Leighly (1999) Leighly, K. M. 1999, ApJS, 125, 297
- Malkan et al. (1998) Malkan, M. A., Gorjian, V., & Tam, R. 1998, ApJS, 117, 25
- (43) Martini, P. 2004, in Carnegie Observatories Astrophysics Series, Vol. 1: Coevolution of Black Holes and Galaxies, ed. L. C. Ho (Cambridge: Cambridge Univ. Press), p.169; astro-ph/0304009
- (44) Marziani, P., Sulentic, J. W., Zamanov, R., Calvani, M., Dultzin-Hacyan, D., Bachev, R., & Zwitter, T. 2003, ApJS, 145, 199
- Mathur (2000) Mathur, S. 2000, MNRAS, 314, L17
- Mineshige et al. (2000) Mineshige, S., Kawaguchi, T., Takeuchi, M., & Hayashida, K. 2000, PASJ, 52, 499
- Mulchaey & Regan (1997) Mulchaey, J.S., & Regan, M.W. 1997, ApJ, 482, L135
- (48) Mulchaey, J. S., Regan, M. W., & Kundu, A. 1997, ApJS, 110, 299
- (49) Netzer, H., & Laor, A. 1993, ApJ, 404, L51
- Noguchi (1988) Noguchi, M. 1988, A&A, 203, 259
- (51) Ochsenbein, F., Bauer P., & Marcout, J. 2000, A&AS, 143, 221
- Ohta et al. (1990) Ohta, K., Hamabe, M. Wakamatsu, K.-I. 1990, ApJ, 357, 71
- Ohta (1996) Ohta, K. 1996, in IAU Colloq. 157, Barred Galaxies, ed. R. Buta, D.A. Crocker, & B.G. Elmegreen (ASP Conf. Ser. 91; San Francisco: ASP), p.37
- Osterblock and Pogge (1985) Osterbrock, D. E., & Pogge, R. W. 1985, ApJ, 297, 166
- (55) Peterson, B.M., & Wandel, A. 1999, ApJ, 521, L95
- (56) Peterson, B.M., & Wandel, A. 2000, ApJ, 540, L13
- Peterson et al. (2004) Peterson, B. M., et al. 2004, ApJ, 613, 682
- Pogge (2000) Pogge, R. W. 2000, New Astronomy Reviews, 44, 381
- (59) Puchnarewicz, E.M., et al. 1992, MNRAS, 256, 598
- Rodriguez (2000) Rodríguez-Ardila, A., Pastoriza, M. G., & Donzelli, C. J. 2000, ApJS, 126, 63
- Rush et al. (1993) Rush, B., Malkan, M.A., & Sinoglio, L. 1993, ApJS, 89, 1
- (62) Schlegel, D. J., Finkbeiner, D. P., & Davis, M. 1998, ApJ, 500, 525
- (63) Schmidt, M., & Green, R. F. 1983, ApJ, 269, 352
- Schmitt (2001) Schmitt, H.R. 2001, AJ, 122, 2243
- Schmitt et al. (2002) Schmitt, H.R., Pringle, J.E., Clarke, C.J., & Kinney, A.L. 2002, ApJ, 575, 150
- Seigar and James (1998) Seigar, M.S., & James, P.A. MNRAS, 299, 672
- Shakura and Sunyaev (1973) Shakura, N. I., & Sunyaev, R. A. 1973, A&A, 24, 337
- Shen and Sellwood (2004) Shen, J., & Sellwood, J.A. 2004, ApJ, 604, 614
- Shlosman et al. (1990) Shlosman, I., Begelman, M.C., & Frank, J. 1990, Nature, 345, 679
- Simkin et al. (1980) Simkin, S.M., Su, H.J., & Schwarz, M.P. 1980, ApJ, 237, 404
- Surace et al. (2001) Surace, J. A., Sanders, D. B., & Evans, A. S. 2001, AJ, 122, 2791
- (72) Taniguchi, Y., Murayama, T., & Nagao, T. 1999 (astro-ph/9910036)
- Tonry et al. (2004) Tonry, J. L., Burke, B., Luppino, G., & Kaiser, N. 2004, Scientific Detectors for Astronomy (Kluwer Academic Publisher), ed. P. Amico, et al. p.385
- (74) Vanden Berk, D. E., et al. 2001, AJ, 122, 549
- Vero-Cetty et al. (2001) Véron-Cetty, M.-P., et al. 2001, A&A, 372, 730
- Vero-Cetty Veron (2001) Véron-Cetty, M.-P., & Véron, P. 2001, A&A, 374, 92
- Vero-Cetty Veron (2003) Véron-Cetty, M.-P., & Véron, P. 2003, A&A, 412, 399
- Wandel (2002) Wandel, A. 2002, ApJ, 565, 762
- (79) Xu, D. W., Wei, J. Y., & Hu, J. Y. 1999, ApJ, 517, 622
| Name | FWHM H | Reference | log | log | log | Morphologyb | Barc | Data Sourced | ||
|---|---|---|---|---|---|---|---|---|---|---|
| (km s-1) | (mag) | (ergs s-1) | () | |||||||
| Zw493.004 | 500 | 7 | 0.043 | 15.008 | 44.05 | 6.11 | +0.94 | SBbe | SAB | POSS |
| Mrk 493 | 740 | 1 | 0.031 | 15.584 | 43.53 | 6.09 | +0.44 | SBb (SB/S(B)a) | SB | UH88-1 |
| IRAS 05262+4432 | 740 | 1 | 0.032 | 11.412 | 45.22 | 7.28 | +0.95 | SBb | SB | UH88-2 |
| PG 1244+026 | 740 | 1 | 0.048 | 16.036 | 43.73 | 6.23 | +0.50 | E/S0 | no | CFHT |
| RX J1618.1+3619 | 830 | 4 | 0.034 | 16.547 | 43.22 | 5.97 | +0.25 | S0,dE? | no | UH88-1 |
| IRAS 04312+4008 | 860 | 1 | 0.020 | 11.887 | 44.62 | 6.98 | +0.64 | SBb | SB | UH88-2 |
| Mrk 42 | 865 | 1 | 0.024 | 16.114 | 43.09 | 5.92 | +0.17 | SBab (SB/SBa) | SB | CFHT |
| Akn 564 | 865 | 1 | 0.025 | 14.602 | 43.73 | 6.37 | +0.37 | SBa | SB | UH88-2 |
| Mrk 359 | 900 | 1 | 0.017 | 14.656 | 43.37 | 6.15 | +0.22 | SBa | SB | UH88-2 |
| KUG 1031+398 | 935 | 1 | 0.042 | 15.534 | 43.82 | 6.49 | +0.32 | SBa | SB | UH88-2 |
| B3 1702+457 | 975 | 1 | 0.061 | 14.951 | 44.38 | 6.92 | +0.46 | SBab | SB | UH88-1 |
| Mrk 1044 | 1010 | 1 | 0.016 | 14.593 | 43.34 | 6.23 | +0.11 | SAB0/a (S/Sa) | SB | UH88-2 |
| RX J1531.6+2019 | 1050 | 7 | 0.051 | 16.907 | 43.44 | 6.33 | +0.11 | E/S0 | no | UH88-3 |
| PG 1448+273 | 1050 | 1 | 0.065 | 14.885 | 44.46 | 7.05 | +0.42 | Int | no | CFHT |
| Mrk 1239 | 1075 | 1 | 0.019 | 14.708 | 43.45 | 6.36 | +0.09 | S0 | no | CFHT |
| TON S180 | 1085 | 1 | 0.062 | 14.538 | 44.56 | 7.14 | +0.42 | SABa | SB | UH88-2 |
| IZw1 | 1090 | 7 | 0.061 | 14.131 | 44.71 | 7.25 | +0.46 | SABb (SB/-) | no | HST |
| RX J0032.3+2423 | 1110 | 3 | 0.066 | 17.158 | 43.57 | 6.47 | +0.10 | S0 | SB | UH88-2 |
| NGC 4051 | 1120 | 1 | 0.002 | 13.534 | 41.95 | 5.35 | 0.39 | SBb (SB/Sb) | CFHT | |
| Mrk 896 | 1135 | 1 | 0.027 | 15.074 | 43.61 | 6.52 | +0.09 | SABc (S/Sc) | SB | HST |
| MCG 06.26.012 | 1145 | 1 | 0.033 | 15.318 | 43.69 | 6.58 | +0.11 | SBb (SB/SB0) | SB | CFHT |
| Mrk 684 | 1150 | 1 | 0.046 | 15.271 | 44.00 | 6.80 | +0.20 | SBab | SB | CFHT |
| IRAS 04576+0912 | 1210 | 1 | 0.037 | 15.89 | 43.56 | 6.54 | +0.02 | SBa | SB | UH88-2 |
| PG 0934+013(Mrk707) | 1295 | 1 | 0.051 | 16.299 | 43.68 | 6.68 | 0.00 | SBab | SB | UH88-2 |
| RX J17450+4802 | 1355 | 1 | 0.054 | 16.192 | 43.78 | 6.79 | 0.01 | SABb? | no | POSS |
| Mrk 142 | 1370 | 1 | 0.045 | 16.141 | 43.63 | 6.70 | 0.06 | SB0/a | SB | UH88-2 |
| PG 1011-040 | 1455 | 1 | 0.058 | 15.331 | 44.18 | 7.13 | +0.05 | SBbe | SB | POSS |
| IRAS 15091-2107 | 1460 | 6 | 0.044 | 15.223 | 43.98 | 7.00 | 0.01 | E/S0 | no | UH88-3 |
| RX J1032.7+3913 | 1460 | 3 | 0.064 | 16.534 | 43.79 | 6.86 | 0.07 | E/S0? | no | SDSS DR5 |
| KAZ 320 | 1470 | 1 | 0.034 | 16.128 | 43.39 | 6.59 | 0.20 | E/S0 | no | UH88-2 |
| RX J1402.5+2159 | 1520 | 3 | 0.066 | 16.602 | 43.79 | 6.90 | 0.11 | E/S0? | no | SDSS DR5 |
| RX J0140.1+1129 | 1530 | 3 | 0.065 | 15.923 | 44.05 | 7.08 | 0.03 | P | Subaru | |
| HS 1831+5338 | 1555 | 1 | 0.039 | 15.746 | 43.66 | 6.83 | 0.16 | SB0 | SB | UH88-1 |
| NGC 4748 | 1565 | 1 | 0.014 | 14.507 | 43.26 | 6.55 | 0.29 | SABb,Int (S/Sa) | SB | CHFT |
| Mrk 507 | 1565 | 1 | 0.053 | 16.162 | 43.77 | 6.91 | 0.14 | Int? | UH88-1 | |
| RX J1016.7+4210 | 1570 | 3 | 0.056 | 16.533 | 43.67 | 6.84 | 0.17 | S0/a,int? | SB | UH88-2 |
| PG 1016+336 | 1590 | 1 | 0.024 | 15.812 | 43.21 | 6.53 | 0.32 | SBb | SB | CFHT |
| NPM1G -14.0512 | 1605 | 1 | 0.042 | 14.753 | 44.13 | 7.18 | 0.05 | SBb | SAB | CFHT |
| Mrk 739E | 1615 | 1 | 0.030 | 14.752 | 43.83 | 6.98 | 0.15 | Int | CFHT | |
| Mrk 766 | 1630 | 1 | 0.012 | 14.256 | 43.23 | 6.56 | 0.34 | SBb (SB/SBc) | SB | HST |
| PG 1535+547(Mrk486) | 1680 | 1 | 0.038 | 15.147 | 43.88 | 7.05 | 0.17 | SAB0? | SB | CFHT |
| RX J0000.1+0523 | 1690 | 3 | 0.040 | 16.163 | 43.52 | 6.80 | 0.28 | SB0? | SB | UH88-2 |
| KUG 1618+410 | 1700 | 7 | 0.038 | 15.969 | 43.55 | 6.83 | 0.28 | SBab | SB | SDSS DR5 |
| CTS J03.19 | 1735f | 2 | 0.053 | 15.463 | 44.05 | 7.19 | 0.14 | SBab | SB | UH88-2 |
| PG 0923+129(Mrk705) | 1790 | 1 | 0.028 | 14.974 | 43.68 | 6.96 | 0.28 | RS0 | no | CFHT |
| PG 1119+120(Mrk734) | 1825 | 1 | 0.049 | 15.241 | 44.07 | 7.25 | 0.18 | SABa | SB | CFHT |
| Mrk 335 | 1851 | 5 | 0.025 | 14.037 | 43.96 | 7.18 | 0.23 | P (P/?) | no | HST |
| KAZ 163 | 1875 | 1 | 0.063 | 15.308 | 44.27 | 7.41 | 0.15 | Int? | UH88-1 | |
| WAS 61 | 1900 | 4 | 0.045 | 15.317 | 43.96 | 7.21 | 0.25 | S0? | SB | SDSS DR5 |
| CG 59 | 1990 | 4 | 0.049 | 15.57 | 43.94 | 7.23 | 0.30 | SB0a | SB | UH88-2 |
References. — (1) Véron-Cetty et al. 2001; (2) Rodríguez-Ardila et al. 2000; (3) Xu et al. 1999; (4) Grupe et al. 1999; (5) Marziani et al. 2003; (6) Boller et al. 1996; (7) our data taken with GoldCam at KPNO 2.1m.
| Observing Run | Date | Instrument | Pixel Size | Band | Seeing |
|---|---|---|---|---|---|
| (arcsec pixel-1) | (arcsec) | ||||
| UH88-1 | Apr. 2003 | OPTIC | 0.276 | 0.7–1.0 | |
| UH88-2 | Dec. 2004 | OPTIC | 0.138 | 0.5–1.0 | |
| UH88-3 | May 2005 | Tek2k | 0.220 | 0.7–1.2 | |
| CFHT | Mar. 2003 | MegaCam | 0.185 | g′ | 0.8–1.4 |
| Subaru | Nov. 2004 | FOCAS | 0.104 | 0.6–1.1 |
| Sample | Bar frequency [%] (numbers) | Bar frequency [%] (numbers) |
|---|---|---|
| Total sample | Disk sample | |
| all bars | (32/50) | (32/38) |
| FWHM(H) 1000 km s-1 | (9/11) | (9/10) |
| 1000 FWHM(H) 1500 km s-1 | (12/19) | (12/14) |
| 1500 FWHM(H) 2000 km s-1 | (11/20) | (11/14) |
| log / | (11/20) | (11/14) |
| log / | (12/19) | (12/15) |
| log / | (9/11) | (9/9) |
| 5.35 log | (8/13) | (8/11) |
| 6.5 log | (15/22) | (15/17) |
| 7.0 log | (9/15) | (9/10) |
| Sample | Bar frequency [%] (numbers) | Bar frequency [%] (numbers) |
|---|---|---|
| Total sample | Disk sample | |
| all bars | (32/45) | (32/37) |
| FWHM(H) 1000 km s-1 | (9/11) | (9/10) |
| 1000 FWHM(H) 1500 km s-1 | (10/18) | (10/13) |
| 1500 FWHM(H) 2000 km s-1 | (13/16) | (13/14) |
| log / | (12/16) | (12/13) |
| log / | (12/18) | (12/15) |
| log / | (8/11) | (8/9) |
| 5.35 log 6.5 | (8/12) | (8/10) |
| 6.5 log 7.0 | (15/20) | (15/17) |
| 7.0 log 7.5 | (9/13) | (9/10) |
![[Uncaptioned image]](/html/astro-ph/0610355/assets/x1.png)
Fig. 1. —
![[Uncaptioned image]](/html/astro-ph/0610355/assets/x2.png)
Fig. 1. —
![[Uncaptioned image]](/html/astro-ph/0610355/assets/x3.png)
Fig. 1. —
![[Uncaptioned image]](/html/astro-ph/0610355/assets/x4.png)
Fig. 1. —
![[Uncaptioned image]](/html/astro-ph/0610355/assets/x5.png)
Fig. 1. —
![[Uncaptioned image]](/html/astro-ph/0610355/assets/x6.png)
Fig. 1. —
![[Uncaptioned image]](/html/astro-ph/0610355/assets/x7.png)
Fig. 1. —
![[Uncaptioned image]](/html/astro-ph/0610355/assets/x8.png)
Fig. 1. —
![[Uncaptioned image]](/html/astro-ph/0610355/assets/x9.png)
Fig. 1. —
![[Uncaptioned image]](/html/astro-ph/0610355/assets/x10.png)
Fig. 1. —
![[Uncaptioned image]](/html/astro-ph/0610355/assets/x11.png)
Fig. 1. —
![[Uncaptioned image]](/html/astro-ph/0610355/assets/x12.png)
Fig. 1. —
![[Uncaptioned image]](/html/astro-ph/0610355/assets/x13.png)
Fig. 1. —