11email: jlopez@astropa.unipa.it 22institutetext: Astrophysics Missions Division, Research and Science Support Department of ESA/ESTEC, Postbus 299, 2200 AG Noordwijk, Netherlands 33institutetext: INAF - Osservatorio Astronomico di Brera, via Brera 28, I-20121 Milan, Italy 44institutetext: X-ray Astrophysics Laboratory, Code 662, NASA/Goodard Space Flight Center, Greenbelt, MD 20771 55institutetext: Department of Physics and Astronomy, Johns Hopkins University, Baltimore, MD 21218
The stellar content of the XMM-Newton Bright Serendipitous Survey ††thanks: The XMM-Newton Bright Serendipitous Survey was conceived by the XMM-Newton Survey Science Center (SSC), a consortium of 10 institutions appointed by ESA to help the SOC in distinct technical aspects, including the exploitation of the XMM-Newton serendipitous detections (see http://xmmssc-www.star.le.ac.uk/).
Abstract
Context. The comparison of observed counts in a given sky direction with predictions by Galactic models yields constraints to the spatial distribution and the stellar birthrate of young stellar populations. In this work we present the results of the analysis of the stellar content of the XMM-Newton Bright Serendipitous Survey (XBSS). This unbiased survey includes a total of 58 stellar sources selected in the 0.5 – 4.5 keV energy band, having a limiting sensitivity of cnt s-1 and covering an area of 28.10 sq. deg.
Aims. Our main goal is to understand the recent star formation history of the Galaxy in the vicinity of the Sun.
Methods. We compare the observations with the predictions obtained with XCOUNT, a model of the stellar X-ray content of the Galaxy. The model predicts the number and properties of the stars to be observed in terms of magnitude, colour, population and ratio distributions of the coronal sources detected with a given instrument and sensitivity in a specific sky direction.
Results. As in other shallow surveys, we observe an excess of stars not predicted by our Galaxy model. Comparing the colours of the identified infrared counterparts with the model predictions, we observe that this excess is produced by yellow (G+K) stars. The study of the X-ray spectrum of each source reveals a main population of stars with coronal temperature stratification typical of intermediate-age stars. As no assumptions have been made for the selection of the sample, our results must be representative of the entire Solar Neighbourhood. Some stars show excess circumstellar absorption indicative of youth.
Key Words.:
galaxy: stellar content – stars: activity – stars: coronae – stars: formation – stars: magnetic fields – X-rays: stars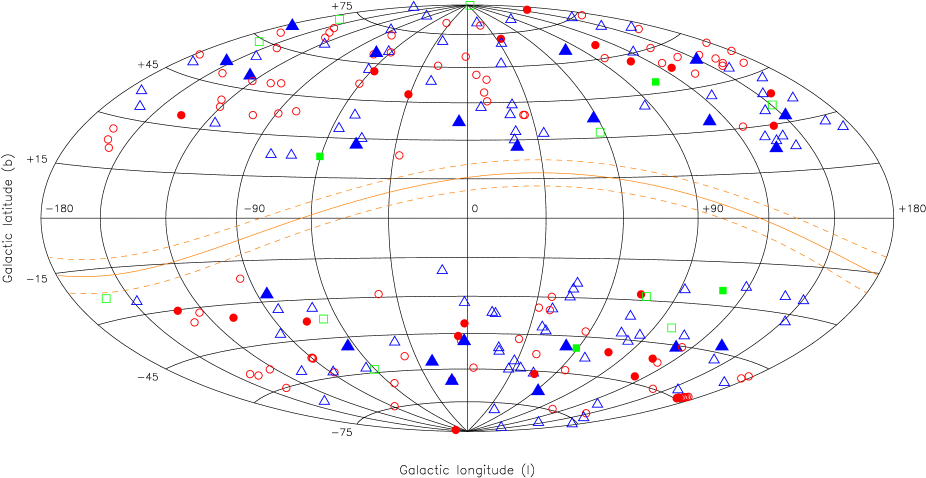
1 Introduction
It is well known from the study of young open clusters that magnetic activity traced by coronal X-ray emission evolves during the stars life. The average decreases from erg s-1 to erg s-1 during the life of normal late-type stars (Micela et al. 1985, 1988; Guedel et al. 1997; Feigelson & Montmerle 1999). This decrease mostly occurs between the Zero Age Main Sequence (ZAMS) and the solar age, while it is nearly negligible during the pre-main sequence (PMS) phase. As a consequence, X-ray flux-limited surveys detect young (PMS and ZAMS) stars up to larger distances than old (main sequence, MS) ones. Hence, shallow stellar X-ray selected samples will be dominated by young sources while old stars will be the dominant population in deep high-latitude stellar X-ray samples, since young sources have smaller scale heights than the limiting distance of the survey (see Micela 2003, and references therein).
Stellar X-ray surveys play an important role in understanding the recent star formation history in our Galaxy in the last billion years (eg. Favata et al. 1992). The comparison between X-ray observations and predictions derived from X-ray galactic models can constrain the properties of stellar populations, such as their spatial distributions and the stellar birthrate in the solar neighbourhood. Thus, X-ray surveys are a very useful tool for studying the stellar population in the (near) Galaxy.
A computational model for the prediction and analysis of the distribution of galactic X-ray stellar coronal sources counts, XCOUNT, was developed by Favata et al. (1992). The model allows the prediction of the number and properties, in terms of magnitude, colour, population and ratio distributions of the stellar coronal sources detected with a given instrument and sensitivity in a specific sky direction.
One of the first results of the comparison between predictions and observations of the Extended Medium Sensitivity Survey of Einstein (EMSS, Gioia et al. 1990) was the detection of an excess of yellow stars in the observations (Favata et al. 1988) later confirmed to be due to young (Pleiades-age) stars (Favata et al. 1993; Sciortino et al. 1995). An excess of young stars in the solar neighbourhood was also detected by Exosat and Rosat (eg. Tagliaferri et al. 1994). These results exclude scenarios with decreasing stellar birthrate in the last billion years, although they are unable to discriminate between a constant and an increasing stellar birthrate hypotheses, because of the limited sample size (Micela et al. 1993). On the contrary, the analysis of the Chandra Deep Field-North (CDF-N, Brandt et al. 2001) shows a lack of F, G and K dwarfs with respect to the predictions (Feigelson et al. 2004). The number of dM stars agrees very well with that predicted by the model but there is an excess of dF, dG and dK stars in the predictions (Micela 2003; Feigelson et al. 2004). The observed lack of yellow stars is in the opposite direction of the discrepancy obtained with the EMSS, although it must be noticed that the CDF-N is dominated by old-disk stars while young (PMS and ZAMS) stars are dominant in the EMSS. In the same way, a first inspection of the medium-deep X-ray survey HELLAS2XMM (Baldi et al. 2002) shows an excess of predicted stars (Micela et al. 2003). Old ( 1 Gyr) stars dominate with the intermediate-age (0.1 – 1 Gyr) stars contributing no more than 23, while the contribution of very young (0.01 – 0.1 Gyr) stars is negligible.
The discrepancy between the results of shallow and medium-deep surveys could be explained by a non-constant stellar birthrate and/or incorrect assumptions on the spatial distribution of stars and its dependency on age in the galactic model. On one hand, an increased star formation rate in the last billion years would account for the excess of young stars in shallow surveys. On the other hand, a density distribution decreasing with distance from the Galactic plane much more steeply than the assumed exponential shape (e.g. Guillout et al. 1996; Haywood et al. 1997) would account for the lack of old sources in medium and deep surveys. In this context, Chandra and XMM-Newton surveys could be able to discriminate between these two possible scenarios, thanks to their high sensitivity (Micela 2003).
The XMM-Newton Bright Serendipitous Survey (XBSS) was conceived with the aim of complementing the results obtained by medium and deep X-ray surveys. It contains two flux limited samples of serendipitous XMM-Newton sources at galactic latitudes (see Fig. 1): the XMM Bright Source Sample (BSS) containing the sources detected in the energy range 0.5 – 4.5 keV with count-rate cnt s-1 in EPIC-MOS2, and the XMM Hard Bright Source Sample (HBSS) with sources revealed in the energy range 4.5 – 7.5 keV with count-rate cnt s-1 (see Della Ceca et al. 2004, for details). For a Raymond-Smith spectrum with temperature 0.7 keV, typical of an active coronal source, the count-rate limit in the two chosen bands corresponds to an unabsorbed flux limit of erg cm-2 s-1 and erg cm-2 s-1, respectively. With this sensitivity, the XBSS complements deeper XMM-Newton and Chandra surveys with fluxes ranging from to erg cm-2 s-1.

The total area covered by the survey at the flux limit is 28.10 sq. deg. for the BSS (25.17 for the HBSS). The complete sample contains 400 X-ray sources, 389 sources belonging to the BSS. Up to now of the BSS sources have been observed spectroscopically. Fifty-eight of these sources have been identified with stars, corresponding to 15% of the BSS sample. In the following we will refer only to the BSS as our sample since all the stars belong to it while only two belong to the HBSS, which is largely dominated by extragalactic sources.
Thanks to the XMM large effective area, the BSS is unique since it is the only survey of this kind where X-ray spectroscopy can be obtained for all the stars detected. The other particularity of the BSS is that it is unbiased at the flux limit; i.e., none a priori assumption has been made when selecting the sample. This makes the obtained results to be representative of the entire Solar Neighbourhood. In addition, we should have detected all the young stars in the field of view. With the sensitivity of the BSS, X-ray sources with erg s-1 (typical of young stellar coronal sources) could be observed at distances up to 110 pc (see 4.1 for a more detailed description). Assuming a scale height of 100 pc for the young (0.01 – 0.1 Gyr) stellar population, our sample should contain the large majority of the young stars in the field of view.
Here we carry out an analysis of the X-ray spectra of the 58 sources 111Fifty six of them are given in (Della Ceca et al. 2004). The new stars identified since then are XBS J040744.6-710846 and XBS J122655.1+012002. identified with stars in the BSS (see Della Ceca et al. 2004, for details on the survey strategy and sample selection) as well as a study of their population, e.g. their distribution in spectral type and age, computed using the Galactic model XCOUNT. In 2 we determine the optical and infrared counterparts of the X-ray sources. In 3 we give the results of the analysis of the X-ray data. A discussion on the comparison between model predictions and observations is carried out in 4. Concluding comments are given in 5.
2 Cross-identification
Infrared counterparts of our X-ray sources have been identified from the 2MASS222The Two Micron All Sky Survey is a joint project of the University of Massachusetts and the Infrared Processing and Analysis Center/California Institute of Technology, funded by the National Aeronautics and Space Administration and the National Science Foundation. database. For the cross-identification, a search radius of 18 arcsec has been adopted bearing in mind the 15.1 arcsec XMM-Newton mirror psf half energy width, the arcsec uncertainty in the absolute position of a source in the EPIC detectors and the astrometric accuracy of arcsec of the 2MASS catalogue. Note that Della Ceca et al. (2004) estimate a positional error of the X-ray sources of the XBSS of 6 arcsec. The results of our cross-identification of the stellar sample with the 2MASS database are in agreement with these errors. All the infrared counterparts are found within a radius of 8 arcsec from the centroid of the X-ray source, 95% with offset arcsec. A cross-identification with the SIMBAD333SIMBAD Astronomical Database is operated at CDS, Strasbourg, France. database and Tycho-2 catalogue has also been carried out in order to identify obvious optical counterparts and to verify the spectral types of the infrared counterparts.
Of the 58 stars identified to date in the BSS, 29 have an
optical counterpart in SIMBAD, while the whole sample has been
cross-identified with 2MASS. The infrared and optical counterparts
are listed in Table The stellar content of the XMM-Newton Bright Serendipitous Survey
††thanks: The XMM-Newton Bright
Serendipitous Survey was conceived by the XMM-Newton Survey Science Center
(SSC), a consortium of 10 institutions appointed by ESA to help the SOC in
distinct technical aspects, including the exploitation of the XMM-Newton
serendipitous detections (see http://xmmssc-www.star.le.ac.uk/)., together with the
colour information from 2MASS. Right ascension and declination
of the infrared sources and positional
offset between the X-ray sources and their 2MASS counterparts
are also given.
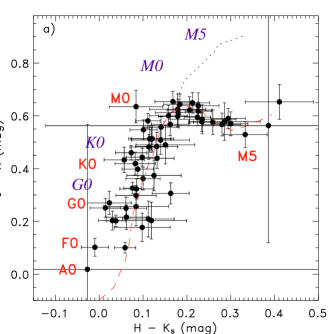
In Fig. 2a we show the vs. colour-colour
diagram for our sample. The dashed line in the figure represents
the main sequence track as defined by Bessell & Brett (1989) adapted here
to the 2MASS photometric system following the Section 4 of
the Explanatory Supplement to the 2MASS All Sky
Survey444The 2MASS Explanatory Supplement is available in the
web page:
http://www.ipac.caltech.edu/2mass/releases/allsky/doc/explsup.html.
The dotted line represents the giant branch (Bessell & Brett 1989).
All the stars in the sample are on the main sequence track,
which coincides with the giant branch for spectral types G0–M0.
Nevertheless, two exotic objects
have been optically identified (see Table The stellar content of the XMM-Newton Bright Serendipitous Survey
††thanks: The XMM-Newton Bright
Serendipitous Survey was conceived by the XMM-Newton Survey Science Center
(SSC), a consortium of 10 institutions appointed by ESA to help the SOC in
distinct technical aspects, including the exploitation of the XMM-Newton
serendipitous detections (see http://xmmssc-www.star.le.ac.uk/).):
the wide binary system WD 1631+78 (XBS J162911.1+780442)
and the cataclysmic variable BL Hyi
(XBS J014100.6-675328). The former is a binary system made up of
a white dwarf and an active M4.5 dwarf (e.g. Cooke et al. 1992)
which likely causes the observed X-ray emission (see Sion et al. 1995).
The latter is a well-known polar
– a binary system formed by a white dwarf and a pre-main sequence
red dwarf – where the red spectral energy distribution of the
companion dominates the overall colour (see Tovmassian et al. 2001; Hoard et al. 2002; Wachter et al. 2003; Caccianiga et al. 2004).
We have used the infrared colours of the 2MASS counterparts for determining the spectral type of the sources, which will be used in comparing observations with model predictions (4). For counterparts with mag. and mag. we use ; for the rest of the sources we use . The reason of such a division is that the index is adequate for spectral classification of A to early-K stars but not for late-K and M dwarfs, where the differences in are very small. For them, the index is more accurate (see Fig. 2a). Possible reddening has not been taken into account. However, no reddened sources are identified when comparing infrared colours with the optical ones from Tycho-2, for the sources in common. Fig. 2b shows the distribution of the infrared counterparts. Sixty four per cent of the sources (including both binary systems containing a white dwarf companion) are K–M stars; the remaining are yellow stars – spectral types F–G – with the exception of XBS J224833.3-511900, with colours typical of a B dwarf but with very large errors, XBS J080309.8+650807, and XBS J051617.1+794408 for which we obtain two possible counterparts with offsets of 2.3 and 7.1 arcsec, respectively. The photometry of the closest counterpart is very uncertain (flag = AEE in the 2MASS) and no conclusions about its spectral type can be inferred from it. Moreover, the 2MASS detection could be doubtful because of the proximity of the other source. Thus, for our study we have chosen the counterpart at 7.1 arcsec.
For 23 of our sources we have optical spectra from the optical identification campaigns. Spectral types determined using this information are, in most cases, well in agreement with those inferred from the infrared colours. Note that typical errors in the colours of these sources are 0.04 mag, typically equivalent to 23 spectral subtypes. In Table The stellar content of the XMM-Newton Bright Serendipitous Survey ††thanks: The XMM-Newton Bright Serendipitous Survey was conceived by the XMM-Newton Survey Science Center (SSC), a consortium of 10 institutions appointed by ESA to help the SOC in distinct technical aspects, including the exploitation of the XMM-Newton serendipitous detections (see http://xmmssc-www.star.le.ac.uk/). we give the results of the spectral classification using the information of both the infrared colours and the optical spectra. Based on infrared colours, only two sources seem to be significantly reddened: XBS J095955.2+251549 and XBS J122942.3+015525. The difference between the infrared and the optical inferred spectral types in both sources is higher than acceptable for their infrared colour errors. Another source (XBS J074359.7+744057) shows discrepancy in the spectral classification. In this case, the infrared colour is more typical of a late-G or early-K star while the optical spectrum is clearly from a late-K dwarf. Likewise, the two stellar systems containing a white dwarf are clearly identified, since the low mass companion dominate in the infrared range while the white dwarf is dominant in the optical spectrum.
3 X-ray properties of the sample

3.1 X-ray spectra and temperatures
We have carried out a spectral analysis of all the 58 X-ray stellar sources using data from the EPIC camera and the XSPEC spectral fitting package (Arnaud 1996, 2004). When possible, data from the PN, MOS1 and MOS2 detectors have been used. In some cases, no image from EPIC-PN has been collected due to both the source position in the field of view and the camera configuration – note that the source sample has been defined using the data from the EPIC-MOS2 detector only (see Della Ceca et al. 2004, for details) without restrictions in the EPIC-PN configuration – and only MOS data have been used.
For the analysis, we have adopted the APEC database, which contains the relevant atomic data for both continuum and line emission (Smith et al. 2001) included in XSPEC software. Interstellar absorption has been taken into account using the interstellar photo-electric absorption cross-sections of Morrison & McCammon (1983) also available in XSPEC. A two-temperature model has been used for those stars where a 1T-model does not account for the hard tail of the spectrum, i.e. the least-squares solution to the 1T-model gives unsatisfactory goodness-of-fit values. Free parameters of the model are the , the global abundance scaled on solar values from Anders & Grevesse (1989) and the temperature and the emission measure () for each thermal component. For the stars HD 32558 and CD-39 7717B, a 3T-model has been used to obtain an accurate fitting to the hard tail of the X-ray spectrum.
The results of the fits are shown in Table The stellar content of the XMM-Newton Bright Serendipitous Survey ††thanks: The XMM-Newton Bright Serendipitous Survey was conceived by the XMM-Newton Survey Science Center (SSC), a consortium of 10 institutions appointed by ESA to help the SOC in distinct technical aspects, including the exploitation of the XMM-Newton serendipitous detections (see http://xmmssc-www.star.le.ac.uk/).: for each star we give the value of the coronal temperature(s), the emission measures rate () when two thermal components are fitted, the global abundance (), the interstellar absorption (), the reduced value and associated degrees of freedom of the fit, the total net counts in the EPIC (MOS + PN) chips and the unabsorbed flux in the energy range 0.510 keV. The error ranges refer to the confidence region, or . For those sources with known parallax, the X-ray luminosity () has been determined (see Table 2). The results show a sample dominated by active stars – even though it is highly biased – with values typical of those observed in the Hyades and the Pleiades. Furthermore, two of the sources (J001002.4+110831 and J123600.7-395217, see Table The stellar content of the XMM-Newton Bright Serendipitous Survey ††thanks: The XMM-Newton Bright Serendipitous Survey was conceived by the XMM-Newton Survey Science Center (SSC), a consortium of 10 institutions appointed by ESA to help the SOC in distinct technical aspects, including the exploitation of the XMM-Newton serendipitous detections (see http://xmmssc-www.star.le.ac.uk/).) have been identified with post-T Tauri stars.
In Fig. 3 we plot the results in terms of temperature and distributions. For the sources where a 1T-model is adequate for reproducing the spectra, a broad spread of temperature is present (see Fig. 3a). For them, no definite conclusions can be reached. Some of the sources showing a low coronal temperature have a very low , and little can be said about their temperature stratification but that the X-ray spectra is dominated by this temperature. Several stars with a mean coronal temperature in the range keV show high suggesting that only one thermal component is present in the corona. However, this is common only in F-type stars. In addition, a considerable fraction of the sources (25) have a mean coronal temperature over 0.8 keV. This suggests the presence of two unresolved thermal components in their X-ray spectra, the hotter component contributing more than the cooler one. On the other hand, the spread in the temperature distributions of both thermal components of the sources where a 2T-model has been used is remarkably lower (see Fig. 3b). A Gaussian curve has been fitted to both peaks in the temperature distribution obtaining a of 0.15 and 0.19 keV respectively, which is compatible with the estimated errors (see Table The stellar content of the XMM-Newton Bright Serendipitous Survey ††thanks: The XMM-Newton Bright Serendipitous Survey was conceived by the XMM-Newton Survey Science Center (SSC), a consortium of 10 institutions appointed by ESA to help the SOC in distinct technical aspects, including the exploitation of the XMM-Newton serendipitous detections (see http://xmmssc-www.star.le.ac.uk/).). These results indicate that the corona of these sources can be described by two thermal components, a first one peaking at 0.31 keV and a second one at 0.98 keV. Similar results were found by a number of authors (Vaiana 1983; Schmitt 1984; Majer et al. 1986; Schmitt et al. 1990) for late-type stars observed with the Einstein Imaging Proportional Counter (IPC; Gorenstein et al. 1981). In particular, Schmitt et al. (1990) found that a 2T-model with keV and keV is more adequate than the classical 1T-model, for describing the observed X-ray spectrum of most of the dwarfs in an extensive sample of late-type stars. Although Schmitt (1984) and Majer et al. (1986) found that two such temperature components correspond to regions of the IPC’s peak sensitivity, Schmitt et al. (1990) conclude that the dichotomy is not due to an artifact of their analysis but musts represent an intrinsic property of the coronal spectra of moderately active late K and M dwarfs. Confirming these results, Briggs & Pye (2003) show – using XMM-Newton observations – that the temperature structure in the quasi-steady coronae of solar-like Pleiads can be reproduced by two thermal components with approximately equal emission measures.


The values of the two temperatures we have found for the stars in which a 2T-model is needed are compatible with the ones obtained by Briggs & Pye (2003) in non-saturated K stars in the Pleiades (see their Fig. 5). The contribution of both components of our sources to the X-ray spectrum is also in agreement with their results for K stars. In Fig. 3c we plot the distribution of the ratio of the emission measures () of the sources. The data show a peak around 1.0–1.5, with a spread that accounts for the different contributions of the two thermal components in each coronal source. Only four stars present higher contribution of the hotter thermal component, all them containing more than 3000 counts. On the other hand, three sources show values higher than 3, i.e. their spectrum is clearly dominated by the cooler component. All these stars contain less than 1000 counts. Although one is tempted to look for a correlation between the number of counts and – since the higher is the coronal activity the hotter is the corona of the source and the higher its count rate – no clear conclusions can be inferred from these results since some of the sources with high do not show higher contribution of the hotter component.
The values of determined from the fitting of the X-ray spectra are typical of nearby stars for the majority of our sources. However, nine of them (15 of our sample) show a significantly higher than the Galactic column density. The high derived implies that these stars might be surrounded by diffuse interstellar material left-over from its formation, since all our stars are nearby (see 1). The total number of counts of some of these sources is very low and no conclusions can be inferred from the fitting. In these cases, the high value of could be an artifact of the fitting procedure and other solutions with similar goodness-of-fit values, but with different fitting parameters, could be obtained. Instead, at least two of the sources (XBS J074359.7+744057 and XBS J122942.3+015525) with high ( and cm-2, respectively) have also a high number of counts ( counts) and show evidences of local reddening in their infrared colours, when comparing them with the spectral type deduced from their optical spectrum (see Table The stellar content of the XMM-Newton Bright Serendipitous Survey ††thanks: The XMM-Newton Bright Serendipitous Survey was conceived by the XMM-Newton Survey Science Center (SSC), a consortium of 10 institutions appointed by ESA to help the SOC in distinct technical aspects, including the exploitation of the XMM-Newton serendipitous detections (see http://xmmssc-www.star.le.ac.uk/).). The source XBS J095955.2+251549, with cm-2, also shows a discrepancy between the spectral type deduced from the infrared colours and that determined from the optical spectrum. A of cm-2 (corresponding to mag., using the relation in Ryter (1996) and Vuong et al. (2003)) is compatible with that found in some young stars in the nearby stellar associations TW Hya, Tucana-Horologium and Pic (e.g. Kastner et al. 2003; Zuckerman & Song 2004), where the residual circumstellar material is expected to dominate the X-ray absorption. Thus, at least for these three sources, the high seems not to be an artifact of the fitting process but the result of X-ray absorption by circumstellar material, indicative of a young star yet close to its formation site. In particular, they could be weak-lined T Tauri stars (WTTS) that have already lost their disk since, since they do not present any IR excess in the colour-colour diagram (Fig 2a).
3.2 X-ray variability
The light curve of the sources in our sample has been investigated with the aim of finding variations in their X-ray emission. A best extraction region has been determined for each source taking their psf into account in order to contain the maximum number of photons coming from the source and the minimum from the background. Besides, a background light curve has been extracted for background subtraction, from a region of the field of view close to the source and free from other contaminating sources. Error bars have been determined assuming Poissonian distribution of the photons collected by the chip in both source and background regions.
For our study we have utilized a Kolmogorov-Smirnov test. We have chosen a (significance) probability for discarding the source as variable, which means we can reject the hypothesis that the source is constant – i.e. the X-ray photons came from the source in a constant rate – at the 95 confidence level. Of the 58 sources composing the BSS, 39 fulfill this condition and other 3 are in the range 90–95. This means that 67 of the sources of the sample are variables. Fifteen of these sources show at least one flare during the observations, corresponding to 26 of the sample.
The observed curves show very different patterns related with distinct processes (see Fig. 4). For instance, XBS J051617.1+794408 and XBS J110320.1+355803 present solar-like flare events. These sources have been identified (see 2) with the stars HD 32558 and HD 95735, respectively. The latter is a well-known flare M2 dwarf. On the contrary, little is known about HD 32558. SIMBAD database classifies it as F8, and photometric data from Tycho-2 confirm it is an F star. In a study of the X-ray variability of Pleiades late-type stars, Marino et al. (2003) show that F–G Pleiades stars are variable on medium or long time scales (days–months). Short time (flare) variability (i.e. time scales of hours) is also observed, although it is more common in dK3–dM stars. Comparing the time X-ray distribution functions with those of field stars, the authors demonstrate that short time variability is more common in Pleiades F–G stars than in field dwarfs of similar spectral types. Thus, the observation of this X-ray flare suggests it is a young star, although we cannot discard the existence of a cooler companion producing the event. Other stars show light curves that may be produced by quite different physical processes. Thus, the continuous enhancement observed in the light curve of XBS J123600.7-395217 could be related with accretion processes in T-Tauri class objects. The source has been identified (see 2) with the very young system CD-39 7717 (TWA-11), made up of a T-Tauri star with spectral type A0 and an M2.5 young star and member of the TW Hya association (TWA). The A0 star contains a debris system which is believed to have a terrestrial planetary system (Low & Smith 2005). The M companion is a PMS. The resolution of the X-ray observation does not permit to separate the components and not much can be said about which star the X-ray emission comes from or whether it is the sum of the emission of both. Nevertheless, the A0 component is known to be under-luminous in X-rays compared to the average observed X-ray emission for the rest of the TWA members (e.g. Low & Smith 2005) and so the observed emission is likely to came from the secondary. We have used a Chandra ACIS-S observation from the archive in which the system has been serendipitously observed (Obs. ID: 2150) in order to resolve both components. The position of the X-ray source in ACIS-S confirms that the emission comes from the M star. This agrees with the results of the cross-identification (see 2) where the source is identified with the M star.
The other two examples of peculiar X-ray variability are XBS J124938.7-060444, identified with the chromospheric active binary IM Vir, which X-ray emission shows a clear modulation with time, and XBS J014100.6-675328 (BL Hyi) which show an energetic flaring event decaying in one hour. This latter is a well-known polar (e.g. Tovmassian et al. 2001) observed in an accretion state.
4 Model predictions
| B | A | F0-F6 | F7-G | K | M0-M5 | Total | Range† | |
|---|---|---|---|---|---|---|---|---|
| Observed‡ | 1 | 2 | 9 | 9 | 21 | 14 | 56 | |
| Constant birthrate () | - | 2 | 3 | 5 | 7 | 14 | 31 | 19 – 43 |
| Slowly decreasing birthrate ( Gyr) | - | 2 | 3 | 4 | 6 | 11 | 26 | 15 – 35 |
| Rapidly decreasing birthrate ( Gyr) | - | 2 | 3 | 3 | 5 | 7 | 20 | 12 – 28 |
| Slowly increasing birthrate ( Gyr) | - | 2 | 3 | 6 | 8 | 18 | 37 | 24 – 51 |
† Range of total number of stars predicted by the model, for
each stellar birthrate. This value has been estimated taking the relative
error on the predicted source counts and the statistical uncertainties
in the model simulation into account.
‡ The two binary systems containing a white dwarf
(see 2) have been discarded for
the comparison.
4.1 Model description and assumptions
The X-ray Galactic model XCOUNT (Favata et al. 1992; Micela et al. 1993) has been used for predicting the number and properties of the coronal sources expected in the BSS. The model is based on the stellar spatial densities of the Bahcall & Soneira model (Bahcall & Soneira 1980; Bahcall 1986). Although the Bahcall & Soneira model includes both an exponential disk and a spheroid, XCOUNT considers only the disk component due to the low X-ray luminosity of spheroid stars (see Favata et al. 1992). With the sensitivity of the BSS, active coronal sources with erg s-1 could be observed at distances up to pc, while the maximum distance at which a typical quiet star with erg s-1 might be visible is pc. Then, the approximation to a disk is quite realistic since we are observing only stars in our neighbourhood. Note that the scale height adopted by Bahcall (1986) is pc for main sequence stars and for giants. On the other hand our model is not simply a disk. The spatial distributions of the disk population in the original optical model has been modified to separate several distinct subpopulations of A–M stars of different ages. This introduces an explicit dependence of the stellar spatial distribution and density on stellar age (Micela et al. 1993).
Different scale heights have been adopted for distinct age ranges: 100, 200 and 400 pc for 0.01–0.1, 0.1–1, and Gyr respectively. They have been determined taking the results of Basu & Rana (1992) into account. Assuming the Galaxy to be formed by a disk isothermal in the z-direction (Wielen & Fuchs 1983) the scale height () is correlated with the velocity dispersion () as . At the same time, the velocity dispersion is proportional to (Villumsen 1985) and so the scale height is proportional to the age as . The value of must be determined from empirical data. In particular, Basu & Rana (1992) obtain using data given in Robin & Crézé (1986).
Three different X-ray luminosity functions (XLFs) have been utilized for the distinct age ranges: the youngest stars with ages 0.01–0.1 Gyr are assigned the ROSAT XLF of the Pleiades members (Micela et al. 1996); intermediate-age stars with ages 0.1–1 Gyr are assigned the ROSAT XLF of the Hyades (Stern et al. 1995); and the older ones ( Gyr) are assigned the XLF of Einstein studies of nearby old-disk stars (Schmitt et al. 1985; Maggio et al. 1987; Barbera et al. 1993). The XLFs have been appropriately converted to the bandpass of the observations, assuming a given input spectrum (see Favata et al. 1992, for details). Such a set of XLFs permits to evaluate the contribution to the total number of stars of different age populations without losing information about the assumed optical Galaxy model (Favata et al. 1992).
In general, predicted optical star counts are not strongly influenced by age distribution of the disk populations (Micela et al. 1993) because both optical luminosity and colour do not change substantially with stellar evolution during the main sequence lifetime. On the contrary, due to the high dependence of the X-ray luminosity with age (Micela et al. 1985, 1988; Guedel et al. 1997; Feigelson & Montmerle 1999) the assumed age distribution has significant influence on the predicted X-ray source counts. Here we have performed model computations with the three age subgroups having relative density on the plane derived from an exponential law:
| (1) |
where can take the values , 15, 5, and Gyr, corresponding to constant, slowly decreasing, rapidly decreasing, and slowly increasing stellar birthrate respectively, according to the results by Basu & Rana (1992).
4.2 XCOUNT model results


In Fig. 5 we show the predictions of the model with relative density distributions for the three age subgroups given by the above mentioned stellar birthrates. The numbers are summarized in Table 1. The 2MASS colours of the observed X-ray sources infrared counterparts have been converted to the Bessell & Brett photometric system – utilized by the model – using the transformations given in the Explanatory Supplement to the 2MASS All Sky Survey, for comparing observations with predictions.
A first inspection of the results suggests the stellar birthrate to be an increasing function of time since the total number of predicted sources is in better agreement with the observed ones when using Gyr555 Note that typical values for the relative error on the predicted source counts – for the error propagation of the statistical errors associated with the X-ray luminosity functions – are in the range 15-30 (Favata et al. 1992). Taking this and the statistical uncertainties in the model simulation into account (Feigelson et al. 2004) we estimate a range of 19–43, 15–35, 12–28, and 24–51 predicted sources for stellar birthrates with , +15, +5, and Gyr respectively.. However, the number of predicted M stars using this birthrate is quite above the observed one, even taking the error propagation in the model into account. On the contrary, predictions made for M stars using both constant or slowly decreasing birthrates are quite in agreement with the observations. Note as well that the slowly increasing stellar formation rate (SFR) gives results very similar to those of the constant birthrate.
On the other hand, the model does not account for the number of observed FGK stars using any of the birthrates analysed here. An excess of yellow stars is also observed in other shallow surveys (Favata et al. 1988; Micela 2003) that cannot be reproduced by Galactic models using smooth shapes of the SFR. In particular, Favata et al. (1993) and Sciortino et al. (1995) confirm the excess of yellow stars in the Extended Medium Sensitivity Survey of Einstein (EMSS, Gioia et al. 1990) to be due to young stars. Similarly, Micela et al. (2006) find an excess of FGK stars in the ROSAT North Ecliptic Pole survey (NEP, Henry et al. 2001). This result excludes scenarios with decreasing stellar birthrate, but does not discard continuous SFR with one or more burst. Studies of the IMF (Miller & Scalo 1979) and metallicity distribution in F stars (Twarog 1980; Carlberg et al. 1985) show that the SFR has basically remained constant over the age of the Galactic disk, or that it might have been smaller in the past (Miller & Scalo 1979). Our results show that the constant and the slowly increasing birthrate hypothesis are nearly equivalent and none of them reproduce the counts for yellow stars.
4.3 The nature of the FGK excess
From the results presented above one can argue that no smooth stellar birthrate can account for the observed distribution of stars. Although the total number of sources can be quite well reproduced using a slowly increasing SFR, the observed and predicted distributions in spectral type are different: there is an excess of stars with spectral types F–K in the observations and there is a lack of observed M stars that compensates the excess of FGK stars. Taking into account that using different scale heights makes the total number of stars vary but not the relative distribution in spectral types, and assuming that the stellar birthrate is indeed smooth – no definite evidences of star-burst are observed in the recent history of the disk (see Twarog 1980; Carlberg et al. 1985, but see also Barry 1988) – the discrepancy between predictions and observations must be due to a stellar population not accounted for by the model.
In Fig. 6 we show the relative contribution of the stars in the three age ranges to the total stellar counts, when using SFR with , +15, +5, and Gyr, respectively. In the cases of rapid or slowly decreasing birthrates, the X-ray population is dominated by intermediate age and old stars with almost the same contribution. However, when using a constant or a slowly increasing SFR the intermediate age sources are clearly dominant. In all the cases, the young stars give a small contribution (less than 20). The XCOUNT model allows the determination of the number of sources of any type expected in an X-ray observation given their spatial distribution and luminosity function, since they are treated as external parameters (Favata et al. 1992). Thus, we have used XCOUNT to predict the number of disk giant stars observed in the BSS, using the spatial distribution of the Bahcall and Soneira model, a scale height of 250 pc and a coronal temperature of 1.1 keV (Schmitt et al. 1990). The result is that no more than 1 giant is expected to be detected in the sample, which discard giants as the cause of the observed excess of yellow stars.
Bearing the results discussed above in mind, we infer that only two populations can be responsible of the excess in the BSS: active binaries – RS CVn and BY Dra systems – and/or very young objects. In Fig. 7 we plot the – predicted at high latitude for the four stellar birthrates, compared with observations in the fields observed with the medium filter (the results with the other filters are equivalent). The observed cumulative curve is clearly above the predictions. At low count-rates, the curve is almost parallel to the predicted – but at high count-rates ( s-1) there is a bump that could result from the presence of a population of sources with high X-ray luminosity and with low scale height. This would show a scenario of recent stellar birthrate enhancement, which is in agreement with the results of the EMSS (Favata et al. 1993; Sciortino et al. 1995). On the other hand, if we assume the scenario with an increasing stellar birthrate to be correct – as suggested by the better fit to the total number of stars (see Table 1) – we would be observing less M stars than those predicted. A possible hypothesis for the observed excess of yellow stars in such a scenario with a increasing stellar birthrate and a lack of red stars is the existence of a number of X-ray M dwarfs in binary systems with a yellow primary.

5 Discussion and conclusions
We have studied in detail the stellar content of the XMM Bright Serendipitous Survey. 2MASS counterparts have been identified for each one of the 58 X-ray sources. This unbiased stellar sample has been characterized in the sense of coronal temperature, global abundance and column density, and a study of the light curves has been carried out to reveal the X-ray variable population. Taking into account that the sample is unbiased, the results must be typical of the entire Solar Neighbourhood at the flux limit of the survey. This is the first time in which a complete X-ray spectral characterization has been carried out for a survey of this kind, thanks to the XMM-Newton effective area. In general, the coronal temperature stratification of our sources is typical of moderately active stars. Their spectrum can be fitted using a 2T-model with keV and keV. Only for two sources, a third thermal component has been necessary for fitting the hard tail of the spectrum. For other sources, with low S/N, a 1T-model is adequate for reproducing the spectrum. The value of the temperature in these cases is not representative of the temperature stratification but only of the dominant thermal component. Of the 58 sources, 42 present variability in their light curves, corresponding to of the whole sample. Fifteen of these sources ( of the whole sample) show at least one flare during the observations.
We have performed a detailed comparison between the observed stars and the predictions computed using the XCOUNT model with four different stellar birthrates. From the comparison of the expected number of stars of each spectral type with that inferred from the 2MASS counterparts, we show that a decreasing stellar birthrate scenario is not probable since the total number of predicted stars is clearly below the observed one, even taking model uncertainties into account. A constant SFR can reproduce well the number of A and M sources observed, but still underestimates the total number of observed stars. On the contrary, an increasing birthrate seems more suitable to the BSS: the total number of predicted sources fit well with the observations bearing in mind model uncertainties, although it overestimates the total number of M stars. On the other hand, the excess of FGK stars can not be reproduced using only a smooth stellar birthrate. Assuming that the stellar birthrate is indeed smooth in the last billion years, we infer that the discrepancy between observations and predictions must be produced by a stellar population not directly taken into account in the model.
In the – diagram, the cumulative curve of the BSS sources is above the predicted one for the four stellar birthrates analyzed here. The BSS curve runs parallel to the predicted ones for low count-rates, but at higher count-rates ( s-1) a bump is clearly observed. This again suggests the existence of a population with high X-ray luminosity and low scale height contributing to the sample. The high percentage of flare stars observed in the sample is in agreement with this hypothesis. Nevertheless, the lack of observed M stars with respect to the predictions when using the increasing stellar birthrate suggests another explanation: the existence of a number of X-ray M stars in binary systems with a yellow primary.
We have shown that a scenario with a decreasing stellar birthrate is not suitable for the observed number of stars and their distribution in spectral type. Furthermore, the situation with a constant SFR underestimates the total number of observed sources and does not seem to be appropriate. On the contrary, we show that a scenario with an increasing stellar birthrate can account for the total number of stars, and that the discrepancy in the distribution of the stars in spectral type between predictions and observations could be due to a population of young stars with low scale heights or to a number of M dwarfs in binary systems with a yellow primary.
Finally, we have shown that in several stars of the sample, some residual material left-over from its formation could be present. The value of determined for these stars is compatible with the optical absorption and column density observed in stars of the young stellar associations TW Hya, Tucana-Horologium and Pic. This agrees with the scenario with an increasing stellar birthrate and a population of young stars in the Solar neighbourhood. These stars would be good targets for examining the evolution of gaseous circumstellar disks around young stars.
Acknowledgements.
J. López-Santiago acknowledges support by the Marie Curie Fellowships contract No. MTKD-CT-2004-002769. The XMM BSS project has received financial support by the Italian Space Agency (ASI), by the Ministero dell’Instruzione Nazionale, Università e Ricerca Scientifica (MIUR) and by the italian Istituto Nazionale di Astrofisica (INAF). We also thank the TNG, ESO and Calar Alto Time Allocation Committee for a generous and continuous allocation of observing time during the last years. We thank Tommaso Maccacaro for the strong support given to the XMM/Newton BSS project. This publication makes use of data products from the Two Micron All Sky Survey, which is a joint project of the University of Massachusetts and the Infrared Processing and Analysis Center/California Institute of Technology, funded by the National Aeronautics and Space Administration and the National Science Foundation. This research has made use of the SIMBAD database, operated at CDS, Strasbourg, France.References
- Anders & Grevesse (1989) Anders, E., & Grevesse, N. 1989, Geochimica et Cosmochimica Acta 53, 197
- Arnaud (1996) Arnaud, K. 1996, XSPEC: The First Ten Years. In ASP Conf. Ser. 101, eds. George H. Jacoby and Jeannette Barnes, 17
- Arnaud (2004) Arnaud, K. 2004, XSPEC: Progress and Plans. In the American Astronomical Society, HEAD meeting 8, 16.29
- Bahcall & Soneira (1980) Bahcall, J. N., & Soneira, R. M. 1980, ApJS, 44, 73
- Bahcall (1986) Bahcall, J. N. 1986, ARA&A, 24, 577
- Baldi et al. (2002) Baldi, A., Molendi, S., Comastri, A., et al. 2002, ApJ, 564, 190
- Barbera et al. (1993) Barbera, M., Micela, G., Sciortino, S., Harnden, F. R., & Rosner, R. 1993, ApJ, 414, 846
- Barry (1988) Barry, D. C. 1988, ApJ, 334, 436
- Basu & Rana (1992) Basu, S., & Rana, N. C. 1992, ApJ, 393, 373
- Bessell & Brett (1989) Bessell, M. S., & Brett, M. 1988, PASP, 100, 113
- Brandt et al. (2001) Brandt, W. N., Alexander, D. M., Hornschemeier, A. E., et al. 2001, AJ, 122, 2810
- Briggs & Pye (2003) Briggs, K. R., & Pye, J. P. 2003, MNRAS, 345, 714
- Caccianiga et al. (2004) Caccianiga, A., Severgnini, P., Braito, V., et al. 2004, A&A, 416, 901
- Carlberg et al. (1985) Carlberg, R. G., Dawson, P. C., Hsu, T., & Vanderberg, D. A. 1985, ApJ, 294, 674
- Cooke et al. (1992) Cooke, B. A., Barstow, M. A., Breeveld, E. R., et al. 1992, Nature, 355, 61
- Della Ceca et al. (2004) Della Ceca, R., Maccacaro, T., Caccianiga, A., et al. 2004, A&A, 428, 383
- Favata et al. (1988) Favata, F., Rosner, R., Sciortino, S., & Vaiana, G. S. 1988, ApJ, 324, 1010
- Favata et al. (1992) Favata, F., Micela, G., Sciortino, S., & Vaiana, G. S. 1992, A&A, 256, 86
- Favata et al. (1993) Favata, F., Barbera, M., Micela, G., & Sciortino, S. 1993, A&A, 277, 428
- Feigelson & Montmerle (1999) Feigelson, E. D., & Montmerle, T. 1999, ARA&A, 37, 363
- Feigelson et al. (2004) Feigelson, E. D., Hornschemeier, A. E., Micela, G., et al. 2004, ApJ, 611, 1107
- Gioia et al. (1990) Gioia, I. M., Maccacaro, T., Schild, R. E., et al. 1990, ApJS, 72, 567
- Gorenstein et al. (1981) Gorenstein, P., Harnden, F. R., Jr., & Fabricant, D. G. 1981, I.E.E.E. Trans. Nucl. Sci., NS-28, 869
- Guedel et al. (1997) Guedel, M., Guinan, E. F., & Skinner, S. L. 1997, ApJ, 483, 947
- Guillout et al. (1996) Guillout, P., Haywood, M., Motch, C., & Robin, A. C. 1996, A&A, 316, 89
- Haywood et al. (1997) Haywood, M., Robin, A. C., & Crézé, M. 1997, A&A, 320, 440
- Henry et al. (2001) Henry, J. P., Gioia, I. M., Mullis, C. R., et al. 2001, ApJ, 553, L109
- Hoard et al. (2002) Hoard, D. W., Wachter, S., Lee Clark, L., & Bowers, T. P. 2002, ApJ, 565, 511
- Kastner et al. (2003) Kastner, J. H., Crigger, L., Rich, M., & Weintraub, D. 2003, ApJ, 585, 878
- Low & Smith (2005) Low, F. J., & Smith, P. S. 2005, ApJ, 631, 1170
- Maggio et al. (1987) Maggio, A., Sciortino, S., Vaiana, G. S., et al. 1987, ApJ, 315, 687
- Majer et al. (1986) Majer, P., Schmitt, J. H. M. M., Golub, L., et al. 1986, ApJ, 300, 360
- Marino et al. (2003) Marino, A., Micela, G., Peres, G., & Sciortino, S. 2003, A&A, 406, 629
- Micela (2003) Micela, G. 2003, Astron. Nachr., 324, 77
- Micela et al. (1985) Micela, G., Sciortino, S., Serio, S., et al. 1985, ApJ, 292, 172
- Micela et al. (1988) Micela, G., Sciortino, S., Vaiana, G. S., et al. 1988, ApJ, 325, 798
- Micela et al. (1993) Micela, G., Sciortino, S., & Favata, F. 1993, ApJ, 412, 618
- Micela et al. (1996) Micela, G., Sciortino, S., Kashyap, V., Harnden, F. R., & Rosner, R. 1996, ApJS, 102, 75
- Micela et al. (2003) Micela, G., Baldi, A., Cocchia, F., et al. 2003, Astron. Nachr., 324, 144
- Micela et al. (2006) Micela, G., et al. 2006, A&A, in preparation
- Miller & Scalo (1979) Miller, G. E., & Scalo, J. M. 1979, ApJS, 41, 513
- Morrison & McCammon (1983) Morrison, R., & McCammon, D. 1983, ApJ, 270, 119
- Robin & Crézé (1986) Robin, A., & Crézé, M. 1986, A&A, 157, 71
- Ryter (1996) Ryter, Ch. E. 1996, Ap&SS, 236, 285
- Schmitt (1984) Schmitt, J. H. M. M. 1984, in X-ray Astronomy 84, ed. M. Oda and R. Giacconi (Bologna: ISAS), p. 17
- Schmitt et al. (1985) Schmitt, J. H. M. M., Golub, L., Harnden, F. R., et al. 1985, ApJ, 290, 307
- Schmitt et al. (1990) Schmitt, J. H. M. M., Collura, A., Sciortino, S., et al. 1990, ApJ, 365, 704
- Sciortino et al. (1995) Sciortino, S., Favata, F., & Micela, G. 1995, A&A, 296, 370
- Sion et al. (1995) Sion, E. M., Holberg, J. B., Barstow, M. A., & Kidder, K. M. 1995, PASP, 107, 232
- Smith et al. (2001) Smith, R. K., Brickhouse, N. S., Liedahl, D. A., & Raymond, J. C. 2001, ApJ, 556, L91
- Stern et al. (1995) Stern, D., Schmitt, J. H. M. M., & Kahabka, P. T. 1995, ApJ, 448, 683
- Tagliaferri et al. (1994) Tagliaferri G., Cutispoto, R,. Pallavicini, R., Randich, S., & Pasquini, L. 1994, A&A, 285, 272
- Tovmassian et al. (2001) Tovmassian, G. H., Szkody, P., Greiner, J., et al. 2001, A&A, 379, 199
- Twarog (1980) Twarog, B. A. 1980, ApJ, 242, 242
- Vaiana (1983) Vaiana, G. S. 1983, in IAU Symposium 102, Solar and Stellar Magnetic Fields: Origins and Coronal Effects, ed. J. O. Stenflo (Dordrecht: Reidel), p. 165
- Villumsen (1985) Villumsen, J. V. 1985, ApJ, 290, 75
- Vuong et al. (2003) Vuong, M. H., Montmerle, T., Grosso, N., Feigelson, E. D., Verstraete, L., & Ozawa, H. 2003, A&A, 408, 581
- Wachter et al. (2003) Wachter, S., Hoard, D. W., Hansen, K. H., et al. 2003, ApJ, 586, 1356
- Wielen & Fuchs (1983) Wielen, R., & Fuchs, B. 1983, in Kinematics, Dynamics and the Structure of the Milky Way, ed. W. L. H. Shuter (Dordrecht: Reidel), 81
- Zuckerman & Song (2004) Zuckerman, B., & Song, I. 2004, ARA&A, 42, 685
[x]llccrrrrccc
Infrared counterparts identified for the stellar sample.
Colour information from 2MASS is provided. Errors
in the colours refer to the total photometric uncertainty
as described in 2MASS. The two sources marked with
are the two binary systems with a white dwarf.
Id. (XBSS ) Optical counterpart
2MASS counterpart
Spectral type
RA Dec
Offset J
H Ks
(J2000.0) (J2000.0)
arcsec (mag)
(mag) (mag)
IR count. Opt. spectrum
\endfirstheadcontinued.
Id. (XBSS ) Optical counterpart
2MASS counterpart
Spectral type
RA Dec
Offset J
H Ks
(J2000.0) (J2000.0)
arcsec (mag)
(mag) (mag)
IR count. Opt. spectrum
\endhead
\endfoot
J001002.4+110831 34 Psc B 00:10:02.38 +11:08:37.8 6.8
8.65 0.02 8.34 0.03 8.18 0.02 G1 -
J001051.6+105140 - 00:10:51.39 +10:51:40.2 3.4
12.47 0.02 11.96 0.03 11.85 0.02 K2 K2
J001749.7+161952 39 Psc 00:17:49.97 +16:19:51.8 3.5
6.29 0.02 6.09 0.02 6.05 0.02 F4 -
J002953.1+044524 - 00:29:53.22 +04:45:23.3 1.4
10.14 0.04 9.88 0.04 9.80 0.04 F6 -
J005822.9274016 Bok II 284 00:58:22.98 -27:40:14.0 2.2
10.84 0.03 10.35 0.03 10.24 0.02 K1 -
J012757.2+190000 - 01:27:57.15 +19:00:00.9 1.4
9.82 0.02 9.31 0.03 9.19 0.02 K2 -
J012757.3+185923 BD+18 193 01:27:57.37 +18:59:25.0 1.1
8.24 0.02 7.94 0.03 7.86 0.02 G0 -
J014100.6675328†
BL Hyi 01:41:00.38 -67:53:27.3 2.2
14.32 0.04 13.66 0.04 13.25 0.05 M6 Am
J021830.0045514 - 02:18:29.91 -04:55:13.7 1.6
10.92 0.02 10.28 0.02 10.06 0.02 M1 -
J040744.6710846 - 04:07:44.64 -71:08:47.0 0.2
14.11 0.03 13.53 0.04 13.25 0.04 M4 M23e
J040807.2712702 EXO 0408.4-7134 04:08:07.07 -71:27:00.9 1.7
9.66 0.02 9.00 0.02 8.84 0.03 K8 -
J051617.1+794408 HD 32558 05:16:17.33 +79:44:10.8 2.3
9.55 0.11 9.61 0.08 9.21 0.04 A7 -
J052048.9454128 HD 274404 05:20:49.33 -45:41:30.0 4.8
9.69 0.03 9.12 0.02 8.96 0.02 K4 -
J052155.0252200 - 05:21:55.21 -25:22:00.7 2.6
11.78 0.03 11.42 0.02 11.32 0.02 G6 -
J062425.7642958 GSC 08902-01379 06:24:25.81 -64:29:57.0 1.4
10.21 0.02 9.89 0.02 9.80 0.02 G2 -
J074359.7+744057 - 07:44:00.60 +74:40:56.4 3.7
11.89 0.02 11.50 0.02 11.41 0.02 K0 K5
J080309.8+650807 HD 65497 08:03:09.50 +65:08:08.8 2.5
6.90 0.02 6.80 0.02 6.74 0.02 A8 -
J085427.8+584158 GSC 03811-00428 08:54:27.81 +58:42:02.0 3.2
8.38 0.02 8.00 0.04 7.88 0.02 G6 -
J091043.4+054757 - 09:10:43.31 +05:48:01.0 3.6
12.82 0.03 12.29 0.03 11.95 0.03 M5 M5
J095955.2+251549 - 09:59:55.04 +25:15:51.0 3.3
10.85 0.02 10.60 0.02 10.59 0.02 F6 A9
J102044.1+081424 - 10:20:44.06 +08:14:23.4 1.5
10.35 0.02 9.76 0.02 9.47 0.02 M4 M5e
J105131.1+573439 [IUY2001] 2 10:51:30.93 +57:34:39.5 1.5
11.04 0.02 10.47 0.03 10.21 0.02 M3 M34e
J110320.1+355803 HD 95735 11:03:20.23 +35:58:11.7 8.2
4.20 0.24 3.64 0.20 3.25 0.31 M6: M2
J122655.1+012002 - 12:26:54.97 +01:20:00.3 3.1
14.39 0.03 13.80 0.03 13.57 0.05 M2 M13
J122751.2+333842 - 12:27:51.19 +33:38:43.3 0.9
9.44 0.02 8.82 0.04 8.64 0.02 M0 K7
J122837.3+015720 GSC 00282-00187 12:28:37.19 +01:57:20.4 2.0
10.90 0.03 10.26 0.03 10.04 0.02 M2 -
J122942.3+015525 GSC 00282-00477 12:29:42.47 +01:55:24.8 1.6
11.39 0.02 10.98 0.02 10.89 0.03 G9 F9G2
J123208.7+640304 - 12:32:08.90 +64:03:02.8 1.8
12.73 0.02 12.13 0.02 11.95 0.02 K7 K7
J123549.1395026 - 12:35:48.93 -39:50:24.5 2.9
9.79 0.03 9.22 0.02 8.94 0.02 M4 -
J123600.7395217 CD-39 7717B 12:36:00.55 -39:52:15.6 3.1
9.15 0.02 8.53 0.04 8.35 0.03 K7 -
J124938.7060444 IM Vir 12:49:38.68 -06:04:44.7 0.7
8.20 0.02 7.74 0.02 7.67 0.02 K0 -
J133321.2+503102 GSC 03469-00261 13:33:21.00 +50:31:03.7 2.9
10.17 0.02 9.90 0.03 9.88 0.03 F7 F6:
J133626.9342636 - 13:36:26.90 -34:26:36.5 0.5
11.85 0.04 11.36 0.04 11.21 0.03 K2 -
J134732.0+582103 - 13:47:31.95 +58:21:03.5 0.5
11.24 0.02 10.60 0.02 10.41 0.02 K9 M3e
J140219.6110458 HD 122473 14:02:19.63 -11:04:58.3 0.6
6.76 0.02 6.32 0.03 6.22 0.02 K0 -
J140936.9+261632 - 14:09:36.86 +26:16:31.9 0.7
11.18 0.02 10.55 0.03 10.35 0.02 M1 M3e
J142800.1+424409 - 14:28:00.01 +42:44:10.7 1.6
11.82 0.02 11.20 0.02 10.98 0.02 M2 -
J142901.2+423048 HD 127244 14:29:01.32 +42:30:50.6 2.0
7.73 0.02 7.41 0.02 7.33 0.02 G4 -
J143923.1+640912 HD 129390 14:39:22.83 +64:09:14.0 2.7
6.72 0.02 6.52 0.02 6.49 0.02 F4 -
J153156.6082610 HD 138372 15:31:56.45 -08:26:09.7 2.9
7.51 0.02 7.01 0.04 6.87 0.03 K2 -
J162911.1+780442†
WD 1631+78 16:29:10.31 +78:04:39.9 3.9
10.97 0.02 10.40 0.02 10.16 0.01 M2 WD
J162944.8+781128 RIXOS 122-10 16:29:44.55 +78:11:27.8 1.1
12.36 0.02 11.77 0.02 11.54 0.02 M2 M4-5e
J165313.3+021645 - 16:53:13.28 +02:16:45.9 0.7
10.19 0.02 9.94 0.03 9.88 0.02 F6 -
J165710.5+352024 - 16:57:10.47 +35:20:25.0 1.0
11.80 0.02 11.22 0.01 11.11 0.02 K4 K4e
J205847.0423704 - 20:58:47.02 -42:37:04.4 0.4
10.71 0.02 10.27 0.03 10.22 0.02 G8 -
J212635.8445046 HD 203915 21:26:35.85 -44:50:47.7 1.7
6.98 0.02 6.76 0.03 6.70 0.02 F5 -
J213840.5424241 HD 205756 21:38:40.55 -42:42:39.3 2.0
8.17 0.02 7.97 0.06 7.85 0.03 F4 -
J215323.7+173018 - 21:53:23.66 +17:30:20.1 1.7
11.13 0.02 10.58 0.02 10.48 0.02 K3 K2
J221750.4083210 - 22:17:50.40 -08:32:10.2 0.6
11.98 0.02 11.38 0.02 11.22 0.02 K8 M0e
J222852.2050915 HD 213039 22:28:52.40 -05:09:13.3 2.9
8.59 0.02 8.41 0.04 8.31 0.02 F3 -
J224833.3511900 Gru 22:48:33.29 -51:19:00.6 0.9
3.18 0.28 3.16 0.27 3.19 0.36 B9 -
J224846.6505929 - 22:48:46.62 -50:59:28.1 1.5
11.72 0.02 11.28 0.02 11.15 0.02 K0 -
J225349.6172137 - 22:53:49.69 -17:21:35.8 1.6
11.19 0.03 10.62 0.02 10.32 0.02 M4 M1-2
J230408.2+031820 23:04:08.37 +03:18:21.4 1.5
9.57 0.03 8.93 0.04 8.85 0.03 K7 -
J231541.2424125 HD 219369 23:15:41.42 -42:41:25.9 1.8
8.88 0.03 8.67 0.04 8.56 0.02 F4 -
J231553.0423800 - 23:15:52.96 -42:38:00.0 0.6
10.03 0.02 9.52 0.03 9.40 0.02 K2 -
J233325.7152240 - 23:33:25.99 -15:22:38.1 3.6
10.82 0.02 10.26 0.02 10.12 0.02 K3 K4
J235032.3+363156 - 23:50:32.36 +36:31:59.5 2.7
11.53 0.03 11.04 0.03 10.91 0.02 K1 K1
[x]lcccccccc
Best fit parameters derived from the spectral analysis
of the 58 stellar sources in the XMM-Newton Bright Serendipitous
survey. Errors are measured as the 90% confidence range.
Id. /
counts† Unabsorbed flux‡
(XBSS ) (keV) (keV)
( cm-2) (d.o.f.)
( erg cm-2 s-1)
\endfirstheadcontinued.
Id. /
counts† Unabsorbed flux‡
(XBSS ) (keV) (keV)
( cm-2) (d.o.f.)
( erg cm-2 s-1)
\endhead
\endfoot
J001002.4+110831 0.98 -
- 0.09 0.34 1.25 (66)
828 7.31
J001051.6+105140∗∗
0.10 2.01
6.60 1.33 2.12 0.69 (24)
69 0.84
J001749.7+161952 0.41 -
- 1.09 0.00 0.85 (53)
890 1.42
J002953.1+044524 0.23 -
- 0.94 5.89 1.13 (29)
361 9.25
J005822.9274016 0.81 -
- 0.04 0.13 0.81 (36)
434 1.35
J012757.2+190000 1.00 -
- 0.14 0.00 1.13 (31)
391 5.94
J012757.3+185923 0.75 -
- 0.16 0.25 0.94 (81)
1086 18.73
J014100.6675328 10.19 -
- 1.14 0.00 1.18 (328)
9567 8.01
J021830.0045514 0.34 1.16
1.27 0.16 0.30 1.21 (226)
6044 2.18
J040744.6710846 0.99 -
- 0.06 0.05 1.16 (39)
323 0.70
J040807.2712702 0.35 0.95
1.29 0.11 0.19 1.00 (215)
3222 3.97
J051617.1+794408∗
0.34 0.92
0.91 0.13 0.10 0.91 (332)
5170 2.42
J052048.9454128 0.40 0.93
0.77 0.11 0.00 0.94 (263)
3708 4.47
J052155.0252200 0.72 -
- 0.23 3.37 0.75 (54)
220 1.31
J062425.7642958 0.47 -
- 0.11 1.34 0.66 (35)
227 1.73
J074359.7+744057 0.30 1.20
5.43 0.08 2.73 0.92 (65)
1430 4.03
J080309.8+650807 0.50 -
- 1.45 0.00 1.40 (59)
707 0.96
J085427.8+584158 0.61 -
- 0.09 0.00 0.71 (62)
945 1.36
J091043.4+054757 1.02 -
- 0.04 0.21 1.05 (74)
1235 1.18
J095955.2+251549 1.01 -
- 0.12 0.76 1.05 (114)
3214 1.39
J102044.1+081424 0.33 -
- 0.03 1.33 1.15 (48)
1117 2.72
J105131.1+573439 0.32 0.93
1.14 0.15 0.05 0.94 (79)
1834 1.02
J110320.1+355803 0.27 0.71
4.18 0.06 0.00 1.29 (391)
11147 3.97
J122751.2+333842 0.26 0.89
1.23 0.21 0.00 0.70 (67)
1844 1.01
J122655.1+012002 1.08 -
- 0.08 0.00 0.80 (59)
708 0.33
J122837.3+015720 0.27 1.04
1.99 0.17 1.12 0.81 (135)
1857 1.78
J122942.3+015525 0.29 1.03
0.90 0.35 1.94 0.96 (79)
1059 1.72
J123208.7+640304 0.25 1.09
1.09 0.10 0.28 0.85 (44)
534 0.64
J123549.1395026 0.32 0.90
1.73 0.19 0.00 1.08 (216)
6004 2.16
J123600.7395217∗
0.31 1.01
0.81 0.22 0.00 1.42 (617)
34052 14.05
J124938.7060444 0.64 1.21
0.83 0.17 0.01 1.15 (517)
40463 22.39
J133321.2+503102 0.60 -
- 0.09 0.98 1.09 (170)
1190 1.25
J133626.9342636 0.98 -
- 0.07 0.03 0.48 (16)
466 0.51
J134732.0+582103 0.82 -
- 0.06 0.00 1.06 (177)
4120 1.75
J140219.6110458 0.44 -
- 1.11 2.76 1.02 (39)
491 1.16
J140936.9+261632 0.35 0.94
2.48 0.08 0.29 1.04 (95)
2402 0.78
J142800.1+424409 0.28 0.93
1.87 0.23 1.00 0.84 (90)
1226 1.07
J142901.2+423048 0.49 -
- 0.99 0.00 1.15 (59)
805 0.70
J143923.1+640912 0.49 -
- 1.11 0.01 1.35 (120)
2155 1.61
J153156.6082610 0.57 -
- 0.11 1.07 0.87 (84)
909 0.88
J162911.1+780442 0.70 -
- 0.04 0.00 1.00 (21)
280 1.13
J162944.8+781128 0.74 -
- 0.10 0.10 1.09 (9)
150 0.80
J165313.3+021645 0.64 -
- 0.56 0.09 0.93 (79)
1318 0.70
J165710.5+352024∗∗
0.85 -
- 0.08 0.06 1.21 (7)
232 1.24
J205847.0423704 0.74 -
- 0.14 0.34 1.21 (72)
1096 0.71
J212635.8445046 0.62 -
- 0.11 0.17 1.14 (78)
1899 1.52
J213840.5424241 0.47 -
- 0.97 0.00 0.97 (118)
1261 0.72
J215323.7+173018 1.31 -
- 0.14 1.05 0.98 (75)
507 0.69
J221750.4083210 0.23 1.09
3.61 0.71 2.44 0.99 (49)
546 1.76
J222852.2050915 0.52 -
- 0.50 0.36 1.04 (131)
1550 0.92
J224833.3511900 0.30 -
- 0.65 4.94 1.03 (26)
170 2.41
J224846.6505929 0.69 -
- 0.09 0.00 0.55 (20)
139 0.52
J225349.6172137∗∗
0.13 -
- 4.74 8.88 0.94 (20)
71 61.89
J230408.2+031820 0.31 0.91
1.48 0.15 0.54 1.23 (81)
1936 4.17
J231541.2424125 0.47 -
- 0.71 0.19 1.08 (79)
862 0.69
J231553.0423800 0.78 -
- 0.02 0.92 1.01 (70)
1247 0.73
J233325.7152240 0.29 0.97
2.41 0.09 1.09 1.31 (153)
2853 2.35
J235032.3+363156 1.13 -
- 0.34 0.00 0.77 (29)
152 1.05
† Total net counts in the EPIC (MOS + PN)
chips.
‡ Unabsorbed flux in 0.5–10 keV.
∗ For these sources, a 3T-model has been
used to obtain an accurate fitting to the hard tail of
their X-ray spectrum. The parameters of their third thermal
component are
a) XBSS J051617.1+794408 (HD 32558):
keV,
and
b) XBSS J123600.7395217 (CD-39 7717B, TWA 11B):
keV,
.
∗∗ Problematic sources. The fitting in these stars
is much less accurate due to the few number of
counts in their spectra after background
subtraction.
| Star | distance | ||
|---|---|---|---|
| (XBSS ) | (pc) | (cm-3) | (erg s-1) |
| J001002.4+110831 | 99.60 | 54.30 | 29.94 |
| J001749.7+161952 | 46.17 | 52.33 | 28.56 |
| J080309.8+650807 | 114.02 | 52.77 | 29.17 |
| J110320.1+355803 | 2.55 | 51.21 | 26.49 |
| J123600.7395217 | 67.07 | 53.56 | 29.88 |
| J212635.8445046 | 114.16 | 53.81 | 29.37 |
| J213840.5424241 | 77.28 | 52.49 | 28.71 |
| J224833.3511900 | 39.75 | 52.73 | 28.65 |
| J231541.2424125 | 99.11 | 52.67 | 28.91 |