Ages and Metallicities of Extragalactic Globular Clusters from Spectral and Photometric Fits of Stellar Population Synthesis Models
Abstract
Spectra of galaxies contain an enormous amount of information about the relative mixture of ages and metallicities of constituent stars. We present a comprehensive study designed to extract the maximum information from spectra of data quality typical in large galaxy surveys. These techniques are not intended for detailed stellar population studies that use high quality spectra. We test techniques on a sample of globular clusters, which should consist of single stellar populations and provide good test cases, using the Bruzual-Charlot 2003 high resolution simple stellar population synthesis models to simultaneously estimate the ages and metallicities of 101 globular clusters in M31 and the Magellanic Clouds by fitting their integrated spectra and photometry. The clusters cover a wide range of ages and metallicities, 4 Myr tage 20 Gyr and 1.6 [Fe/H] +0.3, estimated by other methods in the literature. We compare results from model fits to both the spectra and photometry and find that fits to continuum-normalized spectra over the entire range available, typically 3500 Å to 1 m for this sample, provides the best results. For clusters older than 1 Gyr we agree with literature ages to 0.16 dex (35%) and [Fe/H] to 0.12 dex. For younger clusters we agree with literature ages to 0.3 dex (63%), but cannot constrain the metallicity. It is particularly important to use the entire continuum-normalized spectrum to avoid problems with model continua for young objects and to break age-metallicity degeneracies of broadband photometry. Our required S/N is 15-30 Å-1 for 20% age uncertainties and 30-55 Å-1 for 10% uncertainties over spectral resolutions of = 5-25 Å. This technique should work well for the age-metallicity parameter space expected for early-type galaxies at z1, although individual galaxy spectral S/N may require the coaddition of a few like objects. Lack of accurate flux calibration in large surveys is not an issue for the continuum-normalized spectra.
1 Introduction
Understanding when and how different types of galaxies formed in the universe is an age old problem. In recent years the hierarchical merging scenario (White & Rees, 1978; Peebles, 1980; White & Frenk, 1991), where large galaxies are built up over time through mergers of smaller objects, has been the leading theory for the mechanism by which structure formed in the universe. Large galaxy surveys have been undertaken to provide observational evidence for how galaxies formed. From their observations, we are compiling a snapshot of galaxies througout time. At z3 we find both massive starbursting galaxies in highly clustered regions (Neri et al., 2003; Blain et al., 2004; Chapman et al., 2004) and actively star forming galaxies elsewhere (Papovich, Dickinson, & Ferguson, 2001). At z2 we see galaxies that are still forming stars, but have redder colors and larger masses from continued star formation since z3 (Steidel et al., 2004). At z1-2 a population of extremely red objects (EROs) are seen by near infrared surveys such as FIRES (Labbé et al., 2003), K20 (Cimatti et al., 2002), and MUNICS (Drory et al., 2001), many of which appear to contain older stellar populations that have experienced passive evolution (Förster Schreiber et al., 2004; Daddi et al., 2002; Saracco et al., 2003). At z1 we see a decrease in global star formation rates (Lilly et al., 1996; Madau et al., 1996, 1998; Steidel et al., 1999; Barger et al., 2000; Thompson et al., 2001; Wolf et al., 2005), an increase of stellar mass densities in early-types (Hogg et al., 2002; Bell et al., 2003; Dickinson et al., 2003; Kauffmann et al., 2003b; Rudnick et al., 2003; Cimatti et al., 2004; Wolf et al., 2005), and a change in galaxy morphologies to more ordered systems (Strateva et al., 2001; Dickinson et al., 2003). At z1 we see early-type galaxies that appear to have formed at z1.5-2 in the field (Im et al., 2002; Gebhardt et al., 2003) and at z2-3 in clusters (van Dokkum et al., 1998; Thomas et al., 2005), possibly from those that were seen as star forming galaxies at z2 and starbursts at z2-3.
This observed galaxy demography, however, is not matched by the semi-analytic hierarchical galaxy formation models. Although the models do well on predicting the global star formation rate and stellar mass densities, they do not match observations on the correct proportions of galaxy types as a function of redshift (Somerville, 2004). In particular, not enough EROs or submm galaxies are formed at z1-3 in the models. We do not yet understand the details of how galaxies assembled their mass, although the epoch of z1-2 continues to stand out as an important transitional period. Detailed studies of individual galaxies around this epoch will uncover essential clues about how they assembled into the distribution of galaxies that we see today.
One such detail for study is determining ages or formation redshifts of galaxies in this epoch. Various techniques have been used in the past to determine an overall age from integrated galaxy light, including using colors to estimate age from the amounts of old (red) and young (blue) stars, using the equivalent widths (EWs) of specific spectral lines or breaks that are known to be sensitive to stellar age (Trager et al., 2000a, b; Kauffmann et al., 2003a, b), matching galaxy spectra to stellar spectra (Stockton et al., 1995; Dunlop et al., 1996; Spinrad et al., 1997), using fits of stellar population synthesis models to spectral energy distributions (SEDs) obtained from broadband or narrowband photometry (Papovich, Dickinson, & Ferguson, 2001; Cimatti et al., 2004; Drory et al., 2004; McCarthy et al., 2004), and fitting galaxy spectra with model spectra (Yi et al., 2000; Nolan et al., 2003; Cimatti et al., 2004; Ferreras & Yi, 2004; McCarthy et al., 2004). We will refer to photometric SEDs throughout the paper as “SEDs,” not to be confused with spectra.
Photometry has been widely available and is a good way to cover a larger spectral range than typically available with spectroscopy to get information about different stellar populations, but it lacks spectral details and suffers from more degeneracy between age, metallicity, and dust content. Recent surveys with spectra of hundreds or thousands of galaxies, in addition to the photometry, provide more information for detailed analyses. Furthermore, the release of population synthesis models at high spectral resolution (Bruzual & Charlot, 2003) allows one to take advantage of the detailed information contained in individual lines over the entire observed spectral range, rather than relying on only a few lines or on more degenerate broadband colors.
In this work, we evaluate age and metallicity estimation techniques on globular clusters by comparing results from Bruzual & Charlot (2003) simple stellar population (SSP) model fits to the spectra, broadband photometry, and line indices of the clusters. Globular clusters provide a simpler test case than galaxies since their stars likely provide a coeval and nearly homogeneous metallicity population that has no internal dust extinction. We test the utility of using these models to estimate ages and metallicities of high redshift galaxies by first applying them to a sample of extragalactic globular clusters from the Santos et al. (2002) public database that have integrated spectra, photometry, and age or metallicity estimates obtained by other methods. Galaxies will be discused in a future paper.
This paper is arranged as follows. Globular cluster spectra and photometry are described in §2, comparison ages and metallicities from the literature are described in §3, the stellar population synthesis models are described in §4, our model fitting procedures are explained in §5, age and metallicity results are presented in §6, a discussion of issues is given in §7, and conclusions are summarized in §8.
2 The Cluster Data
The Santos et al. (2002) online spectral database provides our sample of extragalactic globular clusters that cover a significant range of age and metallicity, making their results applicable to evolving galaxies. We chose those clusters that also have photometry available in the literature, which includes 79 clusters in the Large Magellanic Cloud (LMC), 4 clusters in the Small Magellanic Cloud (SMC), and 18 clusters in M31. The spectra were obtained with the 1.52 and 2.2-meter telescopes at ESO in La Silla (Bica et al., 1986a, 1987a, 1987b, 1990, 1994), the 2.15-m CASLEO telescope in Argentina (Santos et al., 1995), the 3.6-m CFHT in Hawaii (Jablonka et al., 1992), and the 4.2-m William Herschel Telescope in La Palma (Jablonka et al., 1998).
The data include near ultraviolet, optical, and near infrared spectra, covering a total wavelength range of 3200-10000 Å for some clusters, and varying in spectral resolution from 6 to 23 Å. We should note that for all clusters except a few in M31, this resolution element is larger than the = 10 Å required for Lick/IDS line indices. All available spectral segments for each object are used to utilize maximum wavelength coverage, but since they originate from a number of different sources, flux calibration between regions may not be consistent. Table Ages and Metallicities of Extragalactic Globular Clusters from Spectral and Photometric Fits of Stellar Population Synthesis Models lists each object with its specific wavelength coverage, spectral resolution, and source references.
We compile photometry of the clusters from various sources in the literature. Bica et al. (1996) provide UBV photometry for the LMC clusters with 20% of the objects taken from van den Bergh (1981) and the rest re-observed by the authors at CTIO or CASLEO. Persson et al. (1983) provide VJHK photometry for LMC clusters from observations on 1-2.5 meter telescopes at Las Campanas and Cerro Tololo observatories. For the SMC clusters, Persson et al. (1983) provide VJHK and UBV are from Santos et al. (1995) who use photometry from van den Bergh (1981) and a few other sources. For the M31 clusters, Battistini et al. (1993) supply BVRI from observations on the 152-cm telescope in Loiano, Bologna and on the 4-m KPNO telescope. Barmby et al. (2000) provide UBJHK from observations on the 1.2-m telescope at the Fred L. Whipple Observatory.
3 Comparison Ages and Metallicities
Even for a given globular cluster, a wide range of age and metallicity estimates typically exists in the literature. This is not completely surprising given the different methods employed to derive the parameters, some based on broadband colors and others on very narrowband spectral line strengths, but the dispersion in estimates is quite large for many clusters. We will compare our results to age and metallicity values from a number of sources and different techniques to show where our values lie in the total spread. Literature ages and metallicities for specific clusters can be found in Table 4, along with our derived values.
One of the oldest techniques for measuring the age of a star cluster is using its integrated UBV colors. When placed on color-color plots, globular clusters follow a sequence that can be related to age. We use MC cluster U-B color ages that were determined by Bica et al. (1990) and Santos et al. (1995). When photometry is available for individual stars in a cluster, the location of the main sequence turnoff (MSTO) on a color-magnitude diagram (CMD) can be used to determine the age of the cluster. We use a large compilation of MSTO ages for MC clusters from Hodge (1983). Refinement of the MSTO technique is achieved by fitting theoretical isochrones to the CMDs. We take CMD fit ages from Elson & Fall (1988) and Girardi et al. (1995, 1998). We also add comparison ages determined from photometric fits to GISSEL96 model SEDs (Bruzual & Charlot, 1993) in the BATC filter system, using 15 intermediate bandwidth passbands, by Jiang et al. (2003), and from the line index ratios H / Fe I 4045 and Ca II H/K by Leonardi & Rose (2003), which were developed to work better on younger objects than the typical Lick line indices for use on older objects. We consider the Leonardi & Rose line index ratio ages to be some of the most secure, given that they are determined from high quality spectra and are tailored for the younger ages of many clusters in this sample. Santos & Piatti (2004) utilize diagnostic diagrams constructed from EW sums of metal (Ca II K, G band, Mg I) and Balmer (H, H, H) lines, which are calibrated against literature values and placed on homogeneous age and metallicity scales, to determine ages and metallicites of MC clusters. We also include these in our comparison values of age and metallicity.
Fitting theoretical ishchrones to cluster CMDs is generally accepted as the most secure age determination possible when using photometry, however the results do vary between sets of ishochrones. The absolute derived age depends on model zeropoints and uncertainties. Schiavon et al. (2002) find that Padova isochrones with AGB stars included underpredict the luminosity function of giants by 0.2-0.3 dex when compared to observations of 47 Tuc, resulting in an overprediction in the spectroscopic age of 2-3 Gyr for old stellar populations. Young stellar populations are much less affected. Additionally, the Padova isochrone uncertainty in Teff of 75 K leads to a 1 Gyr age uncertainty or 0.1 dex uncertainty in the [Fe/H] scale. Vazdekis et al. (2001) also find discrepancies between CMD and spectroscopic ages of 47 Tuc due to the exclusion of -enhancement and atomic diffusion in evolutionary models, causing a zeropoint offset. If 47 Tuc is representative of other old stellar populations, for clusters in the 10-14 Gyr age range these model isochrone issues could lead to spectroscopic based age discrepancies of 20-40 % when compared to CMD based values.
Large homogeneous samples of globular cluster metallicities are harder to find, since metallicity cannot be as accurately determined from photometry and typical methods require high quality spectra. However, some photometric techniques have been calibrated to spectra. Of these we use [Fe/H] values from VJK colors by Cohen & Matthews (1994), fits to CMDs (Seggewiss & Richtler, 1989; Sagar & Pandey, 1989; Suntzeff et al., 1992; Girardi et al., 1995; Dirsch et al., 2000; Johnson et al., 2001; Piatti et al., 2002), and fits to GISSEL96 model SEDs by Jiang et al. (2003). Our more secure comparison metallicites come from spectra-based techniques. For these we use [Fe/H] from the Leonardi & Rose (2003) line index ratios and their comparison literature values that were derived from EWs of Ca, Fe, Mg, and Na lines (Cohen, 1982), and from EWs of the Ca II triplet at 8500 (Olszewski et al., 1991; Da Costa & Hatzidimitriou, 1998). We incorporate the comparison literature values used by Santos & Piatti (2004), which include metal line abundances (Jasniewicz & Thévenin, 1994; Hill et al., 2000), line indices (Beasley et al., 2002), and an infrared index at 1.6 m (Oliva & Origlia, 1998). And finally we use a combination of line indices and spectral breaks from Huchra et al. (1991): D(4000), CNB 3883 Å, G-band 4300 Å, MgH, Mg b, and Fe 5270 Å.
4 Stellar Population Synthesis Models
We use the high spectral resolution (R2000) SSP “standard model” from Bruzual & Charlot (2003; hereafter BC03) that utilizes the STELIB/BaSeL 3.1 spectral library, the Padova 1994 evolutionary tracks, and the Chabrier (2003) initial mass function (IMF) with stellar mass limits of 0.1 and 100 M☉. They provide model spectra at [Fe/H] = 2.25, 1.65, 0.64, 0.33, +0.093, and +0.56, which we linearly interpolate at each wavelength point to a grid of spectra that spans [Fe/H] of 2.2 to +0.5 in increments of 0.1 dex, and ages of 1 Myr to 20 Gyr in increments of 2 Myr for 110 Myr, 20 Myr for 10100 Myr, 200 Myr for 1001000 Myr, and 1 Gyr for 120 Gyr.
The BC03 models include thermally-pulsing asymptotic branch stars (TP-AGB), making use of the multi-metallicity models of Vassiliadis & Wood (1993) that have been calibrated on stars in the Galaxy, LMC, and SMC. The importance of these stars, which have a strong influence on the integrated near infrared light from star clusters of certain ages, will become apparent later in the paper. This phase can dredge up carbon in the stellar atmospheres, leading to carbon-rich stars, which are also very red and can dominate the near infrared light from some clusters. Although no simple prescription can be expected to match all clusters, these stars must somehow be included. Bruzual & Charlot (2003) achieve this by defining the transition to carbon stars and the duration of this phase with the models of Groenewegen & de Jong (1993) and Groenewegen et al. (1995). This semi-empirical prescription for TP-AGB and carbon stars has been tested on and provides good agreement with observed colors of Magellanic Cloud clusters and with optical and near infrared surface brightness fluctuations of metal-poor Galactic globular clusters and more metal-rich nearby elliptical galaxies (Liu et al., 2000).
5 Data Preparation and Model-Fitting Procedures
Our approach is to use the maximum amount of information possible for each object. Broadband photometry often covers a much wider spectral range than spectroscopy, providing better constraints on the possible mixes of stellar types, but suffers from age-metallicity degeneracy. However, by combining broadband information with detailed spectral analysis, we hope to better constrain model fits and thus derived ages and metallicities. We investigate the ability of both broadband and detailed spectral features of the models to estimate age and metallicity of the globular clusters by fitting models to the full spectrum, to the continuum-normalized spectrum, to the continuum shape, to photometry, and to spectral line indices of the clusters. Each of these fitting procedures is described in detail in the following sections.
-
•
Full spectrum fits utilize information from both the line strengths and the continuum shape.
-
•
Continuum-normalized (CN) spectrum fits use only the information contained in the lines, losing important continuum information, but also removing any adverse effects of inaccurate flux calibration in the data or continuum shape errors in the models. Model continua problems are particularly possible in the near infrared due to the inability to properly account for the number of TP-AGB or carbon stars that can contribute much of the light at these wavelengths.
-
•
Continuum fits use only the continuum shape that was removed from the spectrum.
-
•
Photometry fits cover a much broader wavelength range, but lose detailed spectral information and may also be affected by continuum shape problems in the data or models.
-
•
Line index fits move from broad to narrow and focus only on specific spectral lines that are known to be sensitive to metallicity or age. We evaluate these specific lines in the models by calculating the indices directly from model spectra and comparing those to line indices calculated from the cluster spectra in the same way.
5.1 Spectra
The spectra for each object in the Santos et al. (2002) database consist of near ultraviolet, optical, and near infrared segments from multiple sources at spectral resolutions of 6-23 Å. We splice all spectra together to cover the widest possible range for each cluster. No noise or sky spectra are included in the database, so we must estimate the noise from the spectra. To do this we calculate the standard deviation of the spectrum in 100 Å bins and scale the resultant signal-to-noise ratio (S/N) spectrum to match the average S/N value quoted in the source publications for some objects. For those objects that do not have quoted S/N values, the standard deviation spectrum provides the noise. This likely overestimates the noise since absorption lines will increase the standard deviation of a bin, but the required scaling is typically less than 10%.
We prepare the data for fitting by marking regions that contain emission lines, noise spikes, and sky background residuals, as well as two regions for which the STELIB stellar library used in the models has problems with telluric features (6850-6950 Å and 7550-7725 Å). These regions are masked and deweighted for each cluster by significantly lowering its S/N spectrum over the affected wavelengths. We smooth the grid of model spectra, which have an intrinsic resolution of 3 Å, to the wavelength dependent resolution of each cluster and fit its spectrum using two free parameters, age and metallicity, and a S/N-weighted normalization constant, , which is uniquely determined for each model. We select the best fitting model by calculating the summed for each model spectrum of a given age and metallicity, relative to the cluster spectrum, and selecting the model in the grid with the minimum value. In the calculation, we use the previously determined cluster noise spectrum as the for the flux, fi, at each wavelength bin, i, for each model, n, as given in Equations 1 and 2. Once the best fitting model is determined for a cluster, we inflate its noise until the =1 to include any additional noise sources and to better estimate confidence contours and error bars. If, after this process, the estimated errors are smaller than the distance to the next model grid point, an error bar of half this distance is assigned to the cluster for both age and metallicity.
| (1) |
| (2) |
Errors on age and metallicity estimates are determined from the contours. The S/N of the data controls the size of these contours, and thus the confidence of the derived parameters. Typical levels for the globular clusters are S/N100 per resolution element. Figure 1 shows a simulation of the effect of S/N on the confidence of the derived age and metallicity for NGC 419 in the SMC, achieved by artificially adding different levels of gaussian noise to its spectrum and fitting models to each of the noisy continuum-normalized spectra. The simulated S/N per resolution element from top left to lower right in Figure 1 is 99, 22, 12, 8, 6, and 4. Solid, dashed, and dotted lines represent 1, 2, and 3 contours. The color bars give the values for confidence levels of 68.3% (=2.3), 90%, 95.4%, 99%, 99.73%, and 99.99% (=18.4) for two degrees of freedom. Black dots mark the locations of models in the age-metallicity grid. The best fitting model is marked by a black cross in each panel. The age and metallicity from the best fitting model in the highest S/N case is marked by a yellow circle in each subsequent panel for comparison.
Two things become apparent from these plots. First, as the confidence contours grow with decreasing S/N, metallicity becomes harder to constrain than age. In some low S/N conditions (e.g. the last panel) multiple islands of age-metallicity combinations arise as equally likely answers. The best fitting model in each panel does not always overlap the 1 contours of all other panels, however, this mostly happens in the [Fe/H] dimension and those values are less secure than the ages. This is our first indication that metallicity is poorly constrained, compared to ages. The second point is that we find a limiting S/N below which the estimated age and metallicity become unreliable. This happens somewhere between S/N = 22 and 12 in these plots, at which point the contours in the low S/N cases do not overlap the estimates from the highest S/N case. We find that the S/N must be 15 per resolution element (S/N5 Å-1) for =13-23 Å to adequately constrain the age. Metallicity is harder to constrain under all conditions. A more detailed analysis of limiting S/N and spectral resolution can be found in §6.5.
5.2 Continuum-Normalization
Errors in flux calibration of the spectra can induce errors in derived ages and metallicities. Additionally, model continua can be off in the near infrared due to stochastic contributions from TP-AGB stars in 0.1 to 1 Gyr old populations and from carbon stars in populations of age 0.3 to 2.5 Gyr (Frogel et al., 1990; Marigo et al., 1996; Girardi et al., 1998). These variations can result in differences of nearly 2 magnitudes in V-K (Bruzual & Charlot 2003, Figure 8). AGB stars in the thermally pulsing phase can contribute over 80% of the K-band light (Maraston, 2005), the exact amount of which is hard to predict since this phase involves ejection of the outer stellar envelopes and geometry-dependent obscuration of the central stars. The BC03 models include TP-AGB and carbon stars semi-empirically, but in any given cluster the K-band light can vary depending on the numbers of stars it actually has in these phases.
To avoid these issues, we normalize out the continua with a median-binning routine that uses bin sizes tailored to work for different classes of objects. The young clusters of the Magellanic Clouds have strong Balmer discontinuities and need to be sampled by small bins to correctly trace this sharp continuum break, while older objects in M31 require larger bins to smooth over absorption troughs in the red part of the spectrum. The bins that we use are 100 Å wide blueward of 4000 Å and 300-700 Å wide redward of 4000 Å. The points in each bin are sorted by flux values, the lower 1/2 of the points are ignored to reduce the weight of absorption lines, the highest few points are rejected to ignore noise spikes, and the median of the remaining flux values is assigned to that bin. The medianed bin fluxes are linearly connected and the object spectrum is divided by the result, providing a flat continuum. The same binning parameters used for an object are also used on each model spectrum in the grid.
Removal of the continuum shape should not affect the values of line indices measured on the spectrum, providing a good check of our procedure. We applied this test, as suggested by the referee, by choosing a random sample of 25 globular clusters spanning the entire age range and measured line indices before and after continuum normalization. The indices used were Mgb, Fe5270, Fe5335, H, H, H, H, H, G4300, Fe, and [MgFe]′. Only the positive index values that could be reliably measured were used, as in §6.4. On average the values change by less than 1%, and all line index median differences for the 25 clusters are below 3% with no correlation to the derived cluster age.
The continuum shape that we divide out is also fit by model continua and referred to throughout the paper as “continuum fits.” Different types of spectral fits are illustrated in Figure 2 for an old cluster, G177 in M31, and a young cluster, NGC 1711 in the LMC.
5.3 Photometry
To test ages and metallicities derived from broadband features over a wide baseline, we fit models to the UBVJHK photometry from the literature, using all of the bands that are available for each cluster. Our model fitting procedure requires scalable fluxes, so we convert cluster magnitudes to fluxes using the UBV zeropoints from Bessell (1979) and the JHK zeropoints from Wamsteker (1981). We obtain model fluxes for each band by convolving filter transmission curves with the model spectra. These fluxes are scaled to those of the object with an overall S/N-weighted normalization parameter during the fit. The best fitting model is selected by minimization, using Equations 1 and 2 with i now representing each photometric band. Errors are not given for all literature photometry, so we initially assume a 5% photometric flux error in all bands for each cluster, which is then adjusted to make =1 for the best-fitting model. Fitting parameters are age and metallicity. Photometric fits are also illustrated in Figure 2.
5.4 Line Indices
Lick line indices have been used for some time (Faber et al., 1985; Burstein et al., 1986; Gorgas et al., 1993; Worthey et al., 1992, 1994; Worthey, 1994; Worthey & Ottaviani, 1997; Trager et al., 1998). They are based on a very specific set of data and their application to new objects is somewhat complicated. To properly use Lick/IDS indices, some of the same stars must be observed with the instrumental setup of the new objects and the spectra of the new objects must be convolved to exactly the same wavelength dependent resolution as the original Lick data, which varied from run to run during the development of the indices. Very small differences in the wavelengths can cause large errors in the indices. To investigate the robustness of these specific lines in the model spectra, we calculate line indices directly from the models, similar to the calibrations done in Bruzual & Charlot (2003). Direct application of the models for this purpose would avoid the step of convolving the object spectra to the estimated Lick resolutions. If the models are smoothed to the same spectral resolution as the cluster data, indices can be calculated directly from both spectra in the same manner. However, the bandpasses of the Lick indices were originally chosen for data with = 8-12 Å (Worthey & Ottaviani, 1997). Specific lines in lower resolution spectra may begin to lose age and metallicity information. Nevertheless, given the long history of the use of line indices, we wanted to attempt a variation of this technique on data with resolution and S/N representative of that from typical galaxy surveys.
First, we broaden the model spectra to match the resolution of each object, which may vary for wavelength regions obtained on different instruments. Then, we calculate indices for the lines in the Lick system using the passbands defined in Trager et al. (1998) and Worthey & Ottaviani (1997). To these we add Fe, an average of Fe 5270 and Fe 5335; Dn(4000), the 4000 Å break strength using the narrow passbands defined in Balogh et al. (1999); CNB 3883 Å, MgH, and Ca II H+K, as defined by Brodie & Huchra (1990); and [MgFe]′ = , as defined by Thomas et al. (2003). The [MgFe]′ index has been found to be a good tracer of total metallicity and to be insensitive to /Fe enhancement (for spectral resolution near 10 Å), which may be important for some of the globular clusters in this sample.
We calculate the indices as described in Trager et al. (1998), by connecting the average flux values of the pseudocontinua sidebands with a straight line and integrating the flux under that line over the index passband. Indices (or break strengths) are calculated for CNB, H, H, CN1, CN2, Ca4227, G4300, H, H, Fe4383, Ca4455, Fe4531, C24668, H, MgH, Fe5015, Mg1, Mg2, Mgb, Fe5270, Fe5335, Fe5406, Fe5709, Fe5782, Na D, TiO1, TiO2, [MgFe]′, Fe, and Dn(4000). Indices for model spectra are calculated in the same manner. We select the model with the smallest sum of absolute value residuals between its index values and the corresponding indices derived from a cluster’s data. The age and metallicity of this closest matching model are adopted as the estimates for the cluster; no interpolation is performed between model grid points. To facilitate comparisons with the literature, we repeated the model selection using different subsets of the indices listed above: all indices simultaneously; Huchra et al.’s (1991) group of 6, CNB, Dn(4000), G4300, MgH, Mgb, and Fe5270; and H-[MgFe]′ as in Thomas et al. (2003).
6 Results
Examples of model fits are shown in Figure 2 for old and young clusters. Panels a,c,&e are the cluster G177 in M31 and panels b,d,&f are NGC 1711 in the LMC. The full spectrum fits are shown in a&b, the continuum-normalized spectrum fits are shown in c&d, and the continuum fits are shown in e&f. Photometry fits are also shown in a&b with U, B, V, J, and K bands for G177 and U, B, V, J, H, and K bands for NGC 1711. The circles are the object photometry and triangles are model fluxes from the best photometric fit. The solid lined black spectra are the clusters, the dashed cyan lines are best fitting models from the spectral fits, and the dotted green lines are spectra corresponding to the best fitting models from the photometry fits. The model spectra corresponding to the best fitting photometry are normalized to the cluster spectra at V band in these plots. In the continuum fits, black lines are the data and green lines are the models. The resulting ages and metallicities from the different types of fits are given in the plot labels.
For these two clusters the ages derived from the different types of model fits nearly agree at 20 Gyr for G177 and about 0.1 Gyr for NGC 1711. The agreement between photometric and spectroscopic fits seen here is not always the case. G177 in Figure 2a illustrates a case where the photometry through K band reveals a redder SED than the optical spectrum. In this case, the best fitting photometry model has a higher metallicity than the model that best fits the spectrum to make the object redder, an effect of age-metallicity degeneracy. A similar effect is seen in some of the young clusters, presumably due to a near infrared excess from TP-AGB or carbon stars in that case. Some examples of such clusters within the affected age range of 0.1-2 Gyr are shown in Figure 3.
6.1 Different Model Fitting Techniques
To evaluate the different model fitting techniques, we first compare their results to each other. In the following sections we compare our results to the literature. Figure 4 compares the ages derived from CN spectrum, full spectrum, photometry, and continuum fits. Clusters with average literature ages 1 Gyr are maked with yellow circles and 1 Gyr with cyan diamonds. Although the general trends of the ages agree, there are differences in the results. When compared to CN spectrum fits, the methods that contain the continuum overestimate the ages of many clusters younger than 1 Gyr. We believe that this is due to red supergiant stars for clusters in the age range of a few to tens of Myrs and TP-AGB stars for clusters in the age range of 0.1 to 1 Gyr. Both of these types of stars can have stocastic effects in star clusters because of their extremely high luminosities. If more light from them appears in the integrated spectra of the cluster than is included in the models, the cluster SED will appear redder than the model, forcing an older redder model SED as the best fit. All fitting methods that contain model continua will have this same bias. This effect is discussed further in comparison with literature ages in §6.2.
For clusters with average literature ages 1 Gyr our tightest estimated age correlation is seen between the full spectrum and continuum fits (Figure 4c), both of which contain the spectral shape. The median fractional age offset, relative to the average literature age, between these fits is 0.04 for 63 clusters. The fact that the continuum-full spectrum correlation is tighter than the CN-full spectra correlation (fractional offset of 2.40) suggests that the continuum shape has a larger effect than the spectral lines in constraining the ages of these young globular clusters for our employed fitting methods. Therefore, any problems in the continuum shape of the data or models will have grave effects on the derived ages. For the clusters older than 1 Gyr our tightest estimated age correlation is between the CN spectrum and photometry fits (Figure 4b), with a median fractional offset of 0.18 for 12 clusters.
For young clusters the metallicities obtained from our different techniques show virtually no correlation, with a tendency for the continuum to give higher metallicities than the full spectrum. For clusters older than 1 Gyr there is a very weak correlation between metallicities obtained with continuum and full spectrum fits, possibly indicating that the derived metallicity has a stronger dependence on the continuum shape than the spectral lines for our fitting method.
6.2 Ages
In Figure 5 we compare our globular cluster ages to those obtained by other methods in the literature. The thick cyan horizontal bars connect points that represent the same cluster, but that have ages from multiple sources in the literature. These illustrate the large spread in previously derived ages. The thin horizontal bars are the quoted errors on the literature ages and the thin vertical bars are our 1 errors on ages derived from model fits. Note that the errors are much larger for the photometry fits, reflecting more degeneracy when using broadband colors than when using spectra or the continua shapes.
Over the entire age range spanned by the clusters and considering all literature age estimation techniques, our CN spectrum fit ages best match those from the literature. The average offsets and rms scatter our ages from groups of literature values based on different techniques are given in Table Ages and Metallicities of Extragalactic Globular Clusters from Spectral and Photometric Fits of Stellar Population Synthesis Models, where column 1 gives values for all clusters in the sample that have literature ages and column 2 excludes two outliers (for reasons explained in §6.2.1) and the clusters that only have literature values from photometric fits to BC96 models (because these used only a few fixed metallicity values in the model grid, which could skew the derived ages, and they are based on old models). Excluding these points, our CN spectrum fits compared to the averages of the literature values for each object have an average offset of 0.29 dex (0.19 Gyr) with a dispersion of 0.36 dex (1.00 Gyr).
Our photometric ages have an average offset of 0.59 dex (0.48 Gyr) and dispersion of 0.76 dex (1.19 Gyr). There are some systematic differences between the two sets of results. The scatter of the CN spectrum fit points is more uniformly distributed around the literature values, unlike the photometric points that tend to overestimate the age, particularly for the younger clusters. The full spectrum fits, which contain the continuum, also overestimate the ages below 1 Gyr, with an average offset of 0.69 dex (0.54 Gyr) and a dispersion of 0.9 dex (3.2 Gyr). This is the same effect that was seen when comparing our fits with and without the continua included.
We now return to stars that can strongly affect the continua shapes. Detailed studies of such stochastic effects in star clusters can be found in Bruzual & Charlot (2003), Cerviño et al. (2000, 2001, 2002, 2006), and Maraston (2005). Our photometric fits, in particular, show two different age ranges where our best-fit ages depart from literature ages on the high side (Figure 5c): 4 to 100 Myr and 0.1 to 1 Gyr. The age range of 0.1 to 1 Gyr would be affected by TP-AGB stars. If the model prescription for these stars does not exactly match those in the clusters, then the older ages from fitting methods that include the continuum could be explained by older, redder spectra giving the lowest for clusters that have this near infrared excess. Our derived ages also scatter to older values for clusters younger than 0.1 Gyr when using models that include the continuum shape. This effect is likely due to stocastic red supergiants, which have been observed with estimated masses up to 120 M☉ in the LMC (Massey et al., 2005). These stars will affect clusters younger than a few tens of Myrs. Either the number of red supergiants is underestimated in the BC03 models, or the upper mass cutoff of 100 M☉ for the Chabrier IMF is not quite high enough for the LMC. See §6.2.1 for a discussion of two LMC clusters that are dominated by supergiants, which are also our extreme outliers in the CN spectrum fits of Figure 5a.
Because of the large age range covered by the clusters, it is perhaps useful to look at the behavior of the fractional age errors relative to the literature values, which are plotted in Figure 6. Overall, the CN spectrum fits provide ages with fractional offsets from the literature of 61%, while the photometry does much worse at 1048%. If we consider younger and older clusters separately, the CN spectrum fits do better than photometry on the average age offsets for both young and old clusters, but the photometry does better on fractional errors for the older objects. For clusters with ages 1 Gyr, the CN spectrum fits have an average offset of 63% (0.30 dex or 0.09 Gyr) and dispersion of 0.37 dex (0.35 Gyr), while the older clusters have an offset of 35% (0.16 dex or 1.63 Gyr) and dispersion of 0.17 dex (3.78 Gyr). The dispersion is higher below ages of 0.1 Gyr even though the CN spectra are not affected by the continua effects mentioned earlier. This increased dispersion is likely due to the degeneracy of many spectral lines in this age range (see Figure 10 and §6.4). The photometry fits do much worse fractionally on young clusters with an average offset of 1115% (0.62 dex or 0.38 Gyr) and dispersion of 0.78 dex (1.02 Gyr), and better on the fractional errors of older clusters with an offset of 23% (0.10 dex or 2.06 Gyr) and dispersion of 0.11 dex (2.67 Gyr).
The lowest fractional errors for the CN spectrum fits occur for the Leonardi & Rose (2003) line index ratios and for the clusters older than 1 Gyr, both at 35%. Photometry fits do slightly better on the older objects with errors of 23%, but these errors rise substantially for the young objects to 1115%. The largest fractional age offsets occur in the clusters less than 1 Gyr old for the full spectrum (3450%), continuum (4432%), and photometry fits. This is likely due to AGB stars. Furthermore, the full spectrum and continuum fits have larger age offsets in the older clusters (425% and 480%) than do the CN spectrum or photometry fits, which may be due to flux calibration issues, since both of these methods include the observed spectral continuum shape. To take care of both data and model continua issues, it appears that continuum-normalized spectral fits are the most robust in producing accurate age estimates for the clusters of all ages.
The age errors do not correlate with metallicity, so they seem to be dominated by the age regime of the cluster. Although photometry does a decent job on older objects, it should be noted that after excluding the BC96 photometry literature points, we only have 4 clusters in the 1 Gyr bin at ages of 1.2, 2.2, 12.4, and 13.1 Gyrs. It could just be that the two younger ones have no problems with boosted near infrared emission. In general, since there is not a good way to determine whether the 1-2 Gyr old objects are affected by the AGB star problem, using the CN spectrum fits would avoid this issue. Some combination of CN spectrum and photometry fits will likely provide the most robust answer. This will be explored further in future work.
Other studies have compared results from their cluster age estimation techniques to the literature. Rafelski & Zaritsky (2004) use colors formed from UBVI photometry along with Starburst99 (Leitherer et al., 1999) and GALEV (Anders & Fritze-v. Alvensleben, 2003) models to derive ages and compare to those in the literature from integrated colors (van den Bergh, 1981; Hunter et al., 2003) and isochrone fitting (Pietrzyński & Udalski, 1999; de Oliveira et al., 2000; Mighell et al., 1998; Rich et al., 2000) in Figure 8 of their paper. They find an age correlation with dispersion of 0.76 Gyr, which drops to 0.49 Gyr when considering only the more secure literature ages derived from CMDs. Over a similar age range our CN spectrum fits provide ages with an overall dispersion of 1.0 Gyr about literature comparison values, with 0.12 Gyr for UBV colors and 1.06 Gyr for CMD fits. Our photometry fits have dispersions of 1.04 Gyr for UBV colors and 0.85 Gyr for CMD fits. Although Rafelski & Zaritsky (2004) use clusters in the SMC, only two overlap with our sample. Our literature ages come from different sources as well, so we cannot make a direct comparison to this work.
To summarize our results for globular cluster age estimation, the CN spectrum model fits best match the entire range of age estimates from the literature (Figure 5 and Table Ages and Metallicities of Extragalactic Globular Clusters from Spectral and Photometric Fits of Stellar Population Synthesis Models), with average errors of 0.16 dex (35%) for older clusters and 0.3 dex (63%) for younger clusters. The full spectrum, continuum, and photometry fits overestimate the ages of many clusters below 1 Gyr, apparently suffering from an excess of AGB stars making the cluster spectra redder than the models and forcing older aged models to provide the best fits. Although photmetric fits seem to do better for clusters older than 1 Gyr (0.1 dex or 23% error), we will show in §6.3 that CN spectrum fits are superior for simultaneously providing both age and metallicity for these older objects. Furthermore, the uncertainty of whether the clusters will have boosted near infrared emission due to AGB stars makes using the photometry alone a less reliable technique than using spectra. Comparing the fitting methods (Figure 4), we find a tighter correlation between ages derived from the full spectrum and continuum fits than from the CN and full spectrum fits, suggesting that the ages are more strongly driven by the continuum shape than by the spectral lines. Because the derived ages are so strongly influenced by the continua and we have seen signs of problems in the models matching the cluster continua, we conclude that the best method for deriving accurate ages for globular clusters of all ages, especially when simultaneously determining metallicity, is fitting models to their continuum-normalized spectra.
6.2.1 The Outliers
There are two extreme outliers in the CN spectrum age plot of Figure 5a. The spectra of these outlying objects are shown in Figure 7. The upper leftmost outlier in the CN spectrum age plot is NGC 2092 in the LMC (Figure 7a,b), with a literature age of 4-12 Myr (from MSTOs and UBV colors) and for which we derive an age of 10 Gyr from both the CN and full spectrum fits. Its spectral coverage is only over the optical range of 3500-5870 Å. The shape of its spectrum is fairly flat with emission lines and few absorption features. The emission lines include [OII]3727, [OIII]4959,5007, and [NeIII]3869 nebular emission. The emission lines are masked out in our fits, which leaves very few distinguishing features. The cluster’s UBV photometry is also essentially flat. Our best fit metallicity of this object is bottomed out at the minimum in the model grid, [Fe/H]=2.2, for both the CN and full spectrum fits, likely because nothing would fit well and the lowest metallicity model that has very few metal lines in the red produced the lowest, although high, . Santos et al. (1995) list this object as a cluster embedded in a star forming complex with a flat continuum probably caused by red supergiants, which are stocastic in nature even for large star clusters. This appears to be a case that cannot be fit well with either spectral or photometric techniques using the BC03 SSP models.
The other outlier in the upper lefthand corner of the CN spectrum age plot in Figure 5a is NGC 2096 in the LMC. This object has a literature age of 49 Myr from its U-B color. Its spectrum (Figure 7c,d) contains a moderate sized 4000Å break of Dn(4000)=1.28, which is consistent with an age of at least 1 Gyr from index plots in Bruzual & Charlot (2003), and shows no evidence of the characteristic spectral shape of a young object with a strong Balmer discontinuity that would be expected for an age of only 49 Myr. For this object, our age is 1.2 Gyr (full spectrum and photometry fits) to 6 Gyr (CN spectrum fit). However, Santos et al. (1995) note this object as one where a few luminous intermediate temperature supergiants dominate the cluster’s integrated spectrum and claim that its age is even younger at 6-12 Myr. This may be a stocastic case where the supergiant dominated spectrum is not properly matched by the models.
Two out of 101 globular clusters in this sample could not be properly fit by the BC03 models. Both are very young clusters that show evidence of supergiant dominance in their integrated spectra. The stocastic nature of these stars make it difficult for us to derive accurate ages for clusters younger than a few tens of Myrs.
6.3 Metallicites
We compare our derived cluster metallicites to the literature values in Figure 8. There are fewer points on these plots than for the ages in Figure 5 because fewer of the clusters had metallicity estimates in the literature. The magnitudes of the metallicity errors relative to literature values are a stronger function of cluster age than [Fe/H]. This is illustrated in Figure 9 where the [Fe/H] errors are plotted against average literature ages. Table Ages and Metallicities of Extragalactic Globular Clusters from Spectral and Photometric Fits of Stellar Population Synthesis Models gives the average [Fe/H] offsets and dispersions for different groups of clusters.
Metallicity is harder to constrain than age. This was first seen in Figure 1 when the contours grew primarily in the metallicity dimension as noise was added to the cluster spectrum. Nevertheless, our CN spectrum fits do well on metallicity estimates for the older clusters. In Figure 8 we see a tight correlation of metallicity from these fits with the literature for clusters older than 1 Gyr. The large symbols mark literature estimates that are based on spectra. There is an overall [Fe/H] scale offset between M31 (blue pluses) and the MC (red circles, black crosses, black inverted triangles). If this offset of 0.45 dex is removed from the MC cluster literature metallicities, our metallicites agree to 0.12 dex with those from the Huchra et al. (1991) line indices (blue pluses), literature values on a homogeneous scale from Santos & Piatti (2004) (black inverted triangles), and Leonardi & Rose (2003) line index ratios (red circles) and their comparison literature values (black crosses).
The small symbols have literature metallicity estimates that are based on colors. There is more scatter in these values. The weaker correlation with VJK colors (green triangles) can be seen, as well as its break down at low metallicities of [Fe/H] 0.7. The Jiang et al. (2003) metallicities (magenta squares) are for older clusters in M31 and were derived from photometric fits to BC96 models using only three metallicities, [Fe/H] = 0.0, 0.7, 1.7. Their discrete metallicity steps and any differences between the 1996 and 2003 models are the reasons for the large dispersion of these points.
For the clusters younger than 1 Gyr, our metallicites from CN spectrum fits show no correlation with literature metallicity values. We believe this is because continuum information is also necessary for determining metallicities of young clusters, particularly since younger clusters likely have higher metallicity with more line blanketing. A hint that the continuum information might be helping to determine the metallicity of some young clusters can be seen in the plots of our full spectrum fits in Figs. 8 and 9. In Figure 8c, if we ignore the points below the 1:1 correlation line for the moment, there does seem to be a metallicity trend with the literature for many of the other points. All of the clusters that we ignored below the line show possible signs of a near infrared excess in their photometry over the model that best fits their optical spectra. Some of these spectra are shown in Figure 3. These clusters are in the correct age range, 0.1-2 Gyr, to be affected by TP-AGB stars. It is not clear why our derived metallicities of these objects appear too low, since it seems that redder spectra would be better fit by models with higher metallicities, but maybe it is more an indication that these results cannot be trusted. Fits to the continua shape alone (Figure 8e) result in much less correlation to the literature, however, 5 of the 6 outliers below the 1:1 correlation line in this case are common to those in the full spectrum plot. Therefore, although it seems that correct continuum information might allow metallicity estimates to be made for young objects, the uncertainty in proper modeling of the continua shapes makes the full spectrum fits unreliable.
We expect our metallicity estimates that are based on broadband photometry to be less well constrained than those based on spectra. Three of our comparison literature sources make cluster metallicity estimates based on photometry (denoted in our plots by smaller sized symbols): the Cohen & Matthews (1994) VJK colors, the Jiang et al. (2003) BC96 colors, and two of the Santos & Piatti (2004) homogenized literature values. Our photometrically derived metallicities (Figure 8d) do not correlate with these literature values, except for possibly a very weak relation with the VJK colors (green triangles). As expected, our metallicities derived from broadband photometry and the continuum shape show no correlation to any values from the literature that are based on spectral lines.
Santos & Piatti (2004) use empirical relationships between the sums of EWs of Balmer and metal lines to the literature age and metallicity values to estimate ages and metallicities of clusters in the Magellanic Clouds and in the Galaxy. They find that EW(H+H+H) and EW(CaK+Gband+Mg) are both sensitive to age for clusters younger than 10 Gyr, while EW(CaK+Gband+Mg) is sensitive to [Fe/H] only for clusters older than 10 Gyr. Neither of these EW sums correlate with the ages of old clusters (t 10 Gyr) or with the metallicities of young (t 10 Gyr) clusters. Our CN spectrum fits are similar to this technique in that they use line strengths, but over the entire spectral range of the data. Our fits produce metallicities that agree with literature values only for the older clusters, supporting the Santos & Piatti (2004) result, but extending the minimum age from 10 Gyr down to 1 Gyr for valid metallicity estimates.
To summarize our results for metallicity estimates, we agree very well with the literature metallicities that are based on spectra for clusters older than 1 Gyr. Those based on colors have much more scatter, which suggests that our CN spectrum fits are more robust in estimating [Fe/H] than methods using colors. For clusters younger than 1 Gyr, metallicity is hard to constrain. Our full spectrum fits hint that correct continua shapes would aid in metallicity estimates of younger clusters, but given the uncertainties in modeling this shape, we cannot accurately derive metallicity estimates for clusters younger than 1 Gyr.
6.4 Using Model Line Indices
We compare line indices measured on the BC03 model spectra to those measured on the globular cluster spectra in Figure 10 for H-[MgFe]′ and Fe-Mgb. Panels a-d show model grids calculated at the spectral resolutions of the data, 6 Å, 12 Å, 16 Å, and 23 Å respectively. Symbols mark the indices that could be measured for the clusters in each resolution group (indices that came out negative due to noise or emission lines were ignored). The 6 and 23 Å resolution groups (squares and crosses) are older clusters in M31, while the rest are younger clusters in the Magellanic Clouds. The H-[MgFe]′ index grids clearly show that the model indices become degenerate at 100 Myr for 1.0 [Fe/H] +0.5, and at 1 Gyr for [Fe/H] 2.0. Most of the young MC clusters fall in the degenerate regions of the grids. This degeneracy also occurs for the traditional Lick indices (tabulated with the BC03 model package) in this region of parameter space, as shown by the grids in Figure 10e. This plot only includes points from clusters that have spectra with resolutions near that of Lick indices (11 and 12 Å).
Bruzual & Charlot (2003) investigated how well line indices calculated directly from a library of their models containing complex stellar populations with a range of star formation histories could match galaxy spectra from the Sloan Digital Sky Survey (SDSS). They concluded that those models could simultaneously fit observed strengths of H, H, H, [MgFe]′, [Mg1Fe], [Mg2Fe], and D(4000) in high quality galaxy spectra with S/N 30 per pixel. Their sample of moderately low redshift SDSS galaxies probes a different region of age-metallicity space than does our sample of globular clusters. Local galaxies are generally old with considerably higher metallicity than these clusters, a region of parameter space where the models do well. In contrast, the M31 globular clusters are old and metal poor and the MC globular clusters are young and metal poor. Bruzual & Charlot note that their SSP models using the STELIB/BaSeL 3.1 library do poorer on line strengths for [Fe/H] 0.7 and our index plots add model degeneracy for 100 Myr, both of which are parts of parameter space occupied by globular clusters in this sample.
Figure 10f shows Fe vs. Mg b with model grids included for the minimum and maximum spectral resolutions. Some of the clusters depart from the model grid such that [Mg/Fe] may be enhanced (Maraston et al., 2003). Since we see signs of -enhancement and the BC03 models use scaled solar abundance ratios, the preferred metal index here is [MgFe]′, which was shown by Thomas et al. (2003) to be sensitive to metallicity while insensitive to -enhanced abundance ratios at the Lick/IDS spectral resolution. However, when [MgFe]′ is plotted against Balmer indices, which are affected by -enhancement because of metal lines in the index passbands, many of the clusters fall outside of the model grids with lower Balmer indices than the models (Figure 10a-d). One might suspect that the lower H indices are caused by the lines being partially filled in by emission, however, many of these clusters are old ones from M31 (squares and crosses) and unlikely to have emission. The younger MC clusters, on the other hand, could be affected by emission. Nevertheless, since our purpose in calculating line indices is for comparison of using the model indices to using the entire spectrum, and the affected MC clusters fall in the degenerate region of the model grid with unusable indices, we do not correct for emission.
Further possible causes of the H index discrepancy could be -enhancement or the presence of blue horizontal branch (BHB) stars in the clusters. The M31 clusters do show signs of -enhancement in Figure 10f. Line indices are changed by -enhancement, but in the wrong sense to explain the high H in the BC03 scaled solar abundance ratio model grids. H increases with [/Fe] (Tantalo & Chiosi, 2004a, b; Thomas et al., 2003), due to extra absorption in the blue pseudo-continuum and some in the central passband. Therefore, if the clusters are -enhanced their H indices should be higher than the model grid. The second possible culprit, BHB stars in old clusters with low metallicities, also affect H, but in the wrong sense. H should increase if a BHB exists in the cluster. We cannot explain the H behavior of the clusters relative to the models by either of these causes.
This same situation is seen by Le Borgne et al. (2004) in their Figs. 12 and 13 where they calculate Lick indices directly from the PEGASE-HR model spectra, which use the same stellar library as the BC03 models, and compare to globular clusters of intermediate to old ages in Andromeda, M31, M33, M81, and M87. They claim that this behavior of H is due to the clusters being extremely metal-poor, a regime where the interpolated stellar libraries suffer from large uncertainties due to lack of sufficient numbers of stars. This same regime of [Fe/H]0.7 was noted as a less reliable region by Bruzual & Charlot. The metallicites of our M31 clusters have literature values of 1.35[Fe/H]0.29, with an average of 0.73, so many do fall in the unreliable metallicity regime of the models. That, coupled with the index degeneracy below ages of 100 Myr, make indices calculated directly from the models unusable for most of the globular clusters in our sample.
Because calculating line indices from the models is troublesome for the age-metallicity parameter space occupied by many of the clusters in this sample, we take a different approach to investigating the importance of these spectral features. We fit model spectra to the clusters only over regions that include and exclude some of the typically used line indices and breaks. These features are (4000), H, G4300, H, H, Mg b, Fe5270, and Fe5335. The index definitions for the extents of the pseudocontinua passbands of lines, or for the flux ratio windows for breaks, define our wavelength ranges over which to fit the models to cluster spectra. Figure 11 shows the results of these fits, where a&b use only the regions including these features and c&d exclude these regions. It is clear that these features are very important for deriving cluster parameters from the models, but also that fitting the entire spectral range (refer to Figure 5 and 8) does a better overall job in estimating age and metallicity.
6.5 S/N and Spectral Resolution
Spectra of z1 galaxies from large surveys will most certainly have lower S/N than the spectra of the globular clusters used in the present study. We determine the lowest S/N value that can reliably be used to estimate ages by adding gaussian noise of different levels to cluster spectra via the noao.artdata.mknoise task in IRAF and fitting CN model spectra to them over the wavelength range of 3325-9000 Å. We first use actual cluster spectra to make the test realistic and avoid any biases that might be introduced by model spectra. The clusters in this test were chosen for their high S/N spectra and availability of both age and metallicity estimates in the literature. Further tests including effects of spectral resolution were then conducted on smoothed model spectra with added noise.
The resulting ages and metallicities as a function of S/N Å-1 for each of four clusters, G158, NGC 419, NGC 2134, and NGC 1818, are shown by different symbols in Figure 12. The average spectral resolutions of these data are 23Å, 13Å, 13Å, and 13Å, respectively. The derived ages of the clusters hover around the same values as S/N decreases until 5 Å-1, below which the derived ages become unstable. The horizontal line associated with each set of symbols is the average of the derived ages or metallicites for that cluster from its S/N5 spectra. For comparison, the spread of literature ages and metallicities for each cluster are shown as vertical lines of the same styles on the right-hand side of the plots. Our derived parameters for these four clusters fall within the literature age ranges. If the 0.45 dex [Fe/H] scale offset is subtracted from the MC cluster literature values, then our average [Fe/H] lines fall within the literature values for NGC 419 and G158, which are the clusters older than 1 Gyr. We do not match the literature [Fe/H] of the younger clusters. We find that the spectra need to have S/N 5 Å-1 to achieve stable age estimates from CN spectral fits. Examples of fits to NGC 419 with added noise and S/N = 99, 22, and 12 RE-1 (27, 6, 3 Å-1) are shown in Figure 13. Note that the last one is below the limiting S/N value.
We have also begun a study of the effects of spectral resolution on derived ages and metallicities. To accomplish this we smooth model spectra to = 5, 10, 15, 20, 25, and 30 Å, add noise in 10 realizations at each S/N level up to 60 Å-1 for a total of 300-500 simulations at each , and fit CN model spectra to them. The lowest resolution of =30 Å was chosen to match the lowest typically achieved in galaxy surveys. We select two input models that are consistent with age and metallicity combinations occupied by some of the globular clusters in this sample and that may also be useful for high redshift galaxies. These combinations are: 1 Gyr, [Fe/H]=0.0; and 10 Gyr, [Fe/H]=0.0 (similar to G158 in Figure 12 at 18 Gyr, [Fe/H]0.1, =23 Å).
The results of these fits are presented in Figures 14-16. Plots in Figure 14 show the best fit ages (top rows) and metallicities (bottom rows) as a function of S/N Å-1 for spectral resolutions of = 5, 15, 25 Å (to conserve space = 10, 20, and 30 Å are not shown) for the 1and 10 Gyr, [Fe/H] = 0 inputs. Input parameters are marked by solid lines, dashed lines represent uncertainties of 10% in age and 0.1 dex in [Fe/H], and dotted lines mark age uncertainties of 20%. Small filled circles show individual simulations, open circles are the average derived parameters in S/N bins of width 2, and vertical cyan bars mark the 1 variation within each bin.
Age-metallicity degeneracy in the derived parameters can clearly be seen in Figure 15 for the two input models at the same spectral resolutions presented in Figure 14. The increased difficulty of distinguishing older ages is also apparent from the much larger spread in derived ages for this regime where age changes result in small spectral differences. As spectral resolution degrades, derived ages and metallicities for the lower S/N spectra tend to be driven to the model grid limits more frequently.
We choose limiting S/N values for each spectral resolution corresponding to the point at which the standard deviation in derived ages for a S/N bin begins to increase beyond 10 or 20% of the input model age. Figure 16 summarizes the required S/N Å-1 as a function of for the 1 Gyr case on the left and the 10 Gyr case on the right. Solid lines denote derived ages within 10% and dashed lines within 20% of the input. Recall that the S/N is calculated for these spectra by taking the standard deviation of the flux in wavelength bins along the spectrum, which has the disadvantage that spectral features increase the apparent “noise” in the spectrum. Because of this fact, there is a limit to the maximum S/N calculated in this manner. These artificial limits are plotted as dotted lines in Figure 16, and therefore the open upward facing triangles are lower limits to the required S/N at those resolutions. The 10 Gyr object requires higher S/N than the 1 Gyr object at almost all resolutions, implying a strong dependence on the object’s age. However, because the age is unknown a priori, the 10 Gyr model must be used to determine the minimum required S/N.
The expected trend is seen for ages within 10% of the input: higher S/N is required for lower spectral resolution. At the 20% level, however, somewhat puzzling behavior is seen for the 10 Gyr old object. At 15 Å the required S/N actually decreases. This does not appear to be an aritfact of the simulations, as we see no correlations between the number of points within S/N bins and the standard deviation in derived ages. Interestingly, the globular cluster G158 at = 23 Å in Figure 12 may demonstrate similar behavior. Although only one noise realization was performed at each S/N level there, its correct age is obtained at much lower S/N than the younger clusters in the plot. Perhaps this trend is real. One could envision a scenario in which with decreasing resolution model mismatches of narrow lines in the spectrum become less important than broad features typical of old spectra, such as the 4000 Å break and the Mg absorption trough. In order to get the correct age, high S/N is required, but once the allowed uncertainty is increased, the broader features can provide enough information in lower S/N spectra. Clearly, this is only an initial guide for required S/N and more investigation needs to be done into the cause of this unexpected feature. At the high resolution end, our results are consistent with those of Mathis et al. (2006) who also fit continuum-removed spectra (via a data compression algorithm) and find required S/N11-17 Å-1 (20-30 per 3 Å pixel) at a spectral resolution of 3 Å. Extrapolating our 5 Å point down to 3 Å would give S/N7-22 Å-1.
In general, at the spectral resolutions of the globular clusters in Figure 12, 13-23 Å, our simulations indicate that a S/N 25 Å-1 is required for a 20% age uncertainty and 45 Å-1 for a 10% uncertainty. This is higher than the S/N5 Å-1 obtained from adding noise to actual cluster spectra. This discrepancy is not currently understood and will be investigated further in future work.
7 Discussion
7.1 Different Spectral Regions
In §6.4 we looked at the results of fits to specific regions of the spectrum around typically used line indices. Here we test the broader effects of the regions blueward and redward of the 4000 Å break on derived ages and metallicities. This will be important for fitting galaxies at varying redshifts, since at z1 optical spectra typically reach just beyond the 4000 Å break in the galaxy’s rest frame. For the clusters in our sample that include near ultraviolet spectra, we analyze the range of 3200-5650 Å, which is the maximum extent common to all clusters in this group. Within this range, we fit models to the blue ( 4000 Å), the red ( 4000 Å), and the region right around the break (3750-4250 Å, as defined in the empirical calibration of the break by Gorgas et al. (1999)). The clusters in this study are listed in Table 5 with their ages derived from different parts of the spectrum. Correlations of ages from the different spectral regions are plotted in Figure 17.
Fits to different regions give different results. For CN spectrum fits, the red part of the spectrum drives the result. The red ages correlate with the ages from the entire spectrum and are slightly older than the values in the literature. The blue region gives younger ages than both the red region and the literature. Ages from the break region correlate to the red ages with about the same amount of scatter as we saw in the red-entire spectrum correlation. Since the continuum is normalized out for these fits, the break region is left with only the signatures of strong features like the Ca H and K lines and H, similar to the Dn(4000)-H analysis done by Kauffmann et al. (2003a) on SDSS galaxies. The rough agreement of ages from this region with those from the entire spectrum emphasizes the importance for the 4000 Å break to be in the spectrum used for estimating the age of an object. The only correlation between [Fe/H] is a weak one between the entire spectrum and the red spectrum (not shown in Figure 17), not surprising since most metallicity sensitive lines typically used are in the red part of the spectrum.
For full spectrum fits, the trends change and the blue region carries more weight, demonstrating the importance of information in the continuum shape of the blue part of the spectrum. This is especially true for young objects with strong Balmer discontinuities. Ages from the blue and red regions agree, but with some scatter. However, now the entire spectrum agrees equally well with the blue and the red regions. The 4000 Å break ages agree much better with the blue than with the red ages. The red, blue, and break ages all correlate with the literature ages, but the correlation is tightest for the break region, even more so than for the full spectrum fits over the entire range. There is no correlation between our [Fe/H] derived from the different regions, but the red [Fe/H] has a weak correlation with the literature.
Because of the importance of the continuum information blueward of the 4000 Å break, we also test hybrid fits that use the full spectrum over 4250 Å and the CN spectrum over 3750 Å. Wavelengths below 4000 Å will not be affected by the TP-AGB and carbon stars that dominate the near infrared, so as long as there are no continuum problems with the data this type of fit should be valid. We expected this approach to do better on very young objects. However, the hybrid fits match the full spectrum fits that used the entire wavelength range. The continuum shape dominates the fits and spreads out the age correlation with the literature for objects younger than 0.1 Gyr. This is the same problem seen earlier with the continua of very young clusters being redder than the models, causing older best-fitting ages.
In summary, the continuum shape contains a lot of age information. In the blue part of the spectrum the continuum is more important than the lines for deriving age, while in the red part of the spectrum the lines alone are sufficient to derive the age. The most robust age estimates are obtained by using the entire CN spectrum of an object ( 3200-8200 Å), but the 4000 Å break is an essential feature to be contained within that spectrum. When using CN spectra to avoid problems in model and data continua, ages from only the blue region are younger than those obtained by the red region or the entire range. Age biases introduced by using different regions of the spectrum must be considered when combining objects that have different spectral coverage or different redshifts that change the rest frame wavelength coverage significantly. Additionally, for objects that cannot be considered a single stellar population, the ages determined from different spectral ranges may not be straighforward to interpret. Nonetheless, near infrared spectra of high redshift galaxies will be important to provide rest frame wavelengths around and redward of the 4000 Å break, particularly when fitting their CN spectra.
7.2 TP-AGB and Carbon Stars
The effects of TP-AGB stars on the near infrared luminosity of objects in which they reside have long been known and discussed by groups creating stellar population synthesis models (Renzini, 1992; Bruzual & Charlot, 1993; Girardi et al., 1998; Maraston, 1998). Recent models by Maraston (2005) incorporate TP-AGB stars through an empirical spectral library of C- and O-type stars by Lançon & Mouhcine (2002). The effects of these stars have been reanalyzed and calibrated on MC cluster colors in the new models. They show that over 80% of the K band light can be contributed by AGB stars between the ages of 0.1 and 2 Gyr for solar and lower metallicities. This effect is down to 20% in the V band.
Maraston fits photometric SEDs of these models to MC cluster SEDs. Two objects in common with our sample, NGC 1783 and NGC 419, show discrepancies between the Maraston models that best fit the photometric SEDs and BC03 models that best fit the spectra. These inconsistencies are the very point being address by the new models, which show that younger ages may be obtained for objects that have a near infrared excess due to TP-AGB stars if these stars are properly included. However, analysis of the spectra may reveal a different story. The CN spectra of the two clusters (shown in Figure 18b) are very similar to each other. NGC 1783 has Dn(4000)=1.295 and NGC 419 has Dn(4000)=1.246. We derive similar ages for the two clusters by fitting their CN spectra: 1.5 Gyr and [Fe/H]=0.8 for NGC 1783, and 1.5 Gyr and [Fe/H]=1.2 for NGC 419. The Maraston results for NGC 1783 are 0.3 Gyr and [Fe/H]=0.33, and for NGC 419 are 1 Gyr and [Fe/H]=1.35. BC03 models are overplotted on the CN spectra in Figure 18c,d for all the best-fitting models. The older age of 1.5 Gyr is a better fit to the CN spectra of both clusters.
Our photometric fit age for NGC 1783 is 2.0 Gyr and [Fe/H]=0.6, and for NGC 419 is 20 Gyr and [Fe/H]=1.4. This much older photometric age for NGC 419 could be due to the presence of TP-AGB stars making the continuum redder. The near infrared photometry of NGC 419 (see Figure 3) does show an excess over best-fitting models to the spectra. It is likely that the BC03 models do not include the enough TP-AGB stars in this case. On the other hand, the presence of AGB stars was detected in NGC 1783 by Frogel et al. (1990), but apparently their inclusion in the BC03 models is sufficient for this case. We conclude that the detailed information contained in spectra is necessary for breaking degeneracies that can occur when using only broadband photometry through the near infrared. In a more recent paper Maraston et al. (2006) apply the models with enhanced TP-AGB stars to high redshift galaxies and find that some degeneracies, particularly between TP-AGB stars and reddening due to dust, can be broken when mid-infrared photometry is added from Spitzer. These new models look very promising for young objects if infrared data are available, however their spectral resolution is not high enough to fit to galaxy spectra.
7.3 Implications for Galaxies
The ages expected for early-type galaxies at z1 fall within the range spanned by the globular clusters in this sample. The youngest early-type galaxies at these redshifts will likely be field galaxies that were the products of mergers. If the bulk of stars in these galaxies were formed in mergers at redshifts of z1.5-2, which are the formation redshifts found for field ellipticals (Im et al., 2002; Gebhardt et al., 2003), they would be at least 1.5 Gyr old by z1 (for = 0.3, =0.7, =70 km s-1Mpc-1). Our CN spectrum fits estimate ages to within 0.16 dex (35%) of the literature values for globular clusters older than 1 Gyr in our sample.
The metallicities of z1 galaxies will likely be higher than many of the clusters in this sample, however, a few clusters spanned most of the range expected for galaxies. At redshifts of 0.3z1.0, galaxies in GOODS-N have metallicities from 0.3 to 2.5 times solar, or 0.5 [Fe/H] +0.4 (Kobulnicky & Kewley, 2004). We were able to determine the [Fe/H] of globular clusters older than 1 Gyr to within 0.12 dex over the range of 1.6 [Fe/H] +0.3. The only region we have not tested is the highest metallicities of [Fe/H] +0.3.
Spectra at a resolution of = 15 Å (R 400 at 6000 Å) must have S/N 30-45 Å-1 in order to derive ages with 20 or 10% uncertainties, respectively, for old galaxies and S/N 10-20 Å-1 for young galaxies. This is higher than typically achieved for many objects in modern galaxy surveys such as MUNICS, DEEP, and TKRS. Our initial checks on TKRS spectra from DEIMOS on Keck of GOODS-N galaxies at z0.8-1.0 with magnitudes of R=23-23.5 find S/N 5 Å-1 for individual objects. Therefore, most galaxies will require coaddition of a few similar objects to reach sufficient S/N.
For galaxies at z1 typical optical spectra covering 4000-9000 Å will provide rest frame wavelengths of 2000-4500 Å. Our tests have shown that when using CN spectra, data to longer wavelengths will provide more robust age constraints. This means that near infrared spectra of galaxies will be important data to obtain for accurate age estimates.
Many early-type galaxies appear to have -element abundance ratios enhanced above solar (Trager et al., 2000a, b; Thomas et al., 2003, 2005). This enhancement is a sign of short duration bursts of star formation that may well be typical for early-type galaxies formed during mergers, as we expect to find at z1. We see indications of -enhancement in some of the M31 globular clusters in this sample and we still derive ages within 35% of the literature values when fitting the entire CN spectra. This suggests that results from the entire continuum-normalized spectrum, effectively averaging over all the lines, may be less affected by -enhancement than detailed line index methods that rely on only a few affected lines in the spectrum. Cassisi et al. (2004) find that broadband colors in the blue are significantly affected by -enhancement, but removal of the continuum shape must mitigate these effects to some extent.
Model fitting techniques will have to be modified for galaxies. Simple stellar populations will no longer be sufficient descriptions of these complex systems. Fits will require models with complex star formation histories, multiple stellar populations, and dust. However, this work has verified that the reliable regions of model parameter space cover most of that expected to be occupied by galaxies. We have also proven techniques by which model fits to galaxy spectra can be expected to work.
8 Summary and Conclusions
We have investigated the utility of using the Bruzual & Charlot (2003) high resolution simple stellar population synthesis models for estimating the ages and metallicities of globular clusters. We chose clusters from M31 and the Magellanic Clouds that cover a wide range of age and metallicity values, 0.004tage(Gyr)20 and 1.6[Fe/H]+0.3, to explore model performance in different regions of parameter space. We tested various techniques of fitting the models to data using spectra with and without their continua and photometry. Results were compared to age and metallicity estimates in the literature from other methods to evaluate our fitting techniques.
The models are reliable in regions of parameter space where t0.1 Gyr and [Fe/H] 0.7. These regions are limited by the incompleteness of the stellar libraries used in the models. For objects between the ages of 0.1 and 2.5 Gyr, uncertainties in the amount of near infrared light coming from TP-AGB and carbon stars make it hard to match the continuum shape of individual globular clusters. Red supergiant stars affect clusters younger than 0.1 Gyr. Continuum-normalized spectra can be used to get around the TP-AGB star problem, as well as any flux calibration issues in the data, with the requirement that high spectral resolution models are used. The red supergiant star problem limits accurate age estimates to objects older than 0.1 Gyr.
Ages from our CN spectrum model fits best match the entire range of age estimates from the literature (Figure 5 and Table Ages and Metallicities of Extragalactic Globular Clusters from Spectral and Photometric Fits of Stellar Population Synthesis Models), with average differences of 0.16 dex (35%) for clusters older than 1 Gyr and 0.3 dex (63%) for younger clusters. The methods that depend on the continuum shape – the full spectrum, continuum, and photometry fits – overestimate the ages of many clusters below 1 Gyr. We believe this to be due to a near infrared excess from TP-AGB stars making the cluster spectra redder than the models and forcing older aged models to provide the best fits for cluster ages of 0.1-1 Gyr. Red supergiant stars similarly affect clusters younger than 0.1 Gyr. Although photometric fits seem to do well for clusters older than 1 Gyr (0.1 dex or 23% age error relative to the literature), the CN spectrum fits are better for simultaneously providing both age and metallicity for these older objects. Fits to photometry alone cannot reproduce the correct metallicities.
Comparing the fitting methods (Figure 4), we find a tighter correlation between ages derived from the full spectrum and continuum fits than from the full spectrum and CN spectrum fits for clusters younger than 1 Gyr, suggesting that these derived ages are more strongly driven by the continuum shape than by the spectral lines. Clusters older than 1 Gyr show a tighter correlation between ages derived from the CN spectrum and photometry fits. Because the derived ages of young clusters are so strongly influenced by the continua and we have seen signs of problems in the models matching the cluster continua, we conclude that the best method for deriving accurate ages for globular clusters, especially when simultaneously determining metallicity, is fitting models to their continuum-normalized spectra.
On metallicities of clusters older than 1 Gyr, we agree to 0.12 dex with the literature values that are based on spectra. Those based on colors have much more scatter, which suggests that CN spectrum fits are more robust in estimating [Fe/H] than methods using colors. We cannot accurately derive metallicity estimates for clusters younger than 1 Gyr.
Blueward of the 4000 Å break the continuum shape is more important than the lines for deriving age. Redward of the break the lines alone in a continuum-normalized spectrum are sufficient to derive the age. Many of the globular clusters tested here have spectra out to rest wavelengths of 1 m. If fitting models to continuum-normalized spectra of z1 galaxies, this means that near infrared spectra through K band will be important to provide similar spectral coverage and constraints on age and metallicity. The 4000 Å break is a very important feature to be contained in the spectrum. It will be contained in typical z1 spectra, but higher redshifts may require near infrared spectra to correctly constrain ages and metallicites. We should note, however, that although a strong age indicator for globular clusters and early type galaxies, the 4000 Å break can be significantly affected by dust in star forming galaxies. For example, MacArthur (2005) find dust imparted age errors as large as 9.5 Gyr for a 0.5 Gyr BC03 model SSP when ages are derived from the Dn(4000)-Fe4668 plane.
The spectral S/N required to derive ages by fitting the entire CN spectrum is similar to the 30-40 Å-1 typically required when using line indices on old objects. For a 10 Gyr old object at = 5-25 Å our required S/N is 15-30 Å-1 for a 20% age uncertainty and 30-55 Å-1 for a 10% uncertainty. A 1 Gyr year old object requires S/N 3-15 Å-1 for a 20% age uncertainty and 10-25 Å-1 for a 10% uncertainty. At = 30 Å both ages require S/N 60 Å. Fairly low resolution, R240-1200, spectra can be used, at the cost of increasing required S/N with decreasing resolution.
We have successfully tested most of the age-metallicity space expected to be occupied by galaxies at z1, except for the highest metallicities of [Fe/H]+0.3. Fitting the continuum-normalized spectra of these galaxies should work well for spectra without accurate flux calibration, typical when faint galaxies are observed on multiple masks over long periods of time during surveys. The required S/N and spectral resolution for determining ages and metallicities matches that typically achieved in recent galaxy surveys, as long as a few like objects are coadded to boost the S/N. The techniques presented here will be applied to galaxies in future work.
References
- Anders & Fritze-v. Alvensleben (2003) Anders, P., Fritze-v. Alvensleben, U., 2003, A&A, 401, 1063
- Balogh et al. (1999) Balogh, M., Morris, S., Yee, H., Carlberg, R., Ellingson, E., 1999, ApJ, 527, 54
- Barger et al. (2000) Barger, A.J., Cowie, L.L., Richards, E.A., 2000, A&A, 119, 2092
- Barmby et al. (2000) Barmby, P., Huchra, J., Brodie, J., Forbes, D., Schroder, L., Grillmair, C., 2000, AJ, 119, 727
- Battistini et al. (1987) Battistini, P., Bonoli, F., Braccesi, A., Federici, L., Fusi-Pecci, F., Marano, B., Borngen, F., 1987, A&AS, 67, 447
- Battistini et al. (1993) Battistini, P., Bonoli, F., Casavecchia, M., Ciotti, L., Federici, L., Fusi-Pecci, F., 1993, A&A, 272, 77
- Beasley et al. (2002) Beasley, M.A., Hoyle, F., Sharples, R.M., 2002, MNRAS, 336, 168
- Bell et al. (2003) Bell, E.F., McIntosh, D.H., Katz, N., Weinberg, M.D., 2003, ApJS, 149, 289
- Bell et al. (2004b) Bell, E.F., McIntosh, D.H., Barden, M., Wolf, C., Caldwell, J.A.R., Rix, H.W., Beckwith, S.V.W., Borch, A., Häussler, B., Jahnke, K., Jogee, S., Meisenheimer, K., Peng, C., Sanchez, S.F., Somerville, R.S., Wisotzki, L., 2004b, ApJ, 600, L11
- Bessell (1979) Bessell, M.S., 1979, PASP, 91, 589
- Bica et al. (1986a) Bica, E., Alloin, D., 1986a, A&A, 162, 21
- Bica et al. (1986b) Bica, E., Dottori, H., Pastoriza, M., 1986b, A&A, 156, 261
- Bica et al. (1987a) Bica, E., Alloin, D., 1987a, A&A, 186, 49
- Bica et al. (1987b) Bica, E., Alloin, D., 1987b, A&AS, 70, 281
- Bica et al. (1990) Bica, E., Santos, J.F.C., Alloin, D., 1990, A&A, 235, 103
- Bica et al. (1994) Bica, E., Alloin, D., Schmitt, H., 1994, A&A, 283, 805
- Bica et al. (1996) Bica, E., Claria, J., Dottori, H., Santos, J.F.C., Piatti, A., 1996, ApJS, 102, 57
- Blain et al. (2004) Blain, A.W., Chapman, S.C., Smail, I., Ivison, R., 2004, ApJ, 611, 725
- Brodie & Huchra (1990) Brodie, J., Huchra, J., 1990, ApJ, 362, 503
- Bruzual & Charlot (1993) Bruzual, G., Charlot, S., 1993, ApJ, 405, 538
- Bruzual & Charlot (2003) Bruzual, G., Charlot, S., 2003, MNRAS, 344, 1000
- Burstein et al. (1986) Burstein, D., Faber, S.M., González, J.J., 1986, AJ, 91, 1130
- Cassisi et al. (2004) Cassisi, S., Salaris, M., Castelli, F., Pietrinferni, A., 2004, ApJ, 616, 498
- Castellani et al. (1992) Castellani, V., Chieffi, A., Straniero, O., 1992, ApJS, 78, 517
- Cerviño et al. (2000) Cerviño, M., Luridiana, V., Castander, F.J., 2000, A&A, 360, L5
- Cerviño et al. (2001) Cerviño, M., Gómez-Flechoso, M.A., Castander, F.J., Schaerer, D., Molla, M., Knödlseder, J., Luridiana, V., 2001, A&A, 376, 422
- Cerviño et al. (2002) Cerviño, M., Valls-Gabaud, D., Luridiana, V., Mas-Hesse, J.M., 2002, A&A, 381, 51
- Cerviño et al. (2006) Cerviño, M., Luridiana, V., 2006, A&A, 451, 475
- Chabrier (2003) Chabrier, G., 2003, PASP, 115, 763
- Chapman et al. (2004) Chapman, S.C., Smail, I., Blain, A.W., Ivison, R.J., 2004, ApJ, 614, 671
- Cimatti et al. (2002) Cimatti, A., Daddi, E., Mignoli, M., Pozzetti, L., Renzini, A., Zamorani, G., Broadhurst, T., Fontana, A., Saracco, P., Poli, F., Cristiani, S., D’Odorico, S., Giallongo, E., Gilmozzi, R., Menci, N., 2002, A&A, 381, L68
- Cimatti et al. (2004) Cimatti, A., Daddi, E., Renzini, A., Cassata, P., Vanzella, E., Pozzetti, L., Cristiani, S., Fontana, A., Rodighiero, G., Mignoli, M., Zamorani, G., 2004, Nature, 430, 184
- Cohen (1982) Cohen, J.G., 1982, ApJ, 258, 143
- Cohen & Matthews (1994) Cohen, J., Matthews, K., 1994, AJ, 108, 128
- Da Costa & Hatzidimitriou (1998) Da Costa, G.S., Hatzidimitriou, D., 1998, AJ, 115, 1934
- Daddi et al. (2002) Daddi, E., Cimatti, A., Broadhurst, T., Renzini, A., Zamorani, G., Mignoli, M., Saracco, P., Fontana, A., Pozzetti, L., Poli, F., Cristiani, S., D’Odorico, S., Giallongo, E., Gilmozzi, R., Menci, N., 2002, A&A, 384, L1
- de Oliveira et al. (2000) de Oliveira, M.R., Dutra, C.M., Bica, E., Dottori, H., 2000, A&AS, 146, 57
- Dickinson et al. (2003) Dickinson, M., Papovich, C., Ferguson, H.C., Budavári, T., 2003, ApJ, 587, 25
- Dirsch et al. (2000) Dirsch, B., Richtler, T., Gieren, W.P., Hilker, M., 2000, A&A, 360, 133
- Drory et al. (2001) Drory, N., Feulner, G., Bender, R., Botzler, C. S., Hopp, U., Maraston, C., Mendes de Oliveira, C., Snigula, J. 2001, MNRAS, 325, 550
- Drory et al. (2004) Drory, N., Bender, R., Feulner, G., Hopp, U., Maraston, C., Snigula, J., Hill, G.J., 2004, ApJ, 608, 742
- Dunlop et al. (1996) Dunlop, J., Peacock, J., Spinrad, H., Dey, A., Jimenez, R., Stern, D., Windhorst, R., 1996, Nature, 381, 581
- Elson & Fall (1988) Elson, R.A.W., Fall, S.M., 1988, AJ, 96, 1383
- Faber et al. (1985) Faber, S.M., Friel, E.D., Burstein, D., Gaskell, C.M., 1985, ApJS, 57, 711
- Ferreras & Yi (2004) Ferreras, I., Yi, S.K., 2004, MNRAS, 350, 1322
- Frenk& Fall (1982) Frenk, C.S., Fall, S.M., 1982, MNRAS, 199, 565
- Frogel et al. (1990) Frogel, J.A., Mould, J., Blanco, V.M., 1990, ApJ, 352, 96
- Gebhardt et al. (2003) Gebhardt, K., Faber, S., Koo, D., Im, M., Simard, L., Illingworth, G., Phillips, A., Sarajedini, V., Vogt, N., Weiner, B., Willmer, C., 2003, ApJ, 597, 239
- Girardi et al. (1995) Girardi, L., Chiosi, C., Bertelli, G., Bressan, A., 1995, A&A, 298, 87
- Girardi et al. (1998) Girardi, L., Bertelli, G., 1998, MNRAS, 300, 533
- Gorgas et al. (1993) Gorgas, J., Faber, S.M., Burstein, D., González, J.J., Courteau,S., Prosser, C., 1993, ApJS, 86, 153
- Gorgas et al. (1999) Gorgas, J., Cardiel, N., Pedraz, S., González, J., 1999, A&AS, 139, 29
- Green et al. (1987) Green, E., Demarque, P., King, C., 1987, The Revised Yale Isochrones and Luminosity Functions (New Haven: Yale University Observatory)
- Groenewegen & de Jong (1993) Groenewegen, M.A.T., de Jong, T., 1993, A&A, 267, 410
- Groenewegen et al. (1995) Groenewegen, M.A.T., van den Hoek, L.B., de Jong, T., 1995, A&A, 293, 381
- Hill et al. (2000) Hill, V., François, P., Spite, M., Primas, F., Spite, F., 2000, A&A, 364, 19
- Hodge (1983) Hodge, P., 1983, ApJ, 264, 470
- Hogg et al. (2002) Hogg, D.W., Blanton, M., Strateva, I., Bahcall, N.A., Brinkmann, J., Csabai, I., Mamoru, D., Fukugita, M., Hennessy, G., Ivezic, Z., Knapp, G.R., Lamb, D.Q., Lupton, R., Munn, J.A., Nichol, R., Schlegel, D.J., Schneider, D.P., York, D.G., 2002, AJ, 124, 646
- Huchra et al. (1991) Huchra, J., Brodie, J. Kent, S., 1991, ApJ, 370, 495
- Hunter et al. (2003) Hunter, D.A., Elmegreen, B.G., Dupuy, T.J., Mortonson, M., 2003, AJ, 126, 1836
- Im et al. (2002) Im, M., Simard, L., Faber, S.M., Koo, D.C., Gebhardt, K., Willmer, C.N.A., Phillips, A., Illingworth, G., Vogt, N.P., Sarajedini, V.L., 2002, ApJ, 571, 136
- Jablonka et al. (1992) Jablonka, P., Alloin, D., Bica, E., 1992, A&A, 260, 97
- Jablonka et al. (1998) Jablonka, P., Bica, E., Bonatto, C., Bridges, T., Langlois, M., Carter, D., 1998, A&A, 335, 867
- Jasniewicz & Thévenin (1994) Jasniewica, G., Thévenin, F., 1994, A&A, 282, 717
- Jiang et al. (2003) Jiang, L., Ma, J., Zhou, X., Chen, J., Wu, H., Jiang, Z., 2003, AJ, 125, 727
- Johnson et al. (2001) Johnson, F.A., Beaulieu, S.F., Gilmore, G.F., et al., 2001, MNRAS, 324, 367
- Kauffmann et al. (2003a) Kauffmann, G., Heckman, T.M., White, S.D.M., Charlot, S., Tremonti, C., Brinchmann, J., Bruzual, G., Peng, E.W., Seibert, M., Bernardi, M., and 12 coauthors, 2003, MNRAS, 341, 33
- Kauffmann et al. (2003b) Kauffmann, G., Heckman, T.M., White, S.D.M., Charlot, S., Tremonti, C., Peng, E.W., Seibert, M., Brinkmann, J., Nichol, R.C., SubbaRao, M, York, D., 2003, MNRAS, 341, 54
- Kobulnicky & Kewley (2004) Kobulnicky, H.A., Kewley, L.J., 2004, ApJ, 617, 240
- Labbé et al. (2003) Labbé, I., Franx, M., Rudnick, G., et al., 2003, AJ, 125, 1107
- Lançon & Mouhcine (2002) Lançon, A., Mouhcine, 2002, A&A, 393, 167L
- Le Borgne et al. (2004) Le Borgne, D., Rocca-Volmerange, B., Prugniel, P., Lançon, A., Fioc, M., Soubiran, C., 2004, A&A, 425, 881
- Leitherer et al. (1999) Leitherer, C., Schaerer, D., Goldader, J.D., Delgado, R.M.G., Robert, C., Kune, D.F., de Mello, D.F., Devost, D., Heckman, T.M., 1999, ApJS, 123, 3
- Leonardi & Rose (2003) Leonardi, A., Rose, J., 2003, AJ, 126, 1811
- Lilly et al. (1996) Lilly, S.J., Le Fèvre, O., Hammer, F., Crampton, D., 1996, ApJ, 460, L1
- Liu et al. (2000) Liu, M.C., Charlot, S., Graham, J.R., 2000, ApJ, 543, 644
- MacArthur (2005) MacArthur, L.A., 2005, ApJ, 623, 795
- Madau et al. (1996) Madau, P., Ferguson, H.C., Dickinson, M., Giavalisco, M., Steidel, C.C., Fruchter, A., 1996, MNRAS, 283, 1388
- Madau et al. (1998) Madau, P., Pozzetti, L., Dickinson, M., 1998, ApJ, 498, 106
- Maraston (1998) Maraston, C., 1998, MNRAS, 300, 872
- Maraston (2005) Maraston, C., 2005, MNRAS, 362, 799
- Maraston et al. (2006) Maraston, C., Daddi, E., Renzini, A., Cimatti, A., Dickinson, M., Papovich, C., Pasquali, A., Pirzkal, N., 2006, submitted, aph/0604530
- Maraston et al. (2003) Maraston, C., Greggio, L., Renzini, A., Ortolani, S., Saglia, R.P., Puzia, T.H., Kissler-Patig, M., 2003, A&A, 400, 823
- Marigo et al. (1996) Marigo, P., Girardi, L., Chiosi, C., 1996, A&A, 136, L1
- Massey et al. (2005) Massey, P., Puls, J., Pauldrach, A.W.A., Bresolin, F., Kudritzki, R.P., Simon, T., 2005, ApJ, 627, 477
- Mathis et al. (2006) Mathis, H., Charlot, S., Brinchmann, J., 2006, ApJ, 365, 385
- McCarthy et al. (2004) McCarthy, P.J., Le Borgne, D., Crampton, D., Chen, H.W., Abraham, R.G., Glazebrook, K., Savaglio, S., Carlberg, R.G., Marzke, R.O., Roth, K., Jørgensen, I., Hook, I., Murowinski, R., Juneau, S., 2004, ApJ, 614, 9
- McQuade et al. (1995) McQuade, K., Calzetti, D., Kinney, A., 1995, ApJS, 97, 331
- Mighell et al. (1998) Mighell, K.J., Sarajedini, A., French, R.S., 1998, AJ, 116, 2395
- Neri et al. (2003) Neri, R., Genzel, R., Ivison, R.J., Bertoldi, F., Blain, A.W., Chapman, S.C., Cox, P., Grive, T.R., Omont, A., Frayer, D.T., 2003, ApJ, 597, 113
- Nolan et al. (2003) Nolan, L.A., Dunlop, J.S., Jimenez, R., Heavens, A.F., 2003, MNRAS, 341, 464
- Oliva & Origlia (1998) Oliva, E., Origlia, L., 1998, A&A, 332, 46
- Olszewski et al. (1991) Olszewski, E., Schommer, R., Suntzeff, N., Harris, H., 1991, AJ, 101, 515
- Papovich, Dickinson, & Ferguson (2001) Papovich, C., Dickinson, M., Ferguson, H.C., 2001, ApJ, 559, 620
- Peebles (1980) Peebles, P.J.E., 1980, The large-scale structure of the universe, Princeton, N.J., Princeton University Press
- Persson et al. (1983) Persson, E., Aaronson, M., Cohen, J., Frogel, J., Matthews, K., 1983, ApJ, 266, 105
- Piatti et al. (2002) Piatti, A.E., Sarajedini, A., Geisler, D., Bica, E., Claria, J.J., 2002, MNRAS, 329, 556
- Pietrzyński & Udalski (1999) Pietrzyński, G., Udalski, A., 1999, AcA, 49, 157
- Rafelski & Zaritsky (2004) Rafelski, M., Zaritsky, D., 2004, AJ, 129, 2701
- Renzini & Buzzoni (1986) Renzini, A., Buzzoni, A., 1986, in Spectral Evolution of Galaxies, (Dordrecht, D. Reidel Publishing), p. 195
- Renzini (1992) Renzini, A., 1992, in International Astronomical Union. Symposium no. 149, (Kluwer Academic Publishers, Dordrecht), p. 325
- Rich et al. (2000) Rich, R.M., Shara, M., Fall, S.M., Zurek, D., 2000, AJ, 119, 197
- Rudnick et al. (2003) Rudnick, G., Rix, H.W., Franx, M., Labbé, I., Blanton, M., Daddi, E., Förster Schreiber, N.M., Moorwood, A., Röttgering, H., Trujillo, I., van de Wel, A., van der Werf, P., van Dokkum, P.G., van Starkenburg, L., 2003, ApJ, 599, 847
- Sagar & Pandey (1989) Sagar, R., Pandey, A.K., 1989, A&AS, 79, 407
- Santos et al. (1995) Santos, J.F.C., Bica, E., Claria, J., Piatti, A., Girardi, H., Dottori, H., 1995, MNRAS, 276, 1155
- Santos et al. (2002) Santos, J.F.C., Alloin, D., Bica, E., Bonatto, C., 2002, in IAU Symposium 207, ed. by D. Geisler, E.K. Grebel, D. Minniti (San Francisco: ASP 2002) p. 727
- Santos & Piatti (2004) Santos, J.F.C., Piatti, A.E., 2004, A&A, 428, 79
- Saracco et al. (2003) Saracco, P., Longhetti, M., Severgnini, P., Della Ceca, R., Mannucci, F., Bender, R., Drory, N., Feulner, G., Ghinassi, F., Hopp, U., Maraston, C., 2003, A&A, 398, 127
- Schiavon et al. (2002) Schiavon, R.P., Faber, S.M., Rose, J.A., Castilho, B.V., 2002, ApJ, 580, 873
- Förster Schreiber et al. (2004) Förster Schreiber, N.M., van Dokkum, P.G., Franx, M., Labbe, I., Rudnick, G., Daddi, E., Illingworth, G.D., Kriek, M., Moorwood, A.F.M., Rix, H.-W., Rottgering, H., Trujillo, I., van der Werf, P., van Starkenburg, L., Wuyts, S., 2004, ApJ, 616, 40
- Searle, Wilkinson, & Bagnuolo (1980) Searle, L., Wilkinson, A., Bagnuolo, W.G., 1980, ApJ, 239, 803
- Seggewiss & Richtler (1989) Seggewiss, W., Richtler, T., 1989, in Recent Developments of Magellanic Cloud Research, ed., K.S. de Boer, F. Spite, G. Stasinska (Meudon: Obs. Paris), 45
- Somerville (2004) Somerville, R.S., 2004, “Proceedings of Multiwavelength Mapping of Galaxy Formation and Evolution,” eds. Bender, R., Renzini, A. (astro-ph/0401570)
- Spinrad et al. (1997) Spinrad, H., Dey, A., Stern, D., Dunlop, J., Peacock, J., Jimenez, R, Windhorst, R., 1997, ApJ, 484, 581
- Steidel et al. (1999) Steidel, C.C., Adelberger, K.L., Giavalisco, M., Dickinson, M., Pettini, M., 1999, ApJ, 519, 1
- Steidel et al. (2004) Steidel, C.C., Shapley, A.E., Pettini, M., Adelberger, K.L., Erb, D.K., Reddy, N.A., Hunt, M.P., 2004, ApJ, 604, 534
- Stockton et al. (1995) Stockton, A., Kellogg, M., Ridgway, S.E., 1995, ApJ, 443, L49
- Strateva et al. (2001) Strateva, I., Ivezić, Z., Knapp, G.R., Narayanan, V.K., Strauss, M.A., Gunn, J.E., Lupton, R.H., Schlegel, D., Bahcall, N.A., Brinkmann, J., Brunner, R.J., Budavári, T., Csabai, I., Castander, F.J., Doi, Mamoru, Fukugita, M., Győry, Z., Hamabe, M., Hennessy, G., Ichikawa, T., Kunszt, P.Z., Lamb, D.Q., McKay, T.A., Okamura, S., Racusin, J., Sekiguchi, M., Schneider, D.P., Shimasaku, K., York, D., 2001, AJ, 122, 1861
- Suntzeff et al. (1992) Suntzeff, N.B., Schommer, R.A., Olszewski, E.W., Walker, A.R., 1992, AJ, 104, 1743
- Tantalo & Chiosi (2004a) Tantalo, R., Chiosi, C., 2004a, MNRAS, 353, 405
- Tantalo & Chiosi (2004b) Tantalo, R., Chiosi, C., 2004b, MNRAS, 353, 917
- Thomas et al. (2003) Thomas, D., Maraston, C., Bender, R., 2003, MNRAS, 339, 897
- Thomas et al. (2005) Thomas, D., Maraston, C., Bender, R., Mendes de Oliveira, C., 2005, ApJ, 621, 673
- Thompson et al. (2001) Thompson, R.I., Weymann, R.J., Storrie-Lombardi, L.J., 2001, ApJ, 546, 694
- Trager et al. (1998) Trager, S., Worthey, G., Faber, S., Burstein, D., Gonzalez, J., 1998, ApJS, 116, 1
- Trager et al. (2000a) Trager, S.C., Faber, S.M., Worthey, G., González, J.J., 2000a, AJ, 119, 1645
- Trager et al. (2000b) Trager, S.C., Faber, S.M., Worthey, G., González, J.J., 2000b, AJ, 120, 165
- van den Bergh (1981) van den Bergh, S., 1981, A&AS, 46, 79
- van Dokkum et al. (1998) van Dokkum, P.G., Franx, M., Kelson, D.D., Illingworth, G.D., 1998, ApJ, 504, L17
- Vandenberg & Bell (1985) Vandenberg, D., Bell, R., 1985, ApJS, 58, 561
- Vassiliadis & Wood (1993) Vassiliadis, E., Wood, P.R., 1993, ApJ, 413, 641
- Vazdekis et al. (2001) Vazdekis, A., Salaris, M., Arimoto, N., Rose, J.A., 2001, ApJ, 549, 274
- Wamsteker (1981) Wamsteker, W., 1981, A&A, 97, 329
- White & Rees (1978) White, S.D.M., Rees, M.J., 1978, MNRAS, 183,341
- White & Frenk (1991) White, S.D.M., Frenk, C.S., 1991, ApJ, 379, 52
- Wolf et al. (2005) Wolf, C., Bell, E.F., McIntosh, D.H., Rix, H.W., Barden, M., Beckwith, S.V.W., Borch, A., Caldwell, J.A.R., Häussler, B., Heymans, C., Jahnke, K., Jogee, S., Meisenheimer, K., Peng, C.Y., Sánchez, S.F., Somerville, R.S., Wisotzki, L., 2005, ApJ, 630, 771
- Worthey et al. (1992) Worthey, G.J., Faber, S.M., Gonzáalez, J.J., 1992, ApJ, 398, 69
- Worthey et al. (1994) Worthey, G., Faber, S.M., Gonzáalez, J.J., Burstein, D., 1994, ApJS, 94, 687
- Worthey (1994) Worthey, G., 1994, ApJS, 95, 107
- Worthey & Ottaviani (1997) Worthey, G., Ottaviani, D., 1997, ApJS, 111, 377
- Yi et al. (2000) Yi, S., Brown, T.M., Heap, S., Hubeny, I., Landsman, W., Lanz, T., Sweigart, A., 2000, ApJ, 533, 670
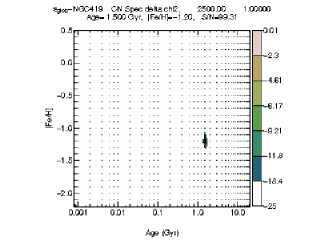
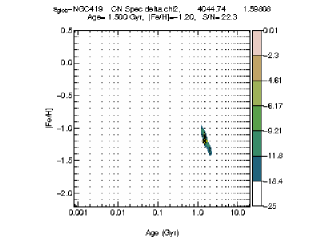
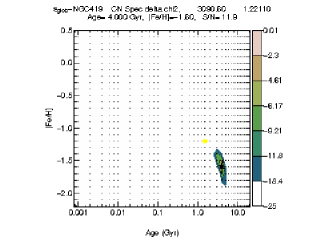
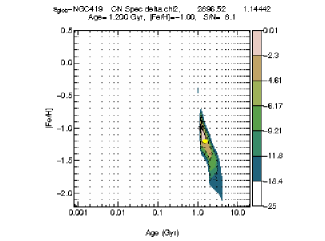
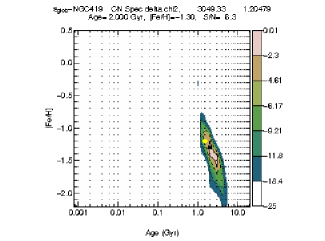
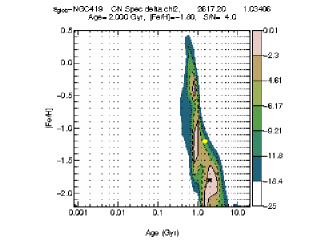
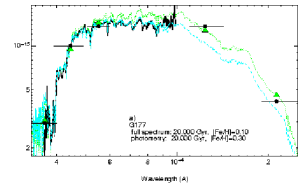
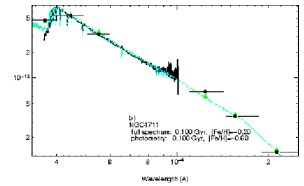
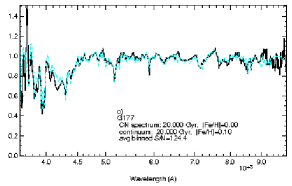
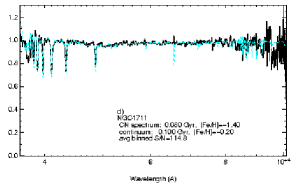
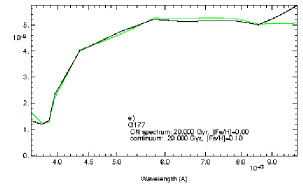
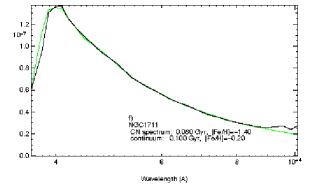
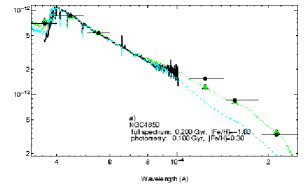
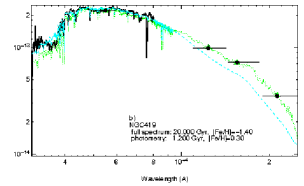
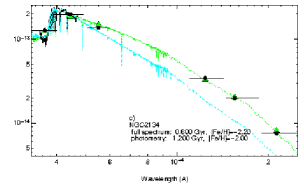
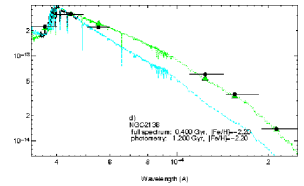
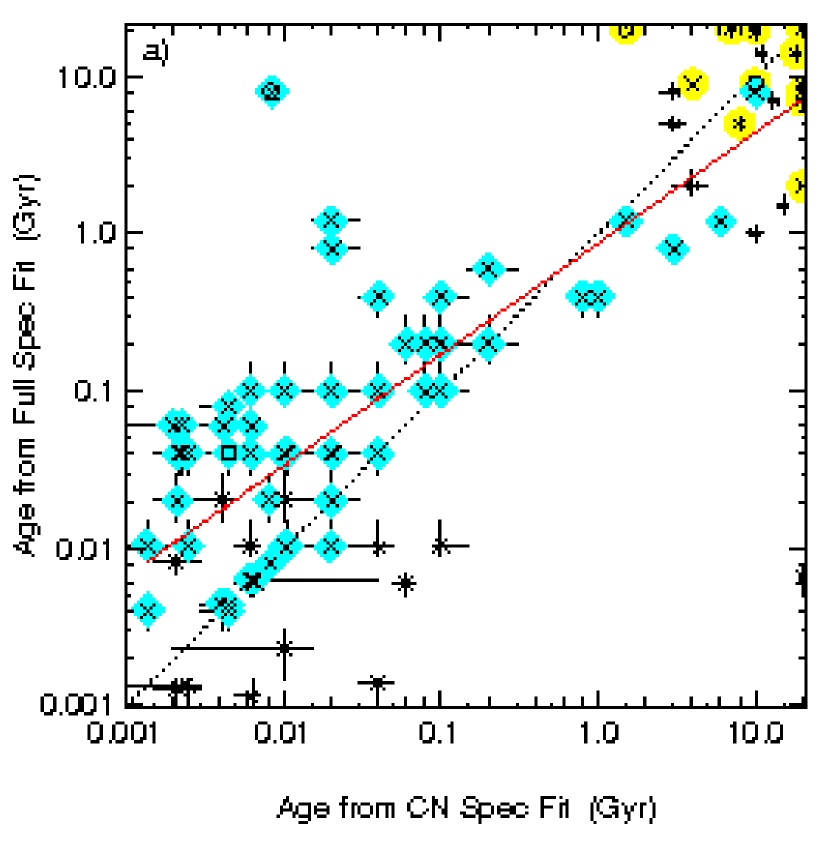
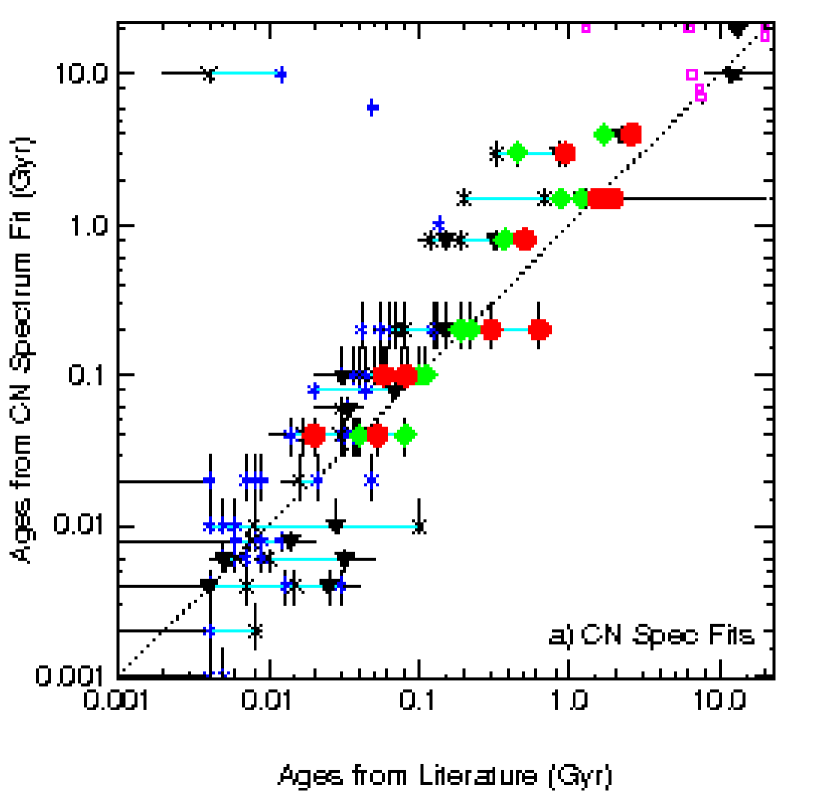
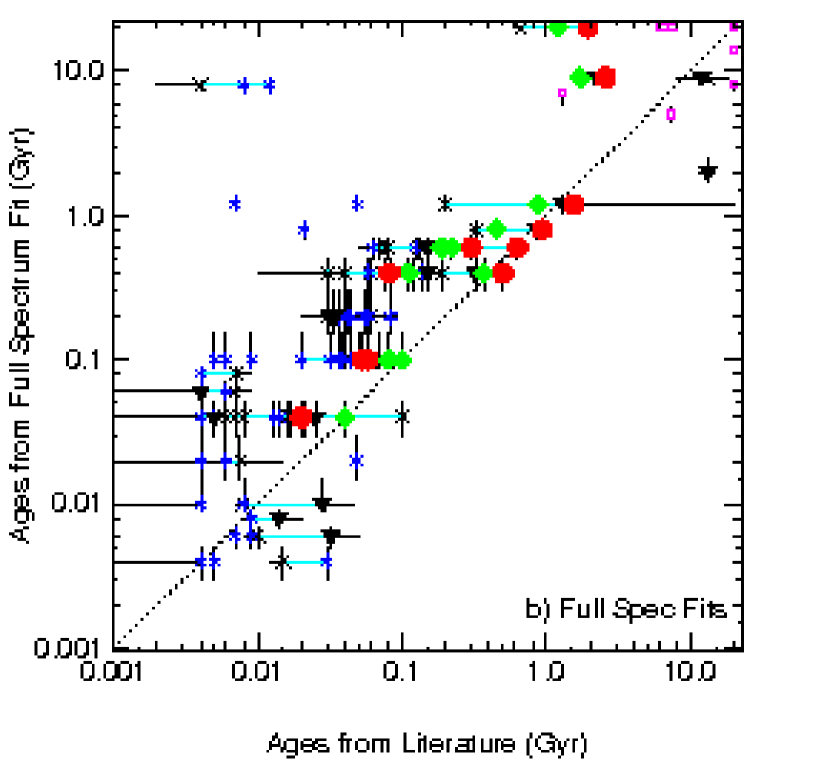
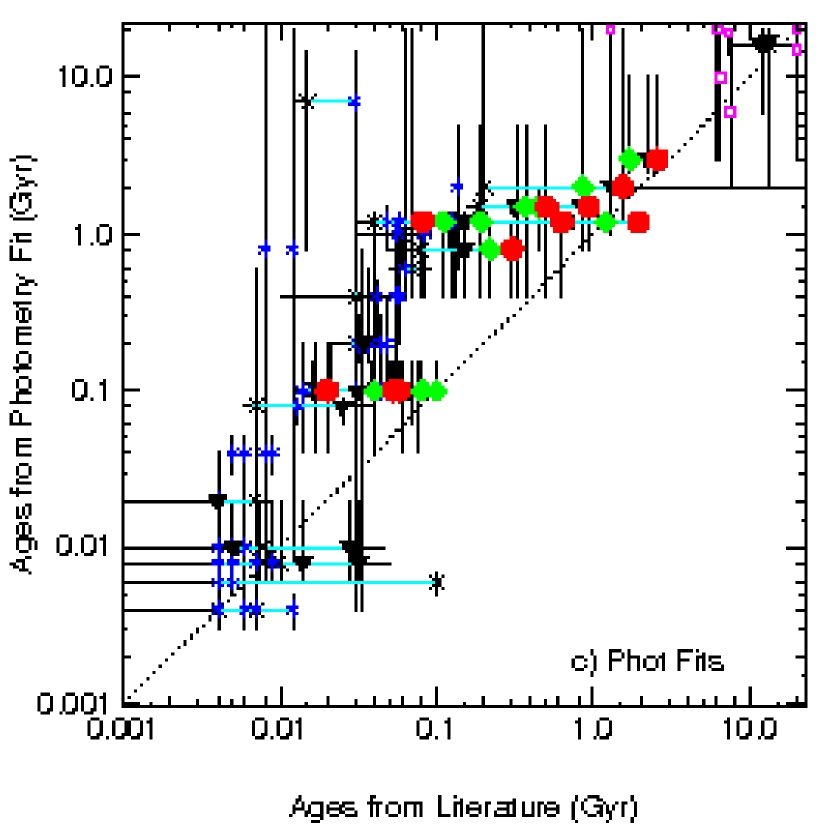
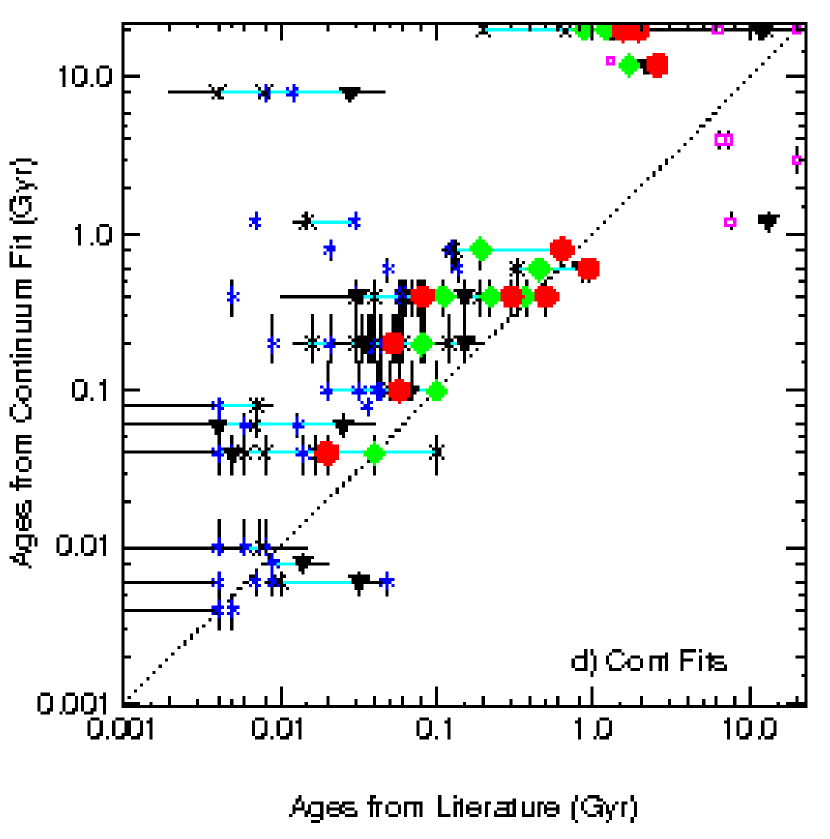
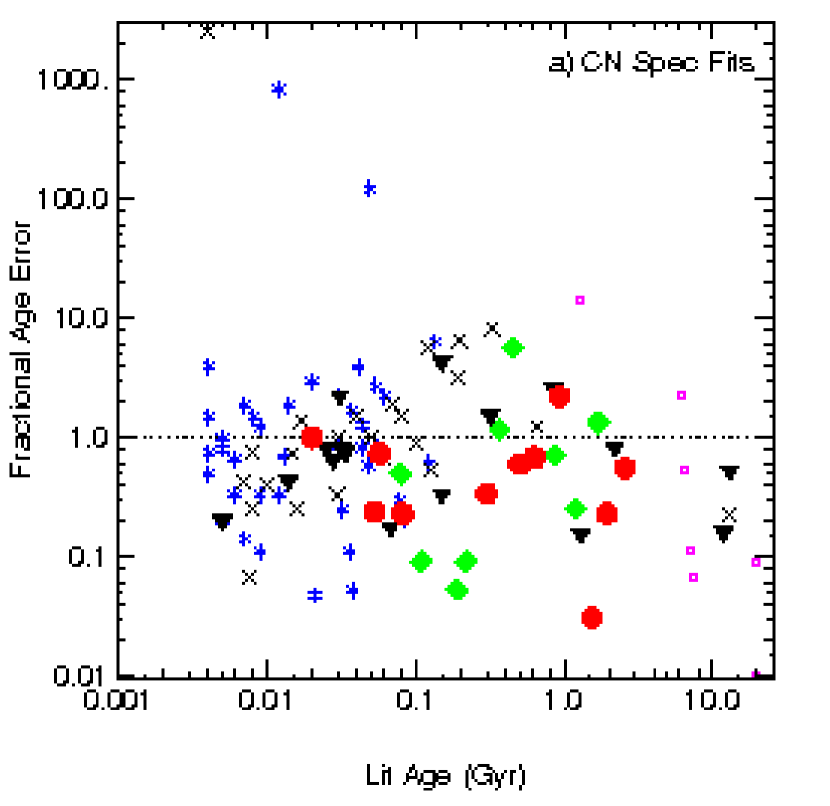
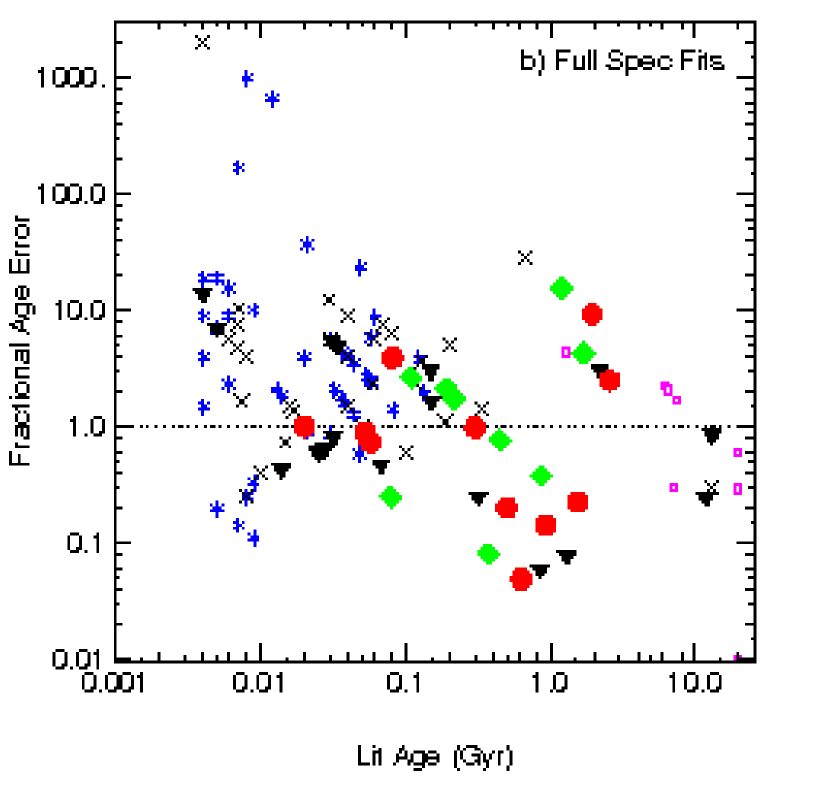
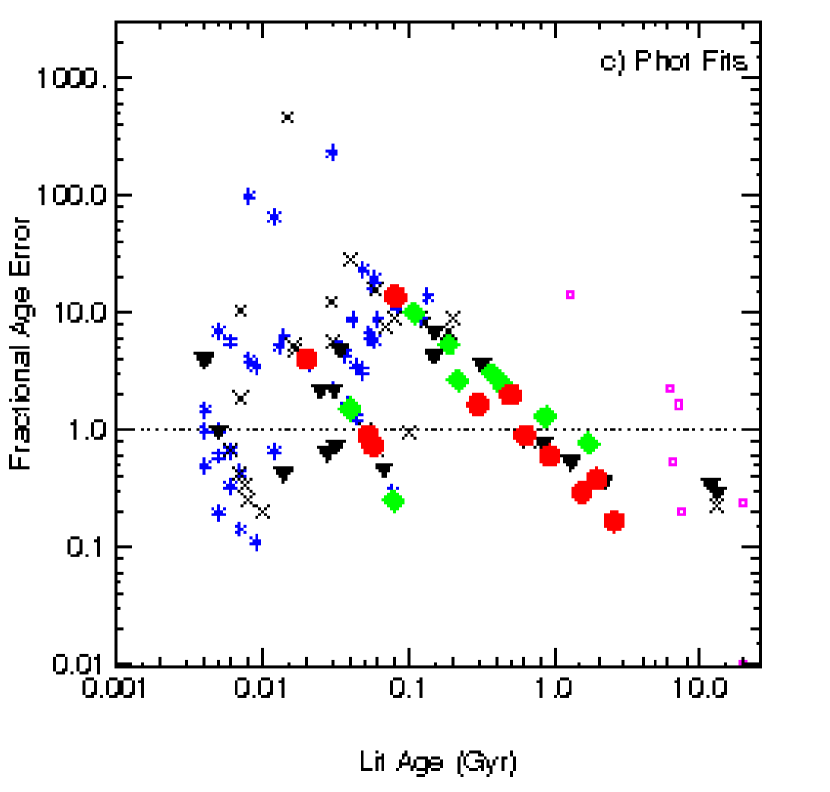
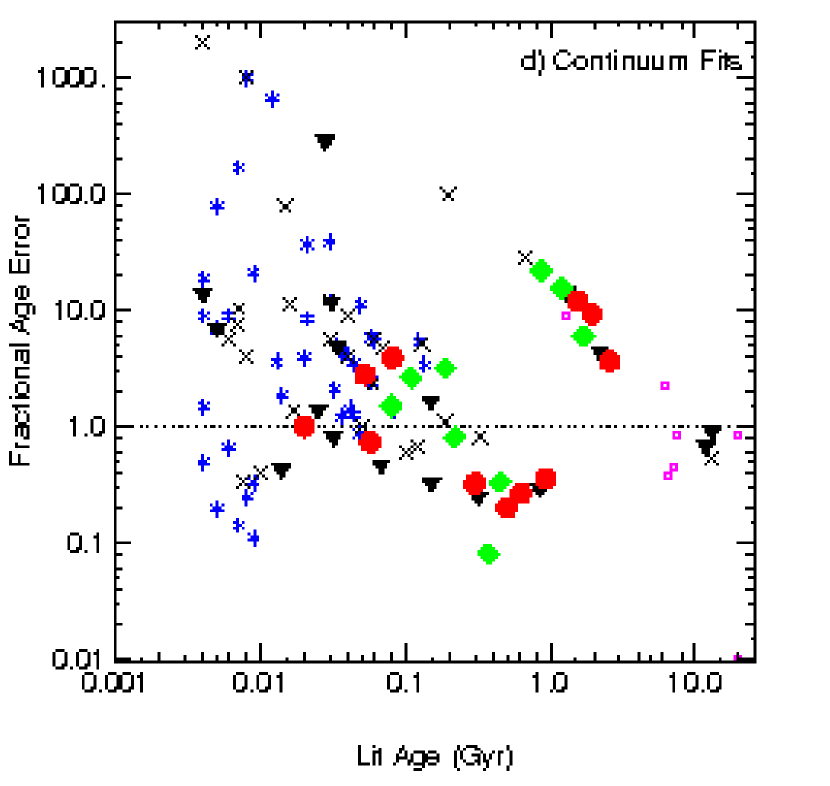
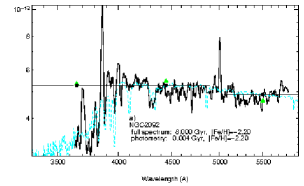
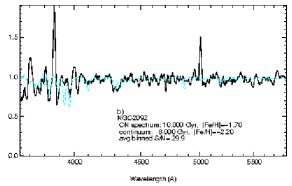
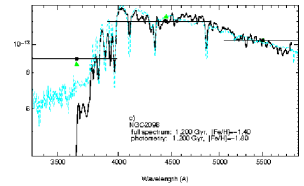
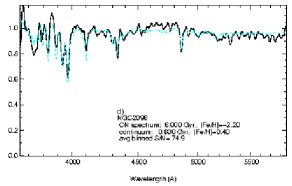
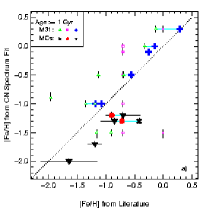
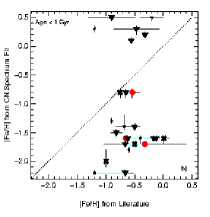
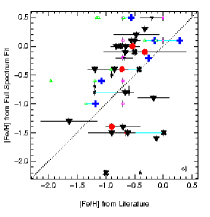
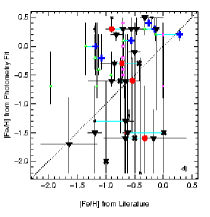
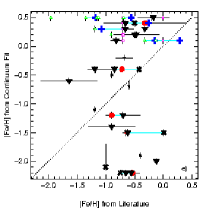
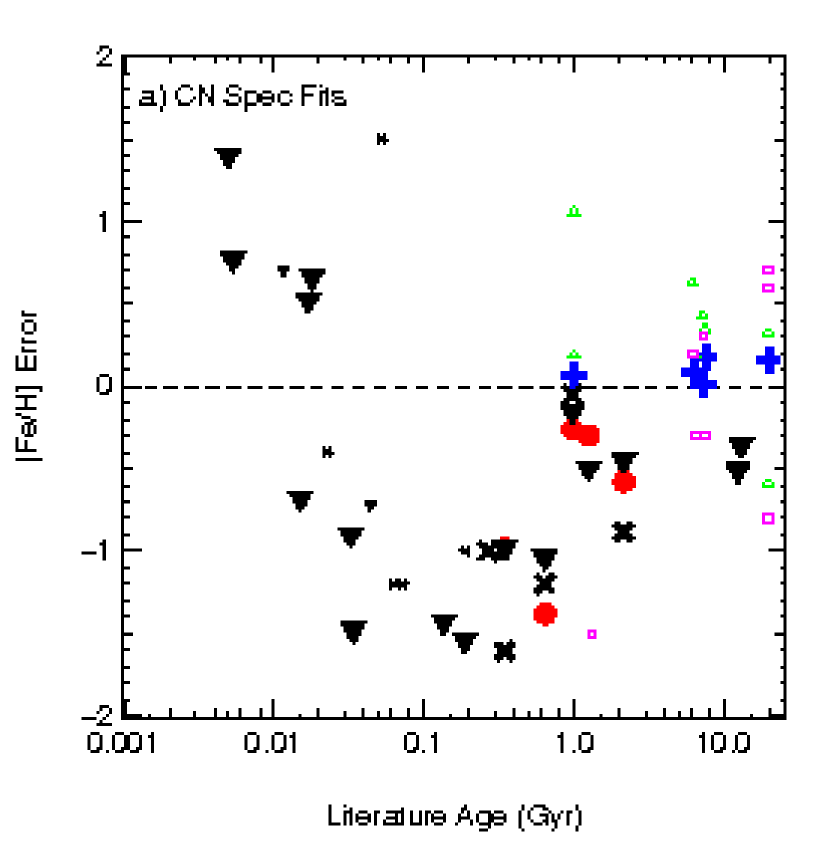
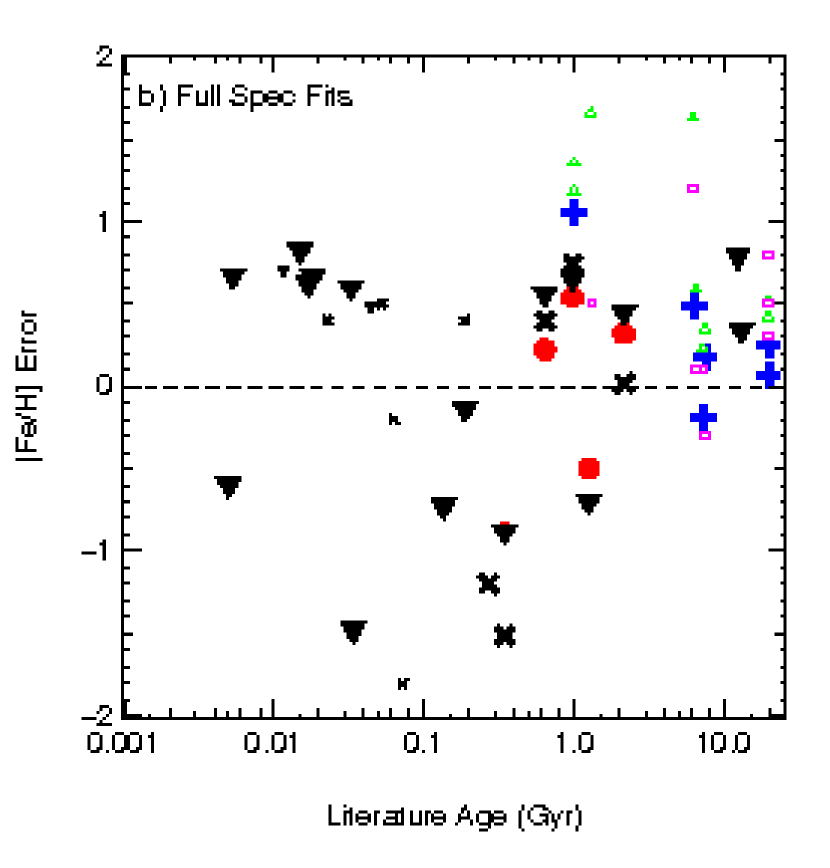
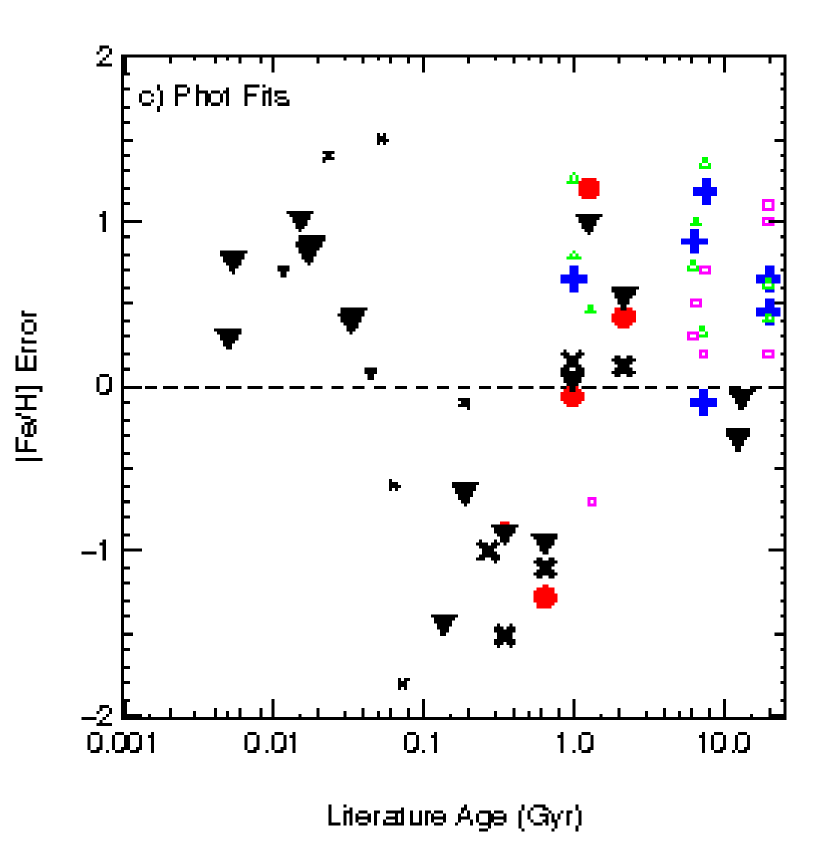
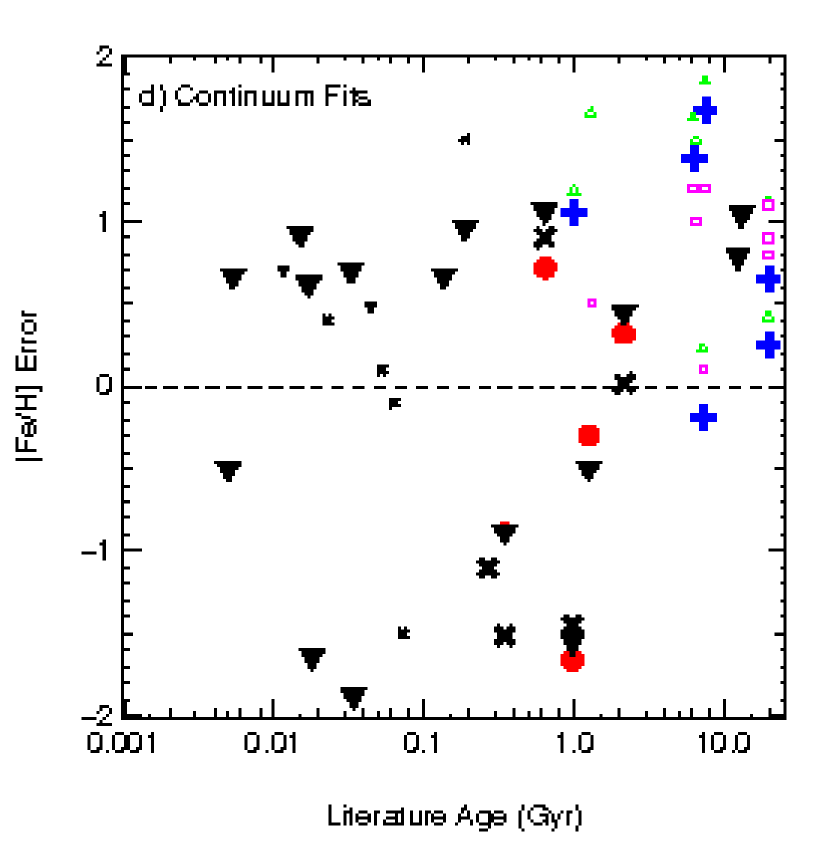
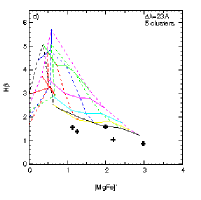
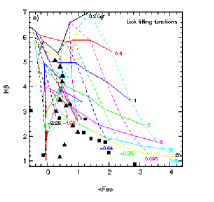
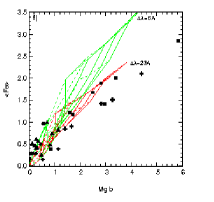
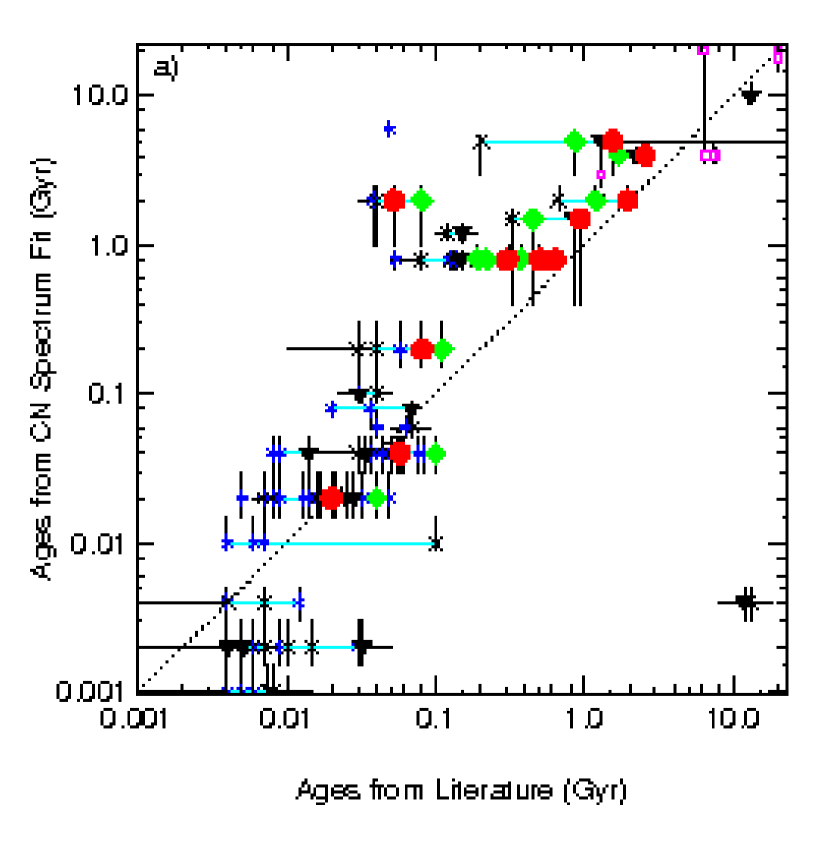
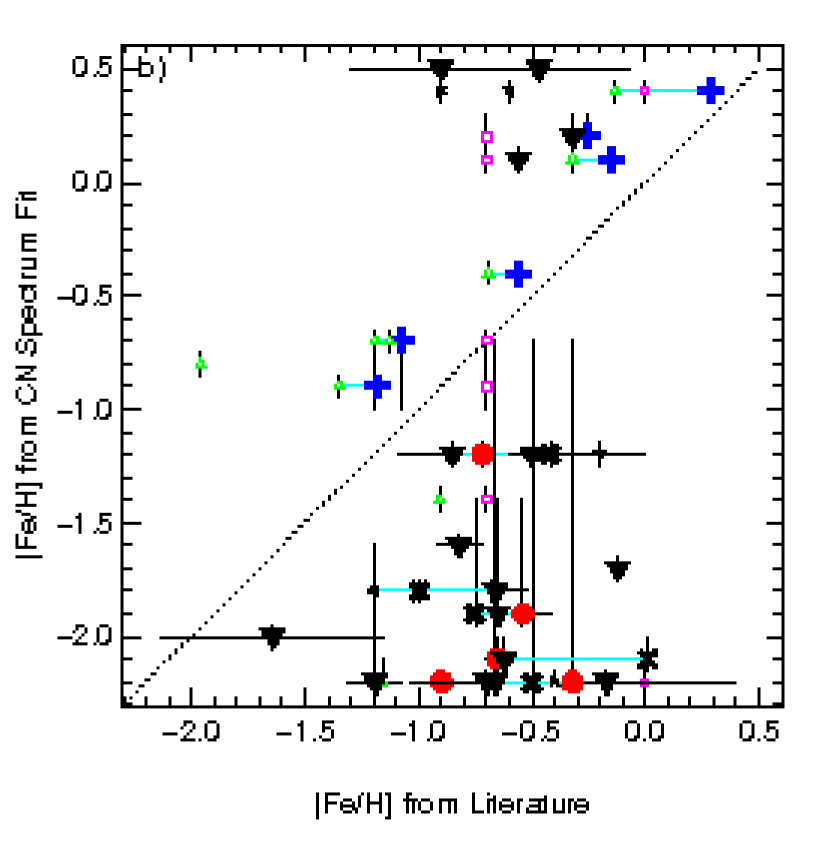
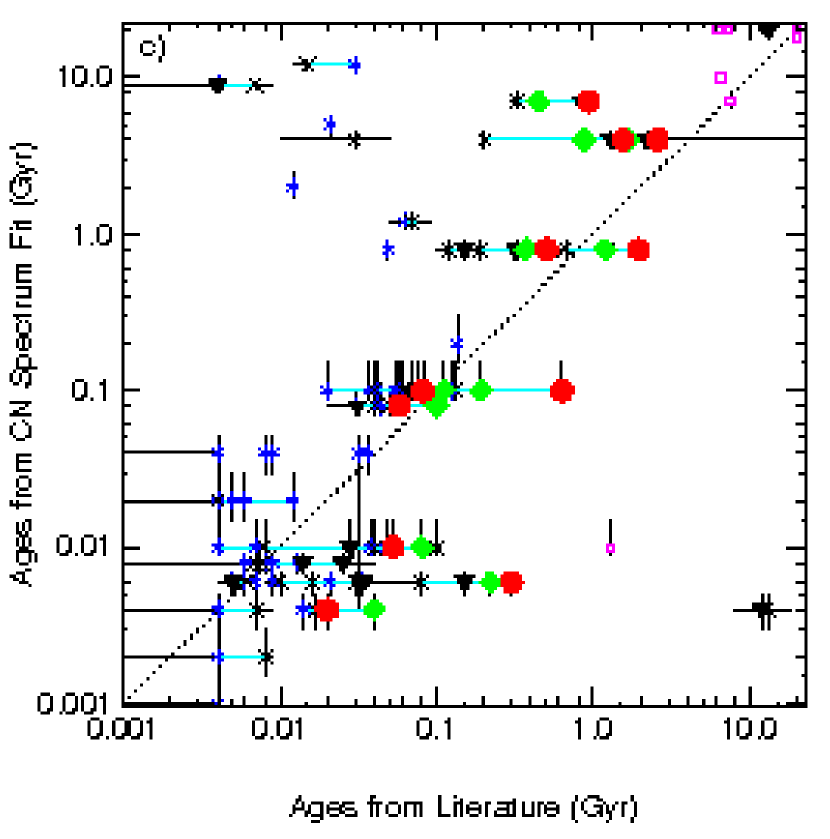
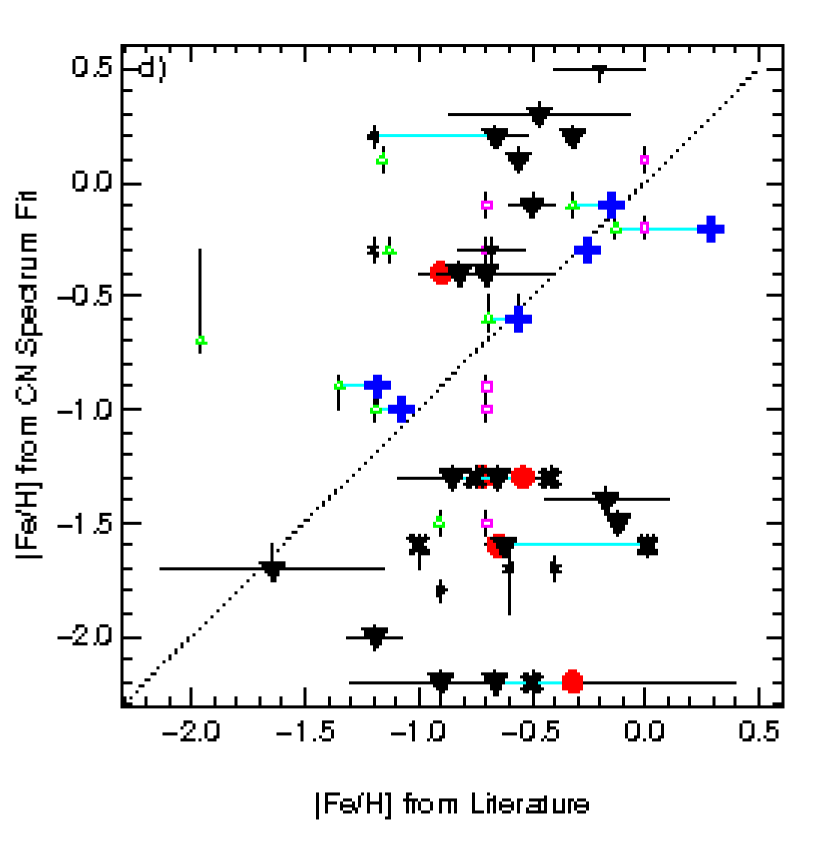
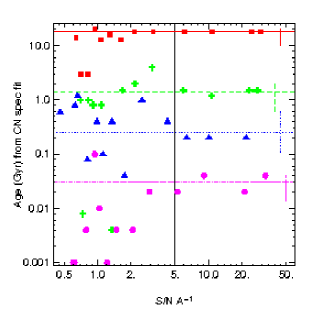
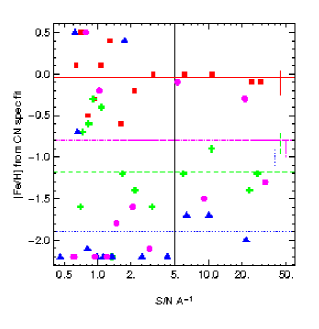
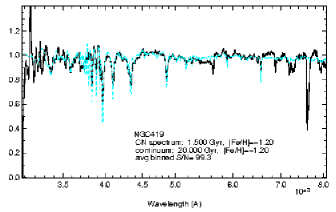
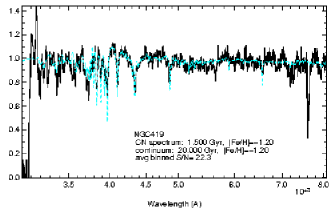
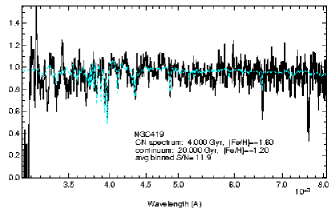
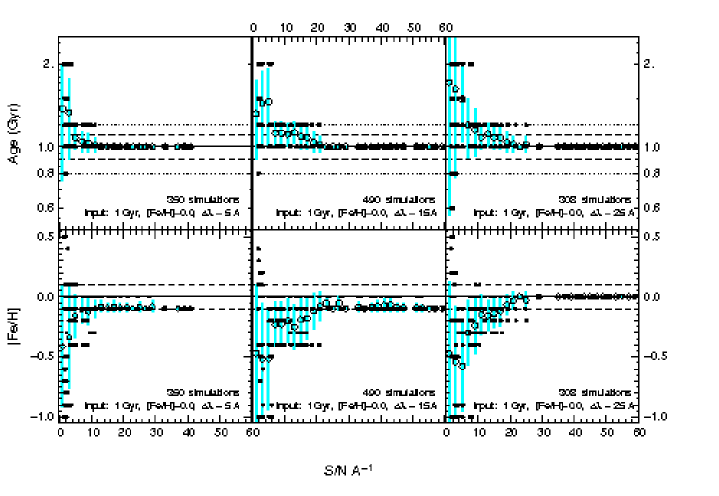
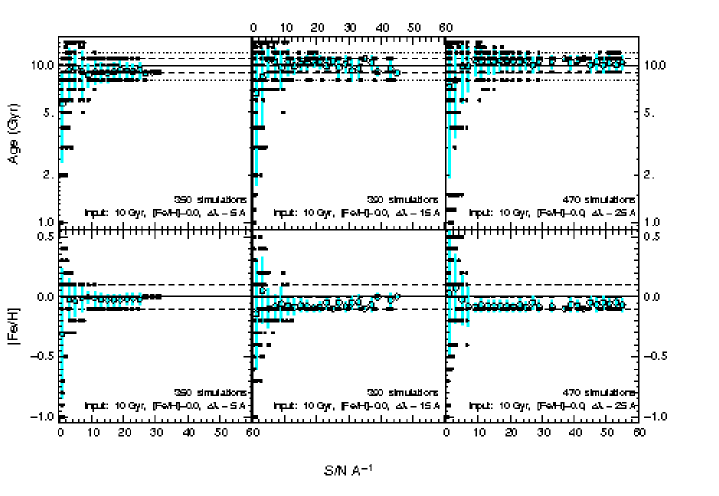
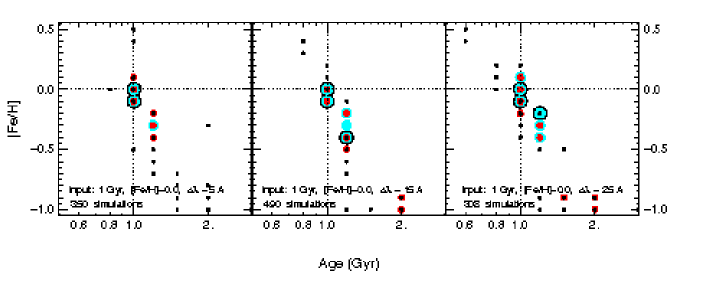
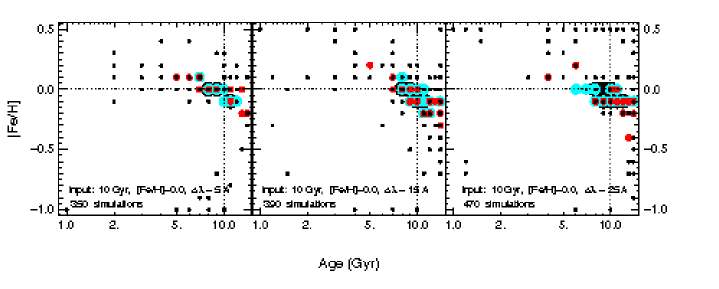
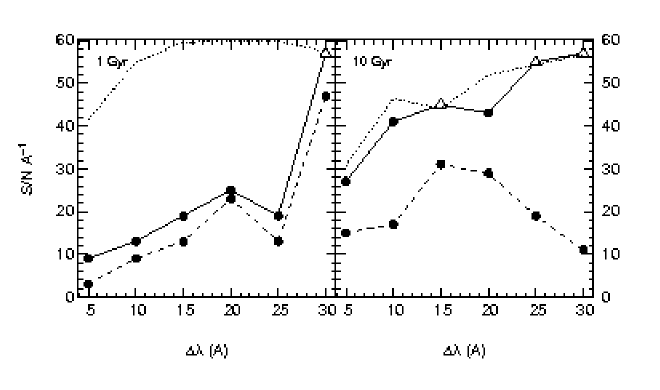
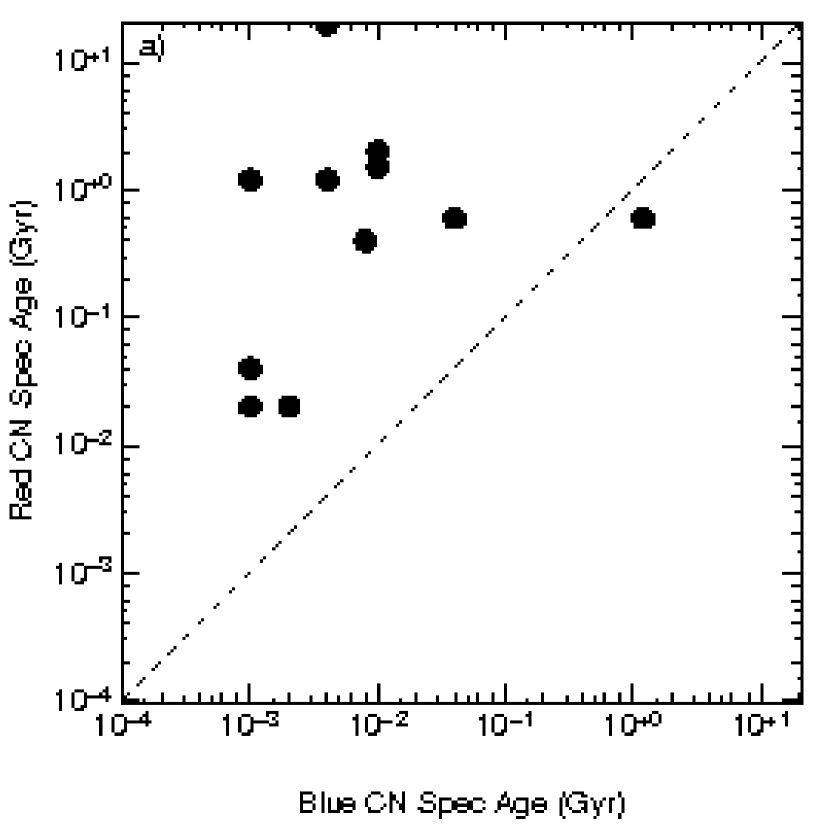
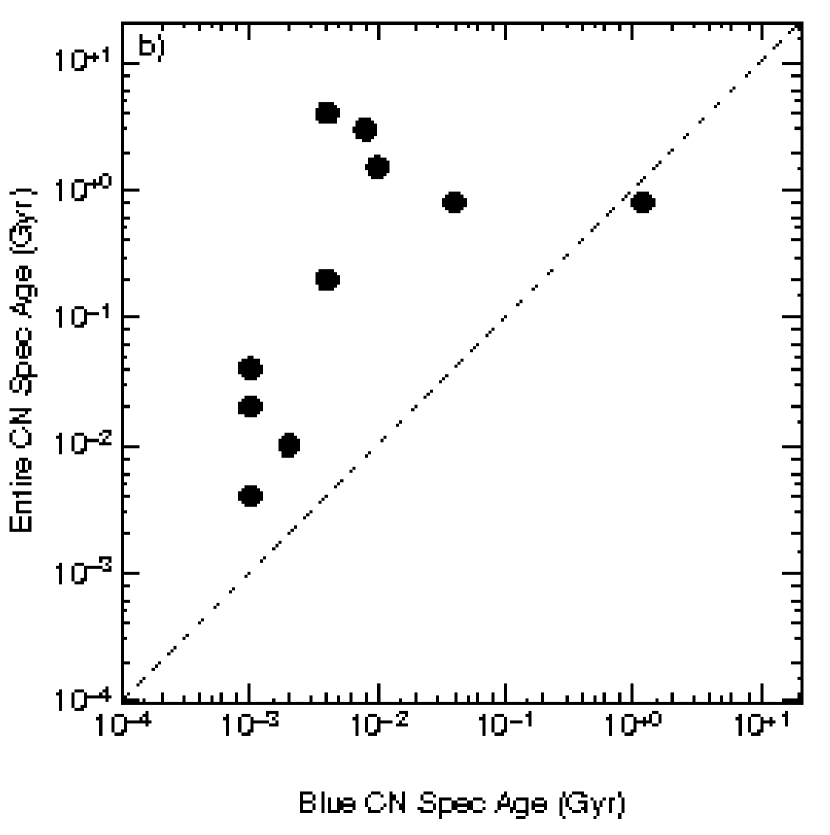
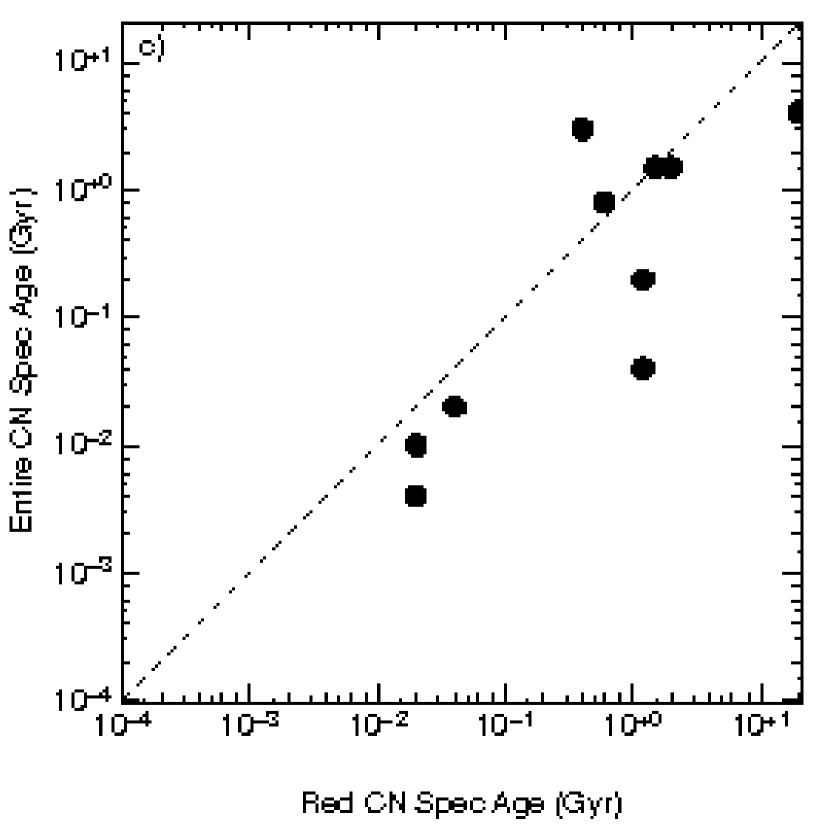
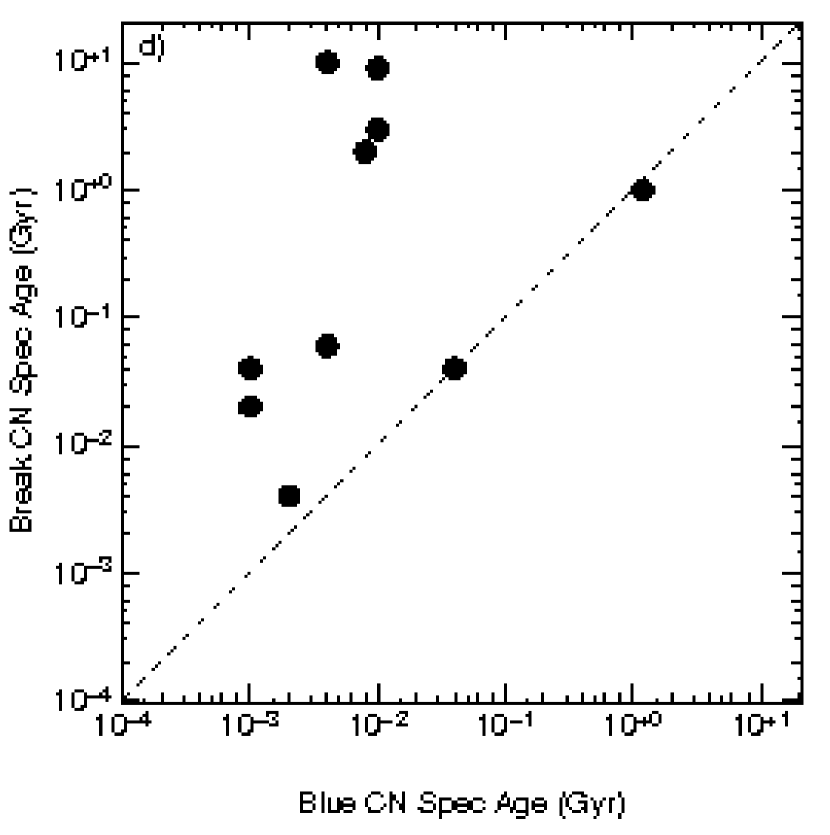
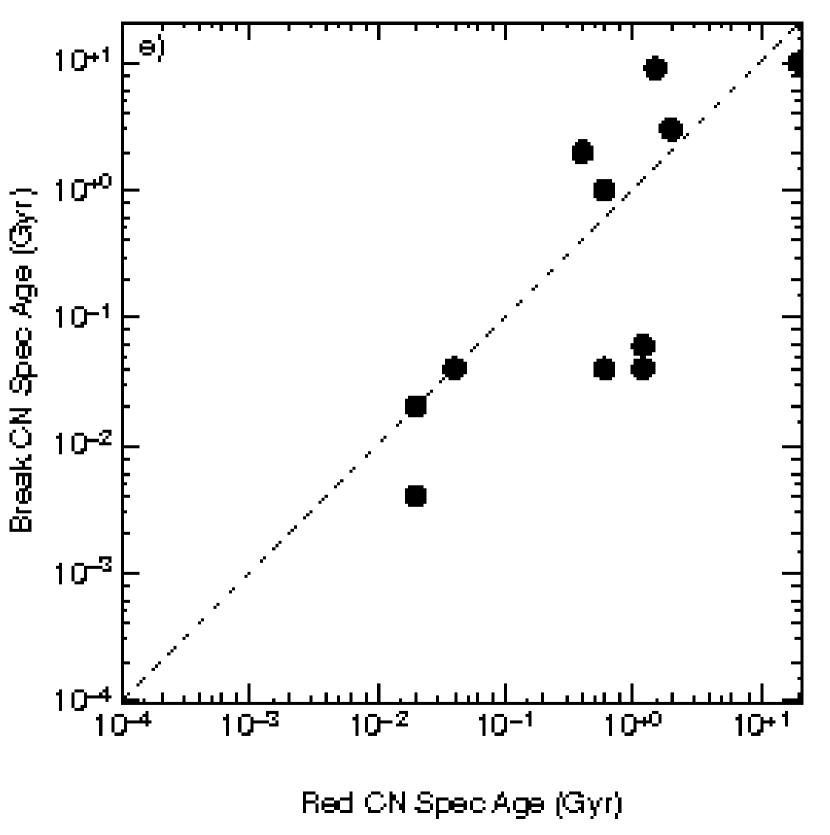
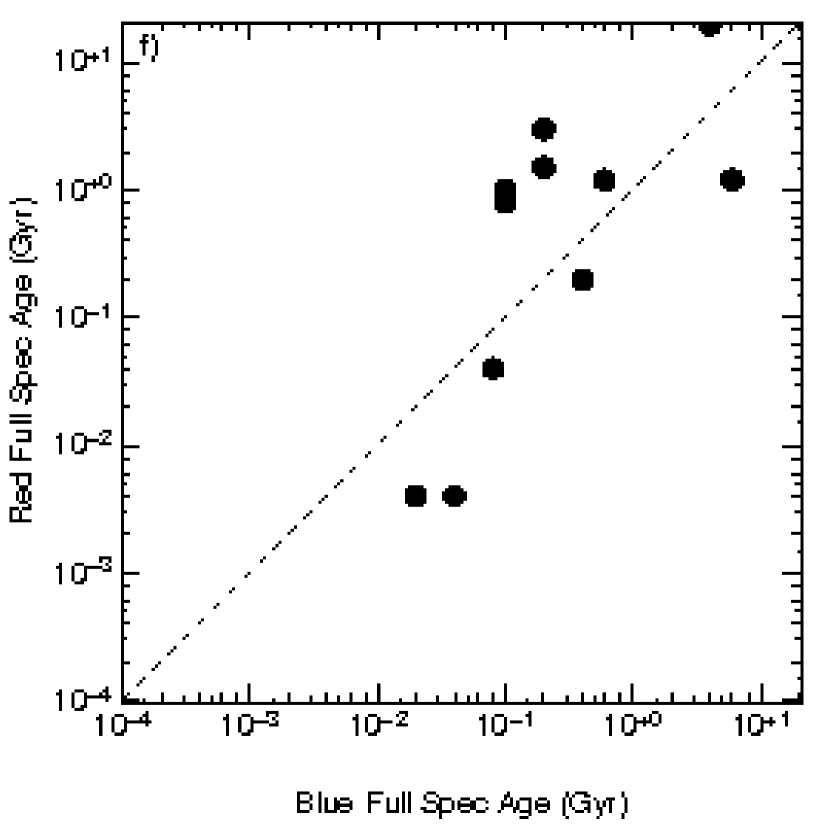
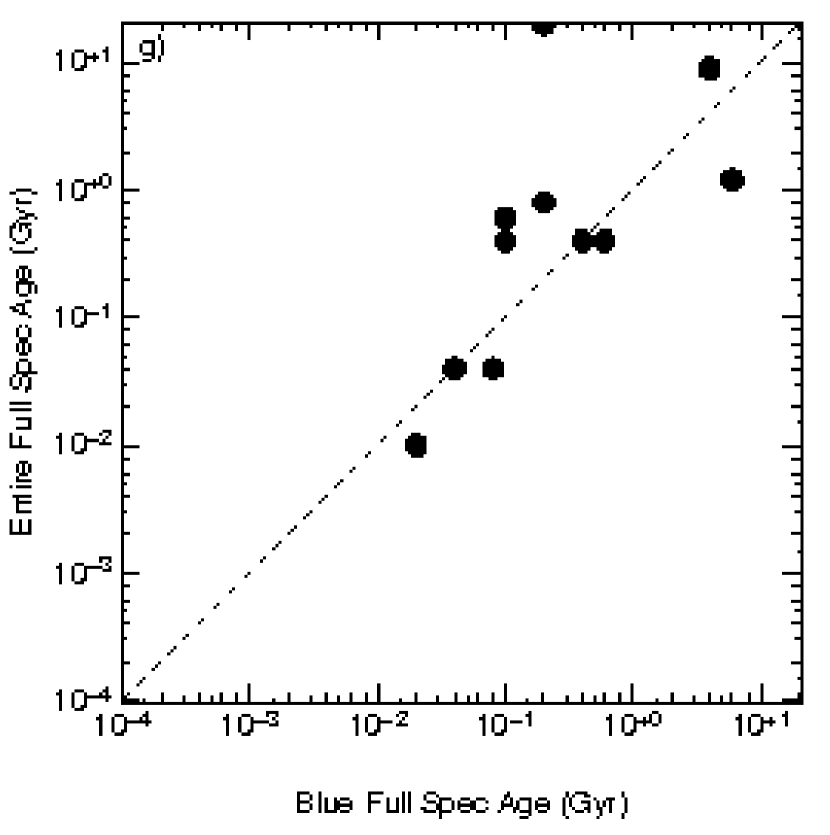
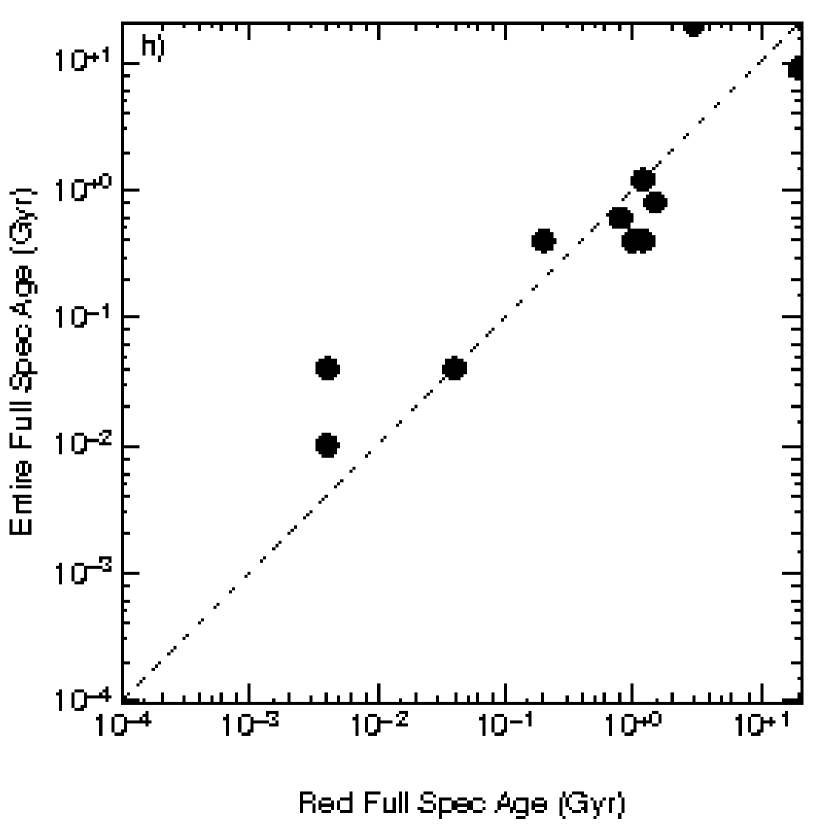
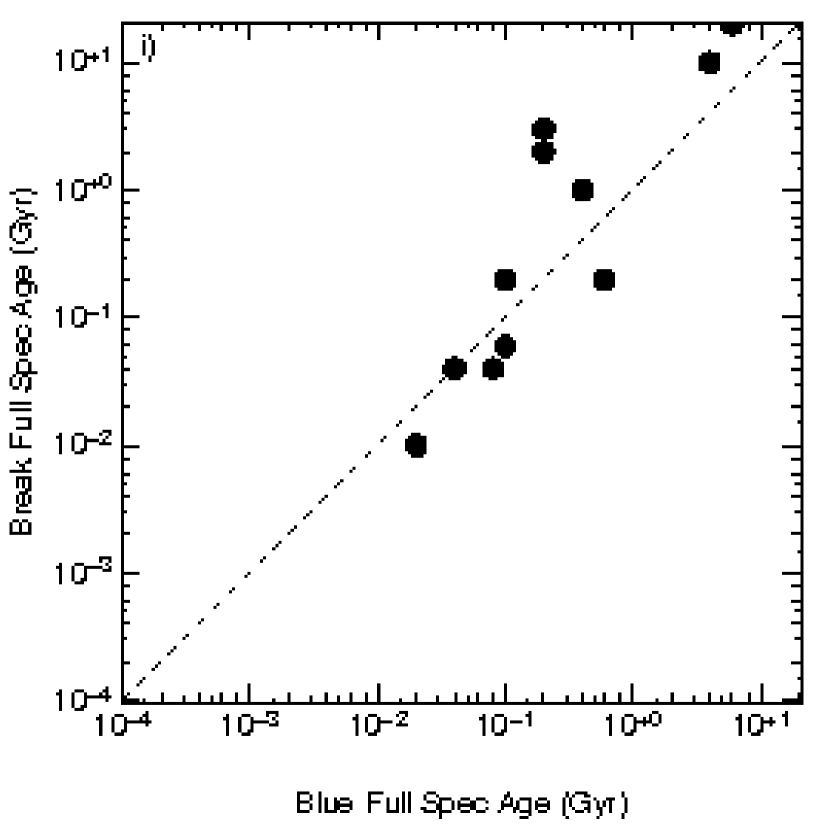
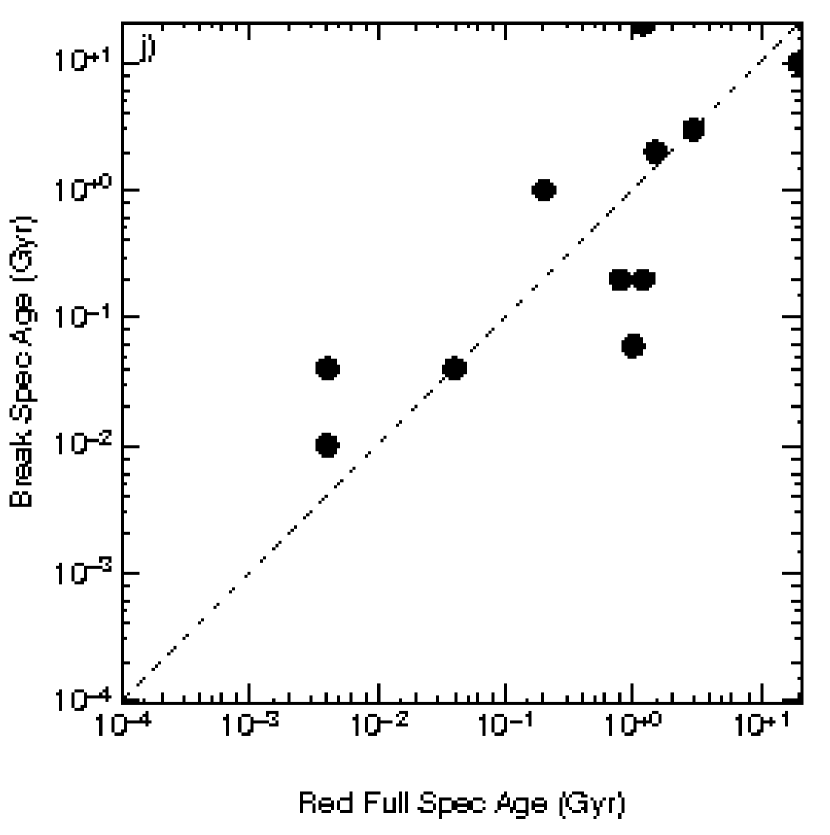
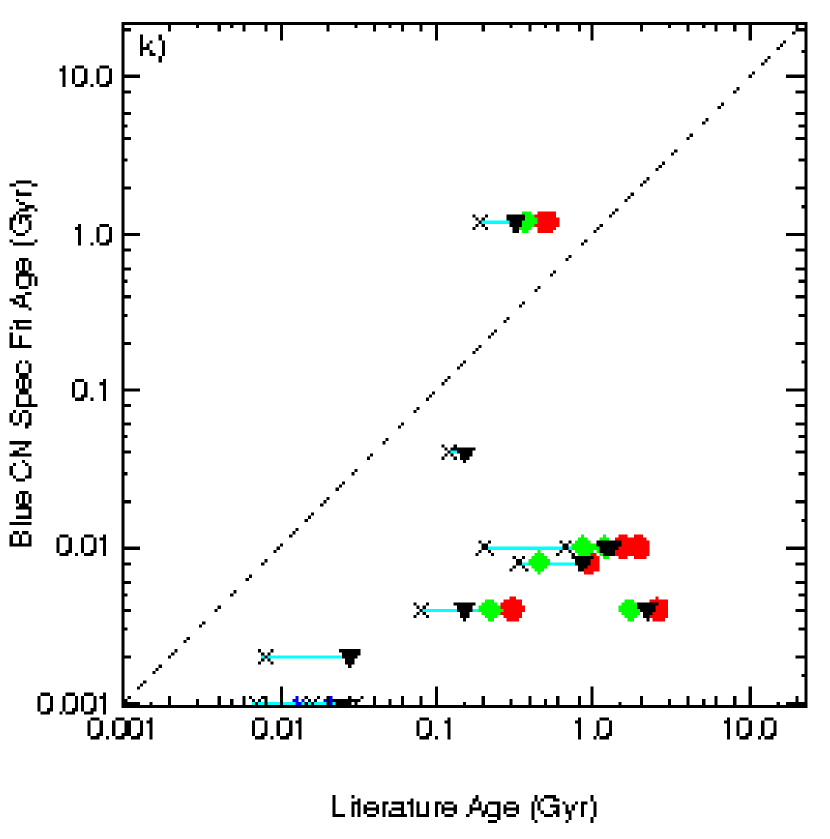
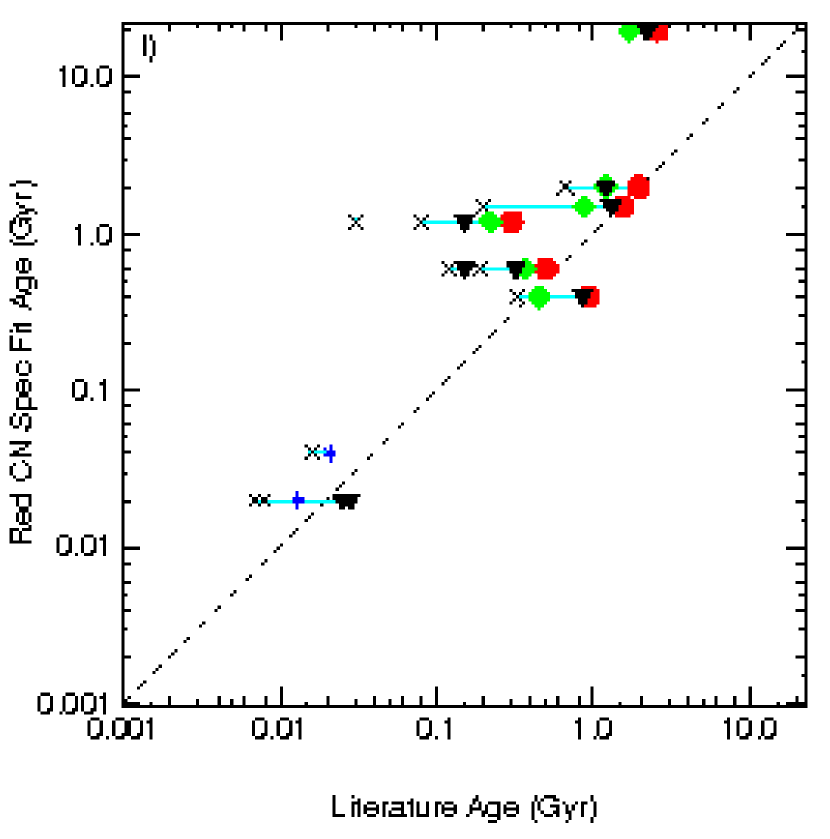
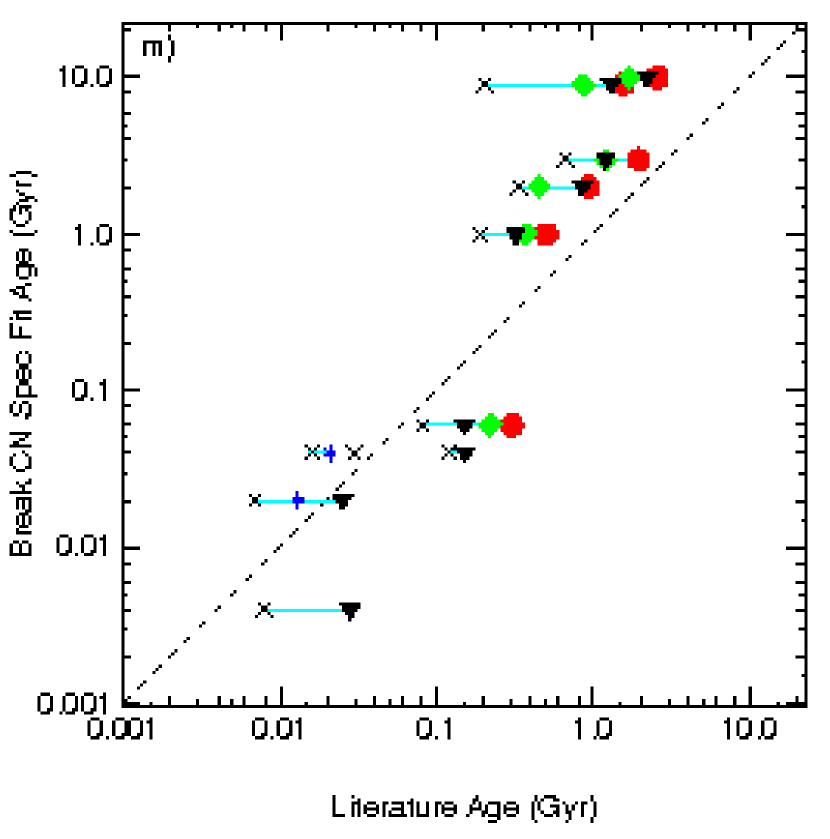
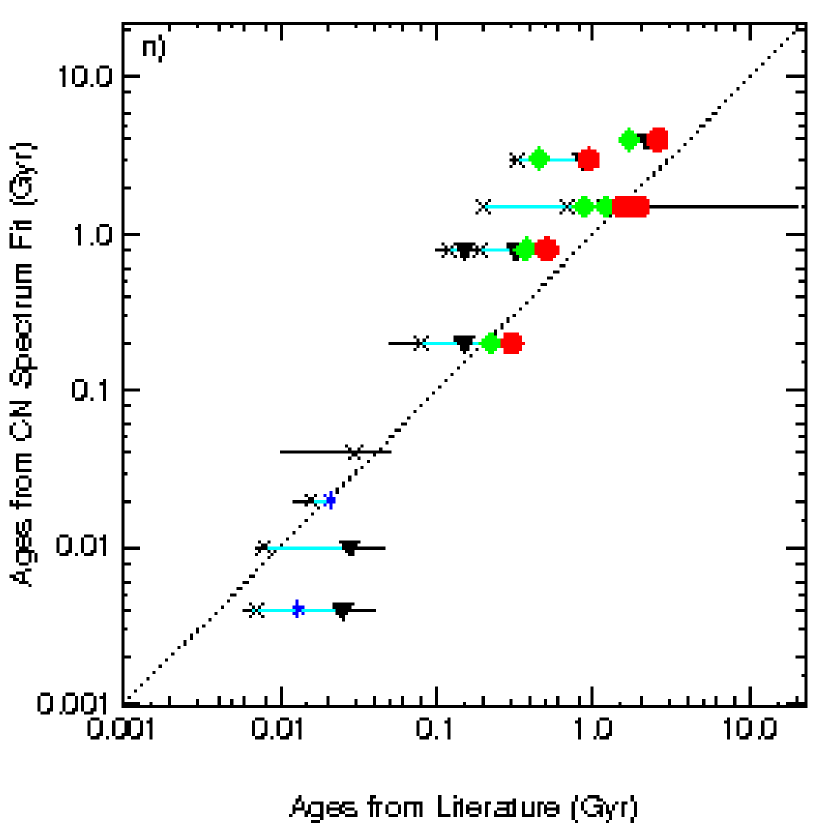
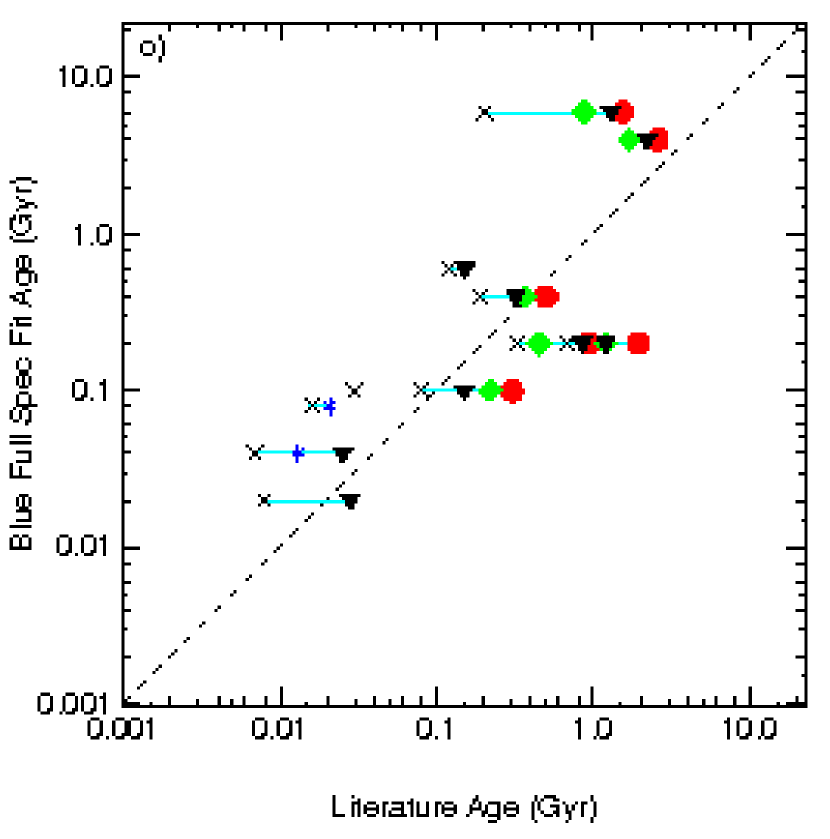
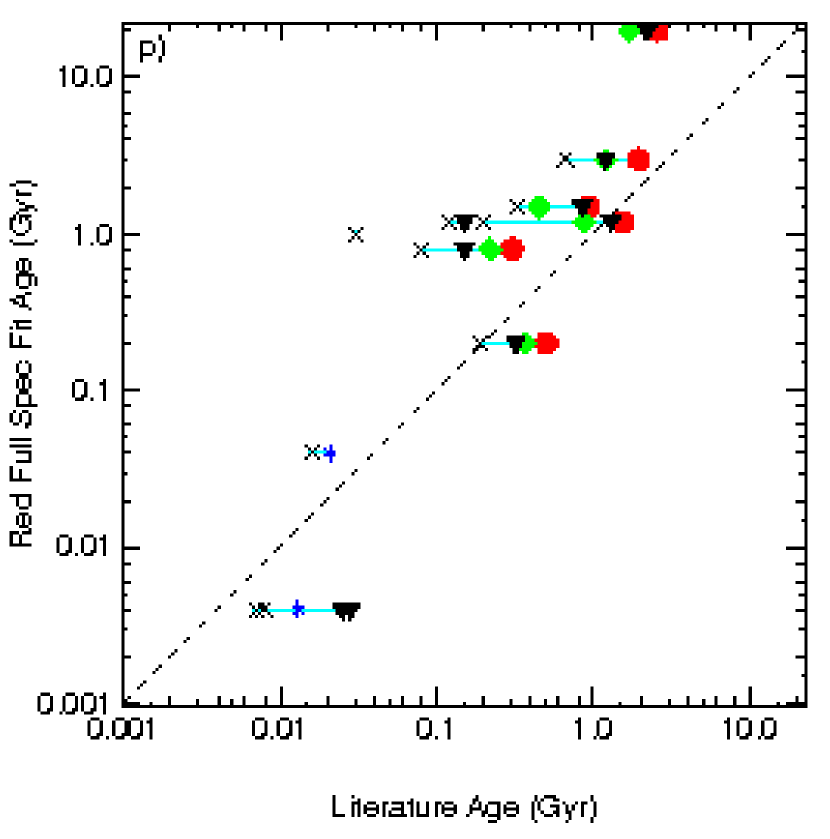
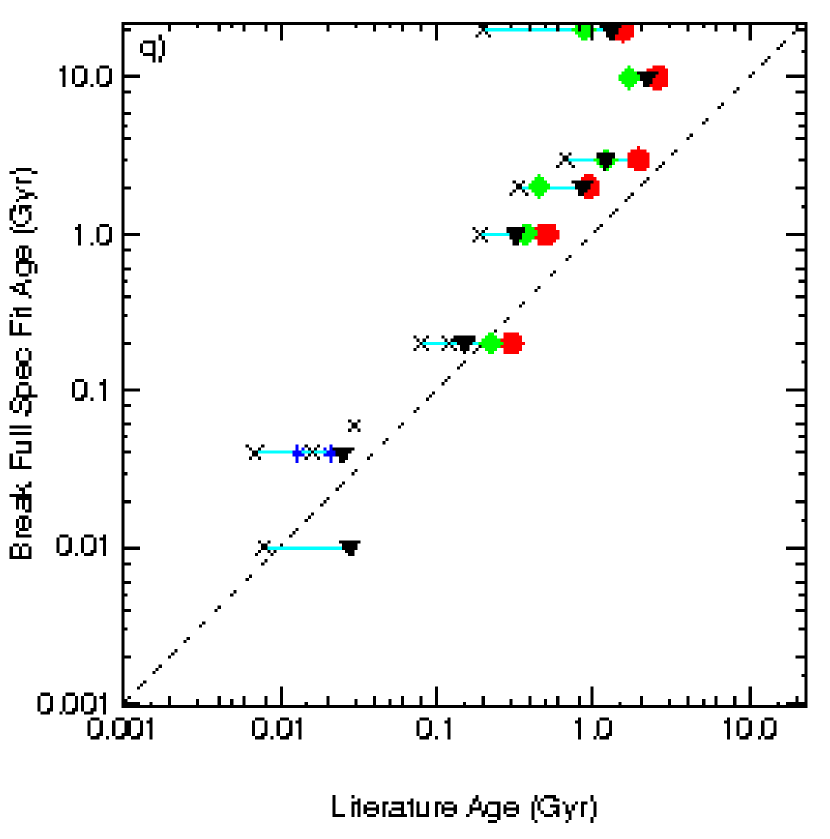
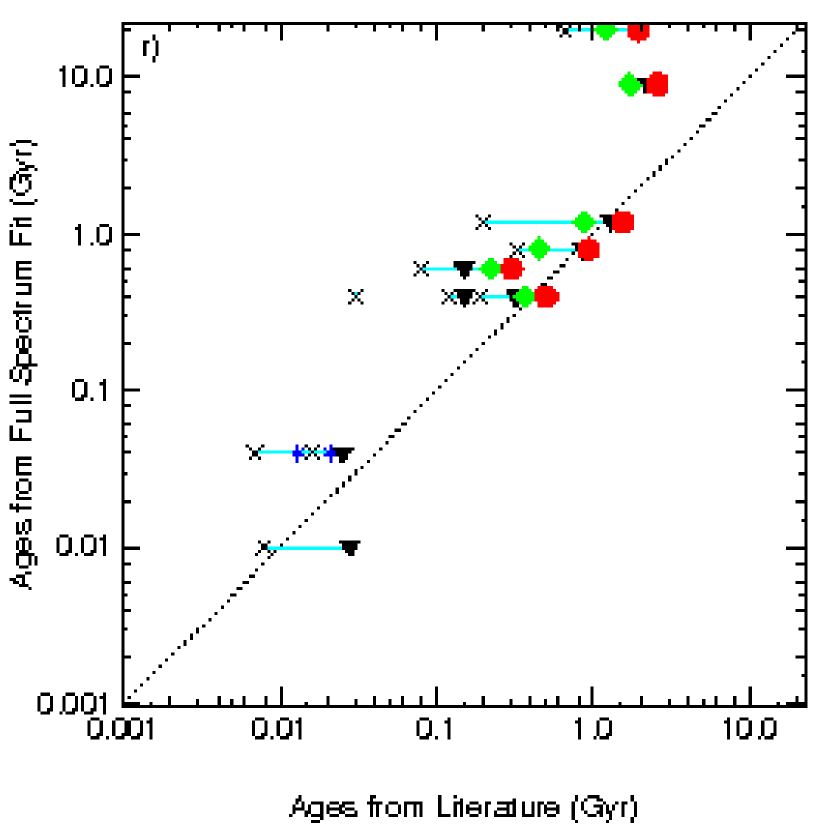
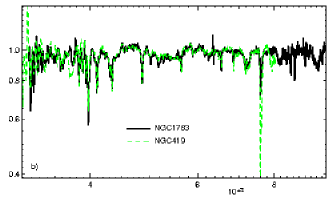
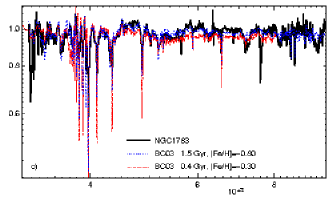
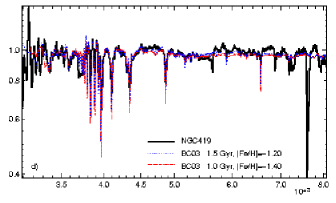
| UV | UV | UV | Optical | Optical | Optical | IR | IR | IR | ||
|---|---|---|---|---|---|---|---|---|---|---|
| Object | Resolution | Resolution | Resolution | Refs | ||||||
| LMC | ||||||||||
| H88-267 | 3500 | 5870 | 16 | 1 | ||||||
| HD269828 | 3500 | 5870 | 16 | 1 | ||||||
| HD32228 | 3500 | 5812 | 16 | 1 | ||||||
| IC2105 | 3500 | 4704 | 12 | 1 | ||||||
| IC2111 | 3500 | 4704 | 12 | 1 | ||||||
| IC2116 | 3500 | 5878 | 16 | 1 | ||||||
| KMHK1074 | 3500 | 5878 | 16 | 1 | ||||||
| NGC1466 | 3000 | 5652 | 15 | 2 | ||||||
| NGC1711 | 3500 | 5878 | 16 | 5600 | 10000 | 14 | 1,3 | |||
| NGC1714 | 3700 | 8200 | 11 | 6365 | 9809 | 12.5 | 1,4,5 | |||
| NGC1731 | 3500 | 4704 | 12 | 1 | ||||||
| NGC1735 | 3500 | 4704 | 12 | 5600 | 10000 | 14 | 1,3 | |||
| NGC1736 | 3500 | 4704 | 12 | 1 | ||||||
| NGC1743 | 3500 | 4740 | 12 | 1 | ||||||
| NGC1755 | 3500 | 4704 | 12 | 5600 | 10000 | 14 | 1,3 | |||
| NGC1761 | 3500 | 5812 | 16 | 1 | ||||||
| NGC1767 | 3400 | 9700 | 12 | 5656 | 10112 | 14 | 1,3,6 | |||
| NGC1772 | 3500 | 5870 | 16 | 1 | ||||||
| NGC1774 | 3500 | 4704 | 12 | 5600 | 10000 | 14 | 1,3 | |||
| NGC1782 | 3500 | 4702 | 12 | 5600 | 10000 | 14 | 1,3 | |||
| NGC1783 | 3000 | 5654 | 15 | 3700 | 8200 | 11 | 6365 | 9809 | 12.5 | 2,4,5 |
| NGC1805 | 3500 | 5878 | 16 | 5600 | 10000 | 14 | 1,3 | |||
| NGC1818 | 3500 | 4704 | 12 | 5600 | 10000 | 14 | 1,3 | |||
| NGC1831 | 3000 | 5652 | 15 | 3700 | 8200 | 11 | 5656 | 9800 | 14 | 2,3,5 |
| NGC1847 | 3000 | 5652 | 15 | 3700 | 8200 | 11 | 5656 | 9796 | 14 | 2,1,3,5 |
| NGC1850 | 3500 | 5878 | 16 | 5600 | 10000 | 14 | 1,3 | |||
| NGC1850A | 3500 | 5878 | 16 | 1 | ||||||
| NGC1854 | 3500 | 5878 | 16 | 5600 | 10000 | 14 | 1,3 | |||
| NGC1856 | 3000 | 5654 | 15 | 3700 | 8200 | 11 | 5656 | 9800 | 14 | 2,3,5 |
| NGC1866 | 3000 | 5654 | 15 | 3700 | 8200 | 11 | 5656 | 9800 | 14 | 2,3,5 |
| NGC1868 | 3000 | 5654 | 15 | 3700 | 8200 | 11 | 5656 | 9800 | 14 | 2,3,5 |
| NGC1872 | 3500 | 4704 | 12 | 1 | ||||||
| NGC1895 | 3700 | 8200 | 11 | 6365 | 9809 | 12.5 | 4,5 | |||
| NGC1903 | 3500 | 4704 | 12 | 5600 | 10000 | 14 | 1,3 | |||
| NGC1921 | 3500 | 4704 | 12 | 1 | ||||||
| NGC1935 | 3500 | 4704 | 12 | 1 | ||||||
| NGC1936 | 3500 | 4702 | 12 | 1 | ||||||
| NGC1949 | 3500 | 4704 | 12 | 1 | ||||||
| NGC1951 | 3500 | 4702 | 12 | 5600 | 10000 | 14 | 1,3 | |||
| NGC1967 | 3500 | 5870 | 16 | 1 | ||||||
| NGC1970 | 3500 | 4704 | 12 | 1 | ||||||
| NGC1978 | 3000 | 5654 | 15 | 3700 | 8200 | 11 | 6365 | 9811 | 12.5 | 2,4,5 |
| NGC1983 | 3500 | 5874 | 16 | 1 | ||||||
| NGC1984 | 3500 | 5870 | 16 | 1 | ||||||
| NGC1994 | 3500 | 5870 | 16 | 5600 | 10000 | 14 | 1,3 | |||
| NGC2002 | 3500 | 5870 | 16 | 5600 | 10000 | 14 | 1,3 | |||
| NGC2003 | 3400 | 9700 | 12 | 5656 | 10112 | 3,6 | ||||
| NGC2004 | 3000 | 5654 | 15 | 3700 | 8200 | 11 | 5656 | 9800 | 14 | 2,3,5 |
| NGC2006 | 3500 | 5874 | 16 | 5600 | 10000 | 14 | 1,3 | |||
| NGC2009 | 3500 | 5878 | 16 | 1 | ||||||
| NGC2011 | 3500 | 5870 | 16 | 5600 | 10000 | 14 | 1,3 | |||
| NGC2021 | 3500 | 5878 | 16 | 1 | ||||||
| NGC2025 | 3500 | 4704 | 12 | 5600 | 10000 | 14 | 1,3 | |||
| NGC2032 | 3500 | 4704 | 12 | 1 | ||||||
| NGC2033 | 3500 | 5878 | 16 | 1 | ||||||
| NGC2035 | 3500 | 4704 | 12 | 1 | ||||||
| NGC2041 | 3500 | 4704 | 12 | 5600 | 10000 | 14 | 1,3 | |||
| NGC2058 | 3500 | 4704 | 12 | 5600 | 10000 | 14 | 1,3 | |||
| NGC2070 | 3000 | 5654 | 15 | 3700 | 8200 | 11 | 2,5 | |||
| NGC2091 | 3500 | 5878 | 16 | 1 | ||||||
| NGC2092 | 3500 | 5878 | 16 | 1 | ||||||
| NGC2096 | 3500 | 5874 | 16 | 1 | ||||||
| NGC2098 | 3500 | 5870 | 16 | 5600 | 10000 | 14 | 1,3 | |||
| NGC2100 | 3700 | 8200 | 11 | 5656 | 10112 | 14 | 1,3,5 | |||
| NGC2102 | 3500 | 5878 | 16 | 1 | ||||||
| NGC2134 | 3500 | 4704 | 12 | 5600 | 10000 | 14 | 1,3 | |||
| NGC2136 | 3500 | 4704 | 12 | 5600 | 10000 | 14 | 1,3 | |||
| NGC2147 | 3500 | 5878 | 16 | 1 | ||||||
| NGC2156 | 3500 | 4704 | 12 | 1 | ||||||
| NGC2157 | 3000 | 5654 | 15 | 3700 | 8200 | 11 | 5656 | 9800 | 14 | 2,3,5 |
| NGC2159 | 3500 | 4704 | 12 | 1 | ||||||
| NGC2164 | 3500 | 4704 | 12 | 5600 | 10000 | 14 | 1,3 | |||
| NGC2214 | 3500 | 4740 | 12 | 5600 | 10000 | 14 | 1,3 | |||
| SL153 | 3500 | 4704 | 12 | 1 | ||||||
| SL492 | 3500 | 5870 | 16 | 1 | ||||||
| SL538 | 3500 | 5870 | 16 | 5600 | 10000 | 14 | 1,3 | |||
| SL586 | 3500 | 5878 | 16 | 1 | ||||||
| SL601 | 3500 | 4704 | 12 | 1 | ||||||
| SL639 | 3500 | 5882 | 16 | 1 | ||||||
| SMC | ||||||||||
| NGC121 | 3700 | 6800 | 11 | 5 | ||||||
| NGC299 | 3500 | 5877 | 16 | 5600 | 10000 | 14 | 1,3 | |||
| NGC330 | 3000 | 5656 | 15 | 3700 | 8200 | 11 | 5658 | 10116 | 14 | 2,1,3,5 |
| NGC419 | 3000 | 5654 | 15 | 3700 | 8200 | 11 | 2,5 | |||
| M31 | ||||||||||
| Bol104 | 3200 | 6100 | 6 | 7 | ||||||
| Bol118 | 3200 | 6100 | 6 | 7 | ||||||
| Bol119 | 3200 | 6100 | 6 | 7 | ||||||
| Bol124 | 3200 | 6100 | 6 | 7 | ||||||
| G1 | 3600 | 9900 | 23 | 8 | ||||||
| G78 | 3600 | 9900 | 23 | 8 | ||||||
| G158 | 3600 | 9900 | 23 | 7,8 | ||||||
| G165 | 3200 | 6100 | 6 | 7 | ||||||
| G168 | 3200 | 6100 | 6 | 7 | ||||||
| G169 | 3200 | 6100 | 6 | 7 | ||||||
| G170 | 3600 | 9900 | 23 | 8 | ||||||
| G174 | 3200 | 6100 | 6 | 7 | ||||||
| G175 | 3200 | 6100 | 6 | 7 | ||||||
| G177 | 3600 | 9900 | 23 | 7,8 | ||||||
| G184 | 3200 | 6100 | 6 | 7 | ||||||
| G185 | 3200 | 6100 | 6 | 7 | ||||||
| G190 | 3200 | 6100 | 6 | 7 | ||||||
| G222 | 3600 | 7934 | 8 | 8 |
| (1) | (2) | (3) | (4) | (5) | (6) | (7) | (8) | (9) | (10) | |
|---|---|---|---|---|---|---|---|---|---|---|
| All | UBV | Line Index | Homog. | BC96 Phot. | Old | Young | ||||
| All | Good | MSTO | CMDsaaThese age estimates were collected from Girardi et al. (1995, 1998) and Elson & Fall (1988) by Leonardi & Rose (2003) for comparison to their estimates from line index ratios. | Colors | Ratios | Scale | Fits | 1 Gyr | 1 Gyr | |
| Locations | MC, M31 | MC, M31 | MC | MC | MC | MC | MC | M31 | MC, M31 | MC |
| References | 1,2,3,4,5,6 | 1,2,3,4,5,6 | 1 | 3,5 | 2 | 5 | 6 | 4 | 1,3,4,5,6 | 1,2,3,5,6 |
| No. objects | 75 | 73 | 29 | 11 | 54 | 11 | 18 | 8 | 4 | 61 |
| CN Spectrum Fits | ||||||||||
| Avg Offset (Gyr) | 0.84 | 0.19 | 0.12 | 0.56 | 0.03 | 0.26 | 0.59 | 4.36 | 1.63 | 0.09 |
| Avg Offset (dex) | 0.34 | 0.29 | 0.36 | 0.21 | 0.29 | 0.22 | 0.31 | 0.25 | 0.16 | 0.30 |
| RMS (Gyr) | 3.18 | 1.00 | 0.82 | 1.06 | 0.12 | 0.79 | 1.82 | 8.34 | 3.78 | 0.35 |
| RMS (dex) | 0.57 | 0.36 | 0.45 | 0.31 | 0.37 | 0.27 | 0.40 | 0.46 | 0.17 | 0.37 |
| Full Spectrum Fits | ||||||||||
| Avg Offset (Gyr) | 0.93 | 0.54 | 0.71 | 2.54 | 0.42 | 2.24 | 0.70 | 3.24 | 2.76 | 0.39 |
| Avg Offset (dex) | 0.70 | 0.69 | 0.64 | 0.36 | 0.78 | 0.33 | 0.52 | 0.36 | 0.70 | 0.69 |
| RMS (Gyr) | 4.42 | 3.20 | 3.68 | 6.08 | 1.56 | 5.78 | 5.43 | 9.61 | 11.55 | 1.47 |
| RMS (dex) | 0.93 | 0.90 | 0.71 | 0.51 | 0.98 | 0.44 | 0.64 | 0.42 | 0.79 | 0.91 |
| Photometry Fits | ||||||||||
| Avg Offset (Gyr) | 0.99 | 0.48 | 0.73 | 0.67 | 0.34 | 0.37 | 0.74 | 5.24 | 2.06 | 0.38 |
| Avg Offset (dex) | 0.004 | 0.59 | 0.71 | 0.42 | 0.63 | 0.38 | 0.41 | 0.32 | 0.10 | 0.62 |
| RMS (Gyr) | 3.29 | 1.19 | 1.55 | 0.85 | 1.04 | 0.61 | 1.42 | 9.47 | 2.67 | 1.02 |
| RMS (dex) | 0.52 | 0.76 | 0.90 | 0.52 | 0.80 | 0.48 | 0.49 | 0.49 | 0.11 | 0.78 |
| Continuum Fits | ||||||||||
| Avg Offset (Gyr) | 0.87 | 1.17 | 2.05 | 4.51 | 0.46 | 4.21 | 2.90 | -2.49 | 6.06 | 0.85 |
| Avg Offset (dex) | 0.06 | 0.80 | 0.84 | 0.49 | 0.84 | 0.46 | 0.73 | 0.55 | 0.80 | 0.80 |
| RMS (Gyr) | 5.44 | 4.30 | 5.51 | 8.66 | 1.57 | 8.29 | 7.71 | 10.88 | 12.72 | 3.02 |
| RMS (dex) | 0.74 | 1.03 | 1.05 | 0.68 | 1.04 | 0.58 | 0.93 | 0.65 | 0.73 | 1.04 |
Note. — Column 1 includes all clusters with literature ages and column 2 has excluded the two outliers in the upper left plot of Figure 5 and the objects that only have BC96 photometric fits from the literature. All columns to the right, except for column 8, also exclude these points.
| (1) | (2) | (3) | (4) | (5) | (6) | (7) | (8) | (9) | |
|---|---|---|---|---|---|---|---|---|---|
| Line | VJK | BC96 | LIR | Line Index | Homog. | Old | Young | ||
| All | Indices | Colors | Colors | Lit CompareaaThe Leonardi & Rose (2003) comparison literature values come from Olszewski et al. (1991), Cohen (1982), Seggewiss & Richtler (1989), Sagar & Pandey (1989), and Piatti et al. (2002). | Ratios | Scale | 1 Gyr | 1 Gyr | |
| Locations | MC, M31 | M31 | M31 | M31 | MC | MC | MC | MC, M31 | MC |
| References | 1,2,3,4,5,6 | 1 | 2 | 3 | 4 | 5 | 6 | 1,2,3,4,5,6 | 4,5,6 |
| No. objects | 33 | 6 | 9 | 8 | 11 | 5 | 18 | 12 | 21 |
| CN Spectrum Fits | |||||||||
| Avg Offset (Gyr) | -0.23 | 0.11 | 0.25 | -0.14 | -0.68 | -0.69 | -0.37 | -0.10 | -0.29 |
| RMS (Gyr) | 0.85 | 0.12 | 0.52 | 0.71 | 1.06 | 0.81 | 0.91 | 0.41 | 1.02 |
| Full Spectrum Fits | |||||||||
| Avg Offset (Gyr) | 0.23 | 0.31 | 0.88 | 0.40 | -0.27 | -0.05 | 0.16 | 0.48 | 0.10 |
| RMS (Gyr) | 0.84 | 0.50 | 1.03 | 0.59 | 0.89 | 0.53 | 0.71 | 0.78 | 0.88 |
| Photometry Fits | |||||||||
| Avg Offset (Gyr) | 0.28 | 0.62 | 0.77 | 0.41 | -0.18 | -0.11 | 0.15 | 0.51 | 0.14 |
| RMS (Gyr) | 0.87 | 0.74 | 0.84 | 0.67 | 1.10 | 0.89 | 0.72 | 0.68 | 0.96 |
| Continuum Fits | |||||||||
| Avg Offset (Gyr) | 0.36 | 0.81 | 1.34 | 0.85 | -0.29 | -0.35 | 0.12 | 0.85 | 0.08 |
| RMS (Gyr) | 1.11 | 1.03 | 1.49 | 0.92 | 1.02 | 0.92 | 0.98 | 1.09 | 1.13 |
Note. — Column 1 includes all clusters with literature [Fe/H].
| CN Spec | CN Spec | Full Spec | UBVaaSantos et al. (1995) | MSTObbHodge (1983) | LIRccThe Leonardi & Rose (2003) comparison literature values come from Olszewski et al. (1991), Cohen (1982), Seggewiss & Richtler (1989), Sagar & Pandey (1989), and Piatti et al. (2002). | HLitddHomogeneous lit values (Santos & Piatti, 2004) | BC96eeBC96 fits to colors in BATC filters (Jiang et al., 2003) | LIffLine indices (Huchra et al., 1991) | VJKggCohen & Matthews (1994) | LIR lithhEquivalent width of Ca triplet (Olszewski et al., 1991) | LIRccThe Leonardi & Rose (2003) comparison literature values come from Olszewski et al. (1991), Cohen (1982), Seggewiss & Richtler (1989), Sagar & Pandey (1989), and Piatti et al. (2002). | HLitddHomogeneous lit values (Santos & Piatti, 2004) | |
|---|---|---|---|---|---|---|---|---|---|---|---|---|---|
| Object | Age | [Fe/H] | [Fe/H] | Age | Age | Age | Age | Age | [Fe/H] | [Fe/H] | [Fe/H] | [Fe/H] | [Fe/H] |
| LMC | |||||||||||||
| H88-267 | 0.005 | ||||||||||||
| HD32228 | 0.004 | ||||||||||||
| HD269828 | 0.004 | ||||||||||||
| IC2105 | |||||||||||||
| IC2111 | |||||||||||||
| IC2116 | |||||||||||||
| KMHK1074 | 0.004 | ||||||||||||
| NGC1466 | 13.100 | -1.64 | |||||||||||
| NGC1711 | 0.020 | 0.068 | -0.68 | ||||||||||
| NGC1714 | |||||||||||||
| NGC1731 | 0.004 | ||||||||||||
| NGC1735 | 0.032 | ||||||||||||
| NGC1736 | |||||||||||||
| NGC1743 | |||||||||||||
| NGC1755 | 0.055 | ||||||||||||
| NGC1761 | |||||||||||||
| NGC1767 | 0.007 | ||||||||||||
| NGC1772 | 0.009 | ||||||||||||
| NGC1774 | 0.037 | ||||||||||||
| NGC1782 | 0.036 | ||||||||||||
| NGC1783 | 0.200 | 1.548 | 1.300 | -0.75 | -0.54 | -0.65 | |||||||
| NGC1805 | 0.009 | 0.014 | -0.20 | ||||||||||
| NGC1818 | 0.014 | 0.017 | 0.020 | -0.90 | |||||||||
| NGC1831 | 0.190 | 0.501 | 0.320 | 0.01 | -0.65 | -0.62 | |||||||
| NGC1847 | 0.021 | 0.016 | |||||||||||
| NGC1850 | 0.031 | 0.040 | 0.031 | -0.12 | |||||||||
| NGC1850A | 0.004 | ||||||||||||
| NGC1854 | 0.034 | 0.030 | 0.034 | -0.50 | |||||||||
| NGC1856 | 0.120 | 0.151 | -0.17 | ||||||||||
| NGC1866 | 0.080 | 0.302 | 0.150 | -1.20 | -0.66 | ||||||||
| NGC1868 | 0.330 | 0.933 | 0.850 | -0.50 | -0.32 | -0.66 | |||||||
| NGC1872 | 0.136 | ||||||||||||
| NGC1895 | |||||||||||||
| NGC1903 | 0.044 | ||||||||||||
| NGC1921 | 0.041 | ||||||||||||
| NGC1935 | |||||||||||||
| NGC1936 | |||||||||||||
| NGC1949 | |||||||||||||
| NGC1951 | 0.048 | ||||||||||||
| NGC1967 | 0.004 | 0.100 | |||||||||||
| NGC1970 | 0.004 | ||||||||||||
| NGC1978 | 2.570 | 2.200 | -0.42 | -0.72 | -0.85 | ||||||||
| NGC1983 | 0.004 | 0.008 | |||||||||||
| NGC1984 | 0.004 | 0.007 | 0.004 | -0.90 | |||||||||
| NGC1994 | 0.006 | 0.007 | |||||||||||
| NGC2002 | 0.008 | ||||||||||||
| NGC2003 | |||||||||||||
| NGC2004 | 0.008 | 0.028 | -0.56 | ||||||||||
| NGC2006 | 0.005 | ||||||||||||
| NGC2009 | 0.006 | ||||||||||||
| NGC2011 | 0.005 | 0.006 | 0.005 | -0.47 | |||||||||
| NGC2021 | 0.004 | ||||||||||||
| NGC2025 | 0.083 | ||||||||||||
| NGC2032 | |||||||||||||
| NGC2033 | 0.004 | ||||||||||||
| NGC2035 | |||||||||||||
| NGC2041 | 0.058 | ||||||||||||
| NGC2058 | 0.062 | 0.070 | |||||||||||
| NGC2070 | |||||||||||||
| NGC2091 | 0.007 | ||||||||||||
| NGC2092 | 0.012 | 0.004 | |||||||||||
| NGC2096 | 0.049 | ||||||||||||
| NGC2098 | 0.008 | ||||||||||||
| NGC2100 | 0.009 | 0.010 | 0.032 | -0.32 | |||||||||
| NGC2102 | 0.004 | 0.007 | |||||||||||
| NGC2134 | 0.124 | 0.130 | 0.631 | -1.00 | |||||||||
| NGC2136 | 0.058 | 0.040 | 0.081 | -0.40 | |||||||||
| NGC2147 | 0.021 | ||||||||||||
| NGC2156 | 0.077 | 0.060 | |||||||||||
| NGC2157 | 0.030 | ||||||||||||
| NGC2159 | 0.056 | 0.060 | |||||||||||
| NGC2164 | 0.044 | 0.050 | 0.058 | -0.60 | |||||||||
| NGC2214 | 0.038 | 0.040 | 0.052 | -1.20 | |||||||||
| SL153 | 0.054 | ||||||||||||
| SL492 | 0.005 | ||||||||||||
| SL538 | 0.006 | ||||||||||||
| SL586 | |||||||||||||
| SL601 | 0.004 | ||||||||||||
| SL639 | 0.030 | 0.015 | |||||||||||
| SMC | |||||||||||||
| NGC121 | 13.000 | 11.900 | -1.19 | ||||||||||
| NGC299 | 0.012 | ||||||||||||
| NGC330 | 0.013 | 0.007 | 0.025 | -0.82 | |||||||||
| NGC419 | 0.670 | 1.950 | 1.200 | -0.70 | -0.90 | -0.70 | |||||||
| M31 | |||||||||||||
| Bo104 | 10.000 | ||||||||||||
| Bo118 | 10.000 | ||||||||||||
| Bo119 | 10.000 | ||||||||||||
| Bo124 | 10.000 | ||||||||||||
| G1 | |||||||||||||
| G78 | |||||||||||||
| G158 | 10.000 | 19.800 | -0.26 | ||||||||||
| G165 | 10.000 | -0.56 | -0.69 | ||||||||||
| G168 | 10.000 | 6.200 | -1.13 | ||||||||||
| G169 | 10.000 | 7.500 | -1.18 | -1.35 | |||||||||
| G170 | |||||||||||||
| G174 | 10.000 | 7.200 | 0.29 | -0.13 | |||||||||
| G175 | 10.000 | 1.300 | -1.16 | ||||||||||
| G177 | 10.000 | 19.800 | -0.15 | -0.32 | |||||||||
| G184 | 10.000 | 19.800 | -0.91 | ||||||||||
| G185 | 10.000 | 6.500 | -1.08 | -1.19 | |||||||||
| G190 | 10.000 | -1.96 | |||||||||||
| G222 |
Note. — All ages are in Gyr.
| Blue CN | Red CN | Break CN | Entire CN | Blue Full | Red Full | Break Full | Entire Full | Min Lit | Max Lit | ||
|---|---|---|---|---|---|---|---|---|---|---|---|
| ID | Loc | Spec Age | Spec Age | Spec Age | Spec Age | Spec Age | Spec Age | Spec Age | Spec Age | Age | Age |
| NGC 1466 | LMC | 0.004 | 20.000 | 0.004 | 20.000 | 4.000 | 1.500 | 8.000 | 2.000 | 13.1 | 13.1 |
| NGC 1783 | LMC | 0.010 | 1.500 | 9.000 | 1.500 | 6.000 | 1.200 | 20.000 | 1.200 | 0.200 | 1.548 |
| NGC 1831 | LMC | 1.200 | 0.600 | 1.000 | 0.800 | 0.400 | 0.200 | 1.000 | 0.400 | 0.190 | 0.501 |
| NGC 1847 | LMC | 0.001 | 0.040 | 0.040 | 0.020 | 0.080 | 0.040 | 0.040 | 0.040 | 0.016 | 0.021 |
| NGC 1856 | LMC | 0.040 | 0.600 | 0.040 | 0.800 | 0.600 | 1.200 | 0.200 | 0.400 | 0.120 | 0.151 |
| NGC 1866 | LMC | 0.004 | 1.200 | 0.060 | 0.200 | 0.100 | 0.800 | 0.200 | 0.600 | 0.080 | 0.302 |
| NGC 1868 | LMC | 0.008 | 0.400 | 2.000 | 3.000 | 0.200 | 1.500 | 2.000 | 0.800 | 0.330 | 0.933 |
| NGC 1978 | LMC | 0.004 | 20.000 | 10.000 | 4.000 | 4.000 | 20.000 | 10.000 | 9.000 | 2.200 | 2.570 |
| NGC 2004 | LMC | 0.002 | 0.020 | 0.004 | 0.010 | 0.020 | 0.004 | 0.010 | 0.010 | 0.008 | 0.028 |
| NGC 2070 | LMC | 0.004 | 18.000 | 10.000 | 0.060 | 0.008 | 0.400 | 0.004 | 0.006 | ||
| NCG 2157 | LMC | 0.001 | 1.200 | 0.040 | 0.040 | 0.100 | 1.000 | 0.060 | 0.400 | 0.030 | 0.030 |
| NGC 330 | SMC | 0.001 | 0.020 | 0.020 | 0.004 | 0.040 | 0.004 | 0.040 | 0.040 | 0.007 | 0.025 |
| NGC 419 | SMC | 0.010 | 2.000 | 3.000 | 1.500 | 0.200 | 3.000 | 3.000 | 20.000 | 0.670 | 1.950 |
Note. — All ages are in Gyr. Fitting ranges are: Blue = 4000 Å, Red = 4000 Å, Break = 3750-4250 Å, Entire = full available range.