Galactic dust clouds are shining in scattered H light
Abstract
Bright emission nebulae, or HII regions, around hot stars are readily seen in H light. However, the all-pervasive faint H emission has only recently been detected and mapped over the whole sky. Mostly the H emission observed along a line of sight is produced by ionised gas in situ. There are, however, cases where all or most of the H radiation is due to scattering by electrons or dust particles which are illuminated by an H emitting source off the line of sight. Here we demonstrate that diffuse, translucent and dark dust clouds at high galactic latitudes are in many cases observed to have an excess of diffuse H surface brightness, i.e. they are brighter than the surrounding sky. We show that the majority of this excess surface brightness can be understood as light scattered off the interstellar dust grains. The source of incident photons is the general Galactic H background radiation impinging on the dust clouds from all over the sky.
1 Introduction
Although in most instances the H emission observed along a line of sight is produced by ionised gas in situ there are cases where part or all of it is due to scattering. In our Milky Way the H line radiation from the bright ionised regions in the mid-plane of the Galaxy is scattered off the widely distributed dust and gives rise to a diffuse H intensity (Jura, 1979; Wood & Reynolds, 1999). Early attempts by Reynolds et al. (1973) to detect the scattered H light in high latitude dust clouds have not been successful.
Localised interstellar dust clouds, especially small size globules, are frequently found as dark patches against the bright H background in HII regions (Bok & Reilly, 1947). However, the opposite phenomenon of “bright dark nebulae” should also be observable because of the scattered H light. This situation is expected to occur when a dust cloud is projected towards a faint H background at high galactic latitudes. In this letter we show that the all-sky H map (Finkbeiner, 2003) reveals the presence of numerous such clouds. Depending on the location of the ionised H emitting gas along the line of sight, i.e. the proportion of gas in front of vs. behind the dust cloud, the cloud may actually appear brighter, darker or neutral relative to its surrounding H surface brightness.
2 Observational data
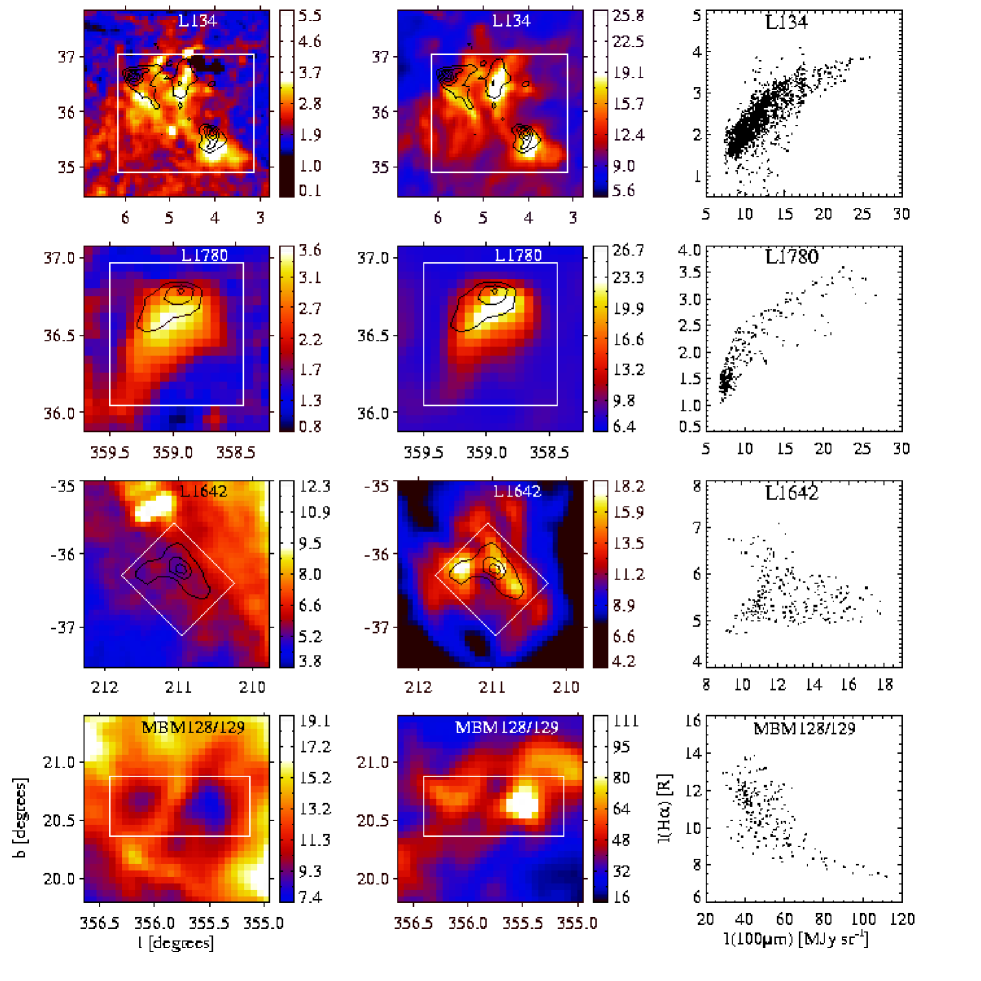
Using the all-sky H map (Finkbeiner, 2003) we have surveyed a sample of high and intermediate galactic latitude clouds listed in the catalogs of Magnani et al. (1985) and Reach et al. (1998) and visible in IRAS 100 m maps. We have found several clouds with an excess H surface brightness but also cases where the cloud appears in absorption or even cases with neither “emission” nor “absorption” even though the dust column density would predict a clear effect. A list of high galactic latitude clouds with an H excess probably caused by scattering includes the following objects: the Lynds clouds L 79, L 134/169/183 complex, L 1407, L 1495, L 1532, L 1660, L 1780, the MBM objects (Magnani et al., 1985) MBM 16, MBM 46, MBM 137, MBM 145, and the diffuse infrared clouds (Reach et al., 1998) DIR 002+31, DIR 046+37, DIR 340-43. In Figure 1 we display the H and 100 m images for a selection of four high galactic latitude clouds together with the scatter diagrams of H intensity vs. 100 m intensity.
The detected excess emission is in the range of 1 to 3 rayleigh (R) which, when compared with the average all-sky H surface brightness of 8 R, suggests that scattering can be the source of this phenomenon. The morphological appearance of the H intensity distribution is very similar to the dust distribution as revealed by the IRAS 100 m images (Fig. 1) and optical extinction maps. The scatter plots of vs. (Fig. 1 right panel) and vs. (Fig. 2 left panel) show for the clouds L134/L183 and L1780, which have low background H intensity, a functional dependence characteristic of scattered light: first a linear increase in the optically thin domain, mag, and a gradual saturation for the larger optical thicknesses. Other clouds, appearing in “absorption” rather than in “emission” (Fig. 1 d; Fig. 2 c-e), can also be readily understood as combination of H scattering and extinction of H emission from beyond the cloud’s distance.
The intensity of the H radiation along the line of sight towards an obscuring and scattering dust cloud at a distance , with the optical depth at 6563 Å , and with a geometrical depth through the cloud much smaller than the distance , can be expressed as
(1)
whereas in the surroundings of the cloud the intensity is
(2)
and the difference is
(3)
Thus, depending on the absolute values of the two terms on the right hand side the cloud’s H surface brightness can be higher, lower, or equal to its surroundings.
The concept of H scattering is tested by comparing the observed H surface brightness with predictions of radiative transfer models. We consider a spherical model cloud which is illuminated by the H Interstellar Radiation Field (ISRF).
3 Radiative transfer modeling
The simulations of scattered H intensity were performed with Monte Carlo methods (Juvela & Padoan, 2003; Juvela, 2005; Mattila, 1970) using peel-off (Yusef-Zadeh et al., 1984) methods to improve the sampling of the outcoming scattered radiation. The intensity of the background sky illuminating the model cloud was obtained from the WHAM survey (Haffner et al., 2003) as function of radial velocity. The missing southern sky was filled in by mirroring the data with respect to the Galactic longitude. The density distributions of the spherically symmetric model clouds were calculated according to the Bonnor-Ebert solution (Bonnor, 1956; Ebert, 1957) of hydrostatic equilibrium with temperature 12 K and the nondimensional radius parameter = 7.0. The sizes and masses of the clouds were fixed by the visual extinction through the cloud centre. Dust properties were based on Draine’s (2003) ‘Milky Way Dust’ model.
During each run, photons of a single frequency were simulated and the scattered intensity, including multiple scatterings, was registered as an image of the cloud toward the observer. The full H profile was covered at steps of 5 km/s. The direction of the observer was determined by the actual galactic coordinates of the cloud in question. This way, although the model clouds themselves are spherically symmetric, the anisotropic radiation field can produce asymmetrical surface brightness distributions. The resulting images of scattered H intensity consist of 2121 independent pixels. The Monte Carlo noise, i.e., the rms-variation of pixel values is about 1%.
The WHAM survey gives the distribution of the H emission as seen from the Earth. Although our sources are relatively nearby objects, the distribution of the sky brightness, as seen from their location, can be different. In particular, part of the H emission seen toward a cloud at a distance of may, in fact, reside between the cloud and us. Therefore, we have also examined scenarios, where a given fraction of the H emission seen in an area of the sky toward and around the cloud is assumed to emanate in front of it. Thus, the H intensity is divided into the components and (see Eqs. 1 and 2). As seen from the cloud’s location the emission component is moved to the opposite part of the sky. This modification is applied to a region within 45 degrees of the direction towards the cloud where the fraction is subtracted from . The modification is taken into account as an additional light source in the opposite part of the sky when simulating the scattering of H radiation. The surface brightness component is not attenuated by extinction in the cloud.
The H surface brightness behind the cloud, , was originally set equal to the value observed in the direction of the cloud in the WHAM-survey. However, the resolution of that survey is only one degree, and the surface brightness can have large variations within each WHAM beam. Of course, the WHAM value also includes the object under consideration whereas in the modeling we need a value for the background without the foreground source. Therefore, the background sky brightness was adjusted so that its level corresponded to the background value observed in the higher resolution H map (Finkbeiner, 2003).
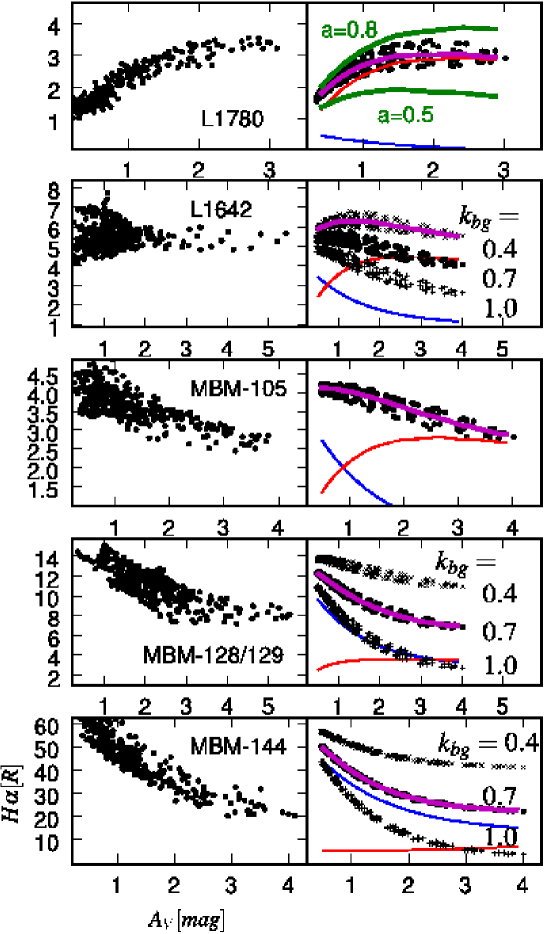
We examine in more detail the H surface brightness of the clouds L 1780, L 1642, MBM 105, MBM 128/129, and MBM 144. The clouds were modeled as Bonnor-Ebert spheres such that the range of extinction corresponded to the observed values. There is only one free parameter that can be adjusted in order to find the best correspondence between observed and modeled H intensities, namely the fraction , , of the background H intensity that resides behind the source, i.e. . The remainder, , comes from the medium between the cloud and the observer. Figure 2 shows the observed and modeled surface brightness as function of visual extinction for four clouds.
In the case of L 1780 the surface brightness can be explained purely as scattered radiation. For the dust model (Draine, 2003) used here the albedo is and the scattering function is moderately forward directed with an asymmetry parameter at the wavelength of the H line. In L 1642 neither an H excess nor absorption was observed. This can be explained by means of a suitable fraction of the H emission coming from the medium behind the cloud. In that case the scattered light from the cloud is compensated by the attenuation of the background emission, . As a result, the surface brightness variations remain very small. With the model predicts a total variation of only 1 R (see Fig. 2b). In MBM 105, because of the higher background level, the intensity decreases with . The intensity towards the cloud centre is determined almost purely by the scattering. In MBM 128/129 and MBM 144, with an even higher background intensity, the importance of scattering decreases and the observations trace mostly the extinguished background H emission. When a value is used, i.e., when some 30% of the diffuse H emission is assumed to originate in front of the clouds, the models are in good agreement with the observations (see Figs. 2c and 2d).
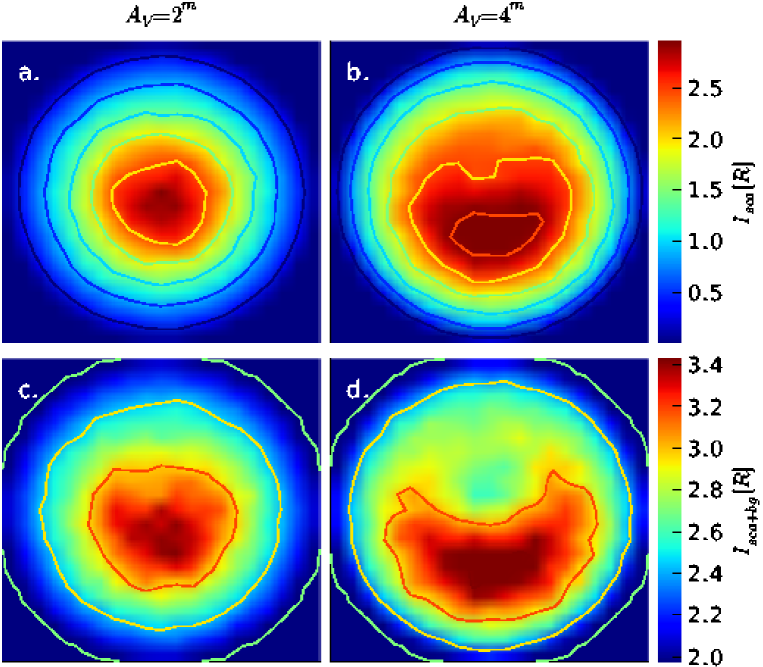
Our model clouds are spherically symmetric. However, the impinging H radiation field is anisotropic. This means that the intensity of the scattered light, as observed over the cloud’s face, is no longer spherically symmetric. The scattered light was registered as two-dimensional maps over the cloud’s face. As an example, we show in Figure 3 the calculated surface brightness maps for L 1780. The asymmetry is quite noticeable at . The lower frames show predictions for the actual total surface brightness where the attenuated background component has been added. Although this component is spherically symmetric it accentuates the asymmetry of the scattered light by reducing the total range of surface brightness values. The intensity maximum is clearly displaced towards the south, i.e. towards the stronger radiation coming from the direction of the Galactic plane.
4 Discussion
As shown in Figure 2 a the values of and , valid for the dust model (Draine, 2003) used in this study give a good agreement between the observed and calculated scattered light intensities for L 1780. The difference can be easily explained, apart from a higher albedo value, by a slightly higher intensity of the H radiation field at the location of the cloud, a value , or inhomogeneity of the cloud that would in the cloud centre cause a higher ratio between scattered intensity and the line-of-sight optical depth. For a given cloud direction a range of () combinations can reproduce the observed scattered light intensity.
The asymmetry of the H intensity distribution is readily seen in the observations of L 1780 and L 183: the H intensity maximum is displaced toward the Galactic plane relative to the peak of the dust column density maximum (see Figs. 1a,b). This shift is 8 arc min in the case of L 1780.
No other mechanisms except scattering are needed to explain the faint H excesses of 1-3 R as observed in high latitude translucent dust clouds. The high latitude clouds are exposed to the ionising Lyman continuum photons which escape from HII regions around O and early B type stars near the Galactic plane. The H in situ emission expected from off-the-plane clouds has been estimated using empirical data for the distribution of hot stars and the intervening dust extinction (Bland-Hawthorn et al., 1998; Bland-Hawthorn & Maloney, 1999a, 2002; Putman et al., 2003). For nearby clouds, pc, the expected H surface brightness is R. On the cloud surface facing the Galactic plane a thin layer of ionised hydrogen will form. Its thickness is 10-2 pc/ which for an assumed hydrogen density in the cloud’s outer layers of cm-3 corresponds to 5 10-4 - 5 10-3 pc. Morphologically, such a thin H+ surface layer would be observed on the side facing the Galactic plane as uniformly distributed surface emission with no correlation with the dust column density, and as a thin bright rim around the cloud’s edge. However, the angular thickness of such a bright rim would be of the order 1 - 10 arc seconds and could not be discerned by the present lower resolution data for L 1780, the L 134 complex (Figs. 1a,b), and other similar clouds.
The conclusion by del Burgo & Cambrésy (2006) that the main mechanism for producing the H excess in L 1780 is the ionisation by an enhanced cosmic ray flux is not supported by our findings. However, some part of the emission could still come from such a process.
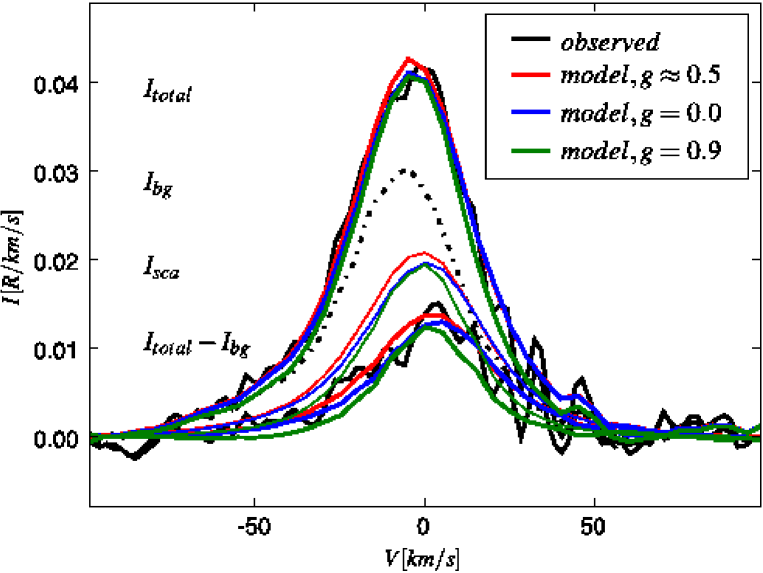
An important aspect of the scattered H line radiation as compared with the continuum radiation is the velocity information it carries both on the source of the impinging ISRF light as well as on the scattering dust particles (Bland-Hawthorn & Maloney, 1999b). Figure 4 shows an example of the observed H scattered light line profile. L 1780 shows an excess line profile centered at 1 km/s which differs from the mean velocity of the in situ H emission in the surroundings of the cloud, -7 km/s. This is as expected since (1) the length of the velocity vector of the cloud itself is probably not much larger than its radial velocity component, km/s, and (2) the impinging ISRF radiation as integrated over the whole sky, has a mean velocity of -1 km/s. Model calculations as function of velocity of the impinging H radiation have been performed for L 1780. We have adopted three different scattering functions ranging from isotropic () to a strongly forward directed one (). While all the calculated scattered light line profiles have closely the same mean velocity the line width is smaller for the forward scattering as compared to the isotropic scattering case. In the latter case the cloud “sees” with equal weighting the whole sky, with impinging H velocities ranging from -50 to +50 km/s. The differences are, however, too small to allow a distinction between the different values of (see Fig. 4).
References
- Bland-Hawthorn et al. (1998) Bland-Hawthorn, J., Veilleux, S., Cecil, G. N., Putman, M. E., Gibson, B. K., & Maloney, P. R. 1998, MNRAS, 299, 611
- Bland-Hawthorn & Maloney (1999a) Bland-Hawthorn, J., & Maloney, P. R. 1999a, ApJ, 510, L33
- Bland-Hawthorn & Maloney (1999b) Bland-Hawthorn, J., & Maloney, P. R. 1999b, ASP Conf. Ser. 166: Stromlo Workshop on High-Velocity Clouds, 166, 212
- Bland-Hawthorn & Maloney (2002) Bland-Hawthorn, J., & Maloney, P. R. 2002, in ASP Conf. Ser. 254, Extragalactic Gas at Low Redshift, ed. J.S. Mulchaey, & J.T. Stocke (San Francisco: ASP), 267
- Bok & Reilly (1947) Bok, B. J., & Reilly, E. F. 1947, ApJ, 105, 255
- Bonnor (1956) Bonnor, W. B. 1956, MNRAS, 116, 351
- del Burgo & Cambrésy (2006) del Burgo, C., & Cambrésy, L. 2006, MNRAS, 368, 1463
- Draine (2003) Draine, B. 2003, ApJ, 598, 1017 (for tabulated material, see http://www.astro.princeton.edu/draine/dust/)
- Ebert (1957) Ebert, R. 1957, Zeitschr. Astrophysik, 42, 263
- Finkbeiner (2003) Finkbeiner, D. P. A. 2003 ApJS, 146, 407
- Górski et al. (2005) Górski, K.M. et al., 2005, ApJ, 622, 759 (http://healpix.jpl.nasa.gov)
- Haffner et al. (2003) Haffner, L.M. et al., 2003, ApJS, 149, 405
- Jura (1979) Jura, M. 1979 ApJ, 227, 798 Juvela, M., & Padoan, P. 2003, A&A, 397, 201
- Juvela (2005) Juvela, M. 2005, A&A, 440, 531
- Juvela et al. (2002) Juvela, M., Mattila, K., Lehtinen, K., Lemke, D., Laureijs, R., & Prusti, T. 2002, A&A, 382, 583
- Juvela & Padoan (2003) Juvela, M., & Padoan, P. 2003, A&A, 397, 201
- Lehtinen et al. (2004) Lehtinen, K., Russeil, D., Juvela, M., Mattila, K., & Lemke, D. 2004, A&A, 423, 975
- Lombardi & Alves (2001) Lombardi, M., & Alves, J. 2001, A&A, 377, 1023
- Magnani et al. (1985) Magnani, L., Blitz, L., & Mundy, L. 1985, ApJ, 295, 402
- Mattila (1970) Mattila, K. 1970, A&A, 9, 53
- Miville-Deschênes & Lagache (1999) Miville-Deschênes, M.-A., & Lagache, G. 2005, ApJS, 157, 302 (Maps are available at http://www.cita.utoronto.ca/mamd/IRIS)
- Putman et al. (2003) Putman, M. E., Bland-Hawthorn, J., Veilleux, S., Gibson, B. K., Freeman, K. C., & Maloney, P. R. 2003, ApJ, 597, 948
- Reach et al. (1998) Reach, W. T., Wall, W. F., & Odegard, N. 1998, ApJ, 507, 507
- Reynolds et al. (1973) Reynolds, R. J., Scherb, F., & Roesler, F. L. 1973, ApJ, 185, 869
- Ridderstad et al. (2006) Ridderstad, M., Juvela, M., Lehtinen, K., Lemke, D., & Liljeström 2006, A&A, 451, 961
- Wood & Reynolds (1999) Wood, K., & Reynolds, R. J. 1999, ApJ, 525, 799
- Yusef-Zadeh et al. (1984) Yusef-Zadeh F., Morris M., & White R.L. 1984, ApJ, 278, 186