INTEGRAL Observations of SS433: Analysis of Precessional and Orbital X-ray Periodicities
Abstract
Hard X-ray INTEGRAL observations of SScarried out during 2003-2005 years are presented. Analysis of precessional and orbital variability is presented. The width of X-ray eclipse in the keV range at the precessional phase (accretion disk is open to observer) is higher than that in the Ginga keV range. This fact suggests existance the presence of hot extended corona around the supercritical accretion disk. Spectrum of hard X-rays in the range keV does not change with the precessional phase which also suggests that hard X-ray flux is generated in the hot extended corona around the accretion disk. The parameters of this hot corona are: keV, . Mass ratio estimated from the analysis of the ingress part of the eclipse light curve is in the range .
1 Introduction
SSis a massive eclipsing X-ray binary with precessing supercritical accretion disk and relativistic jets. Narrow collimated relativistic jets () are precessing with the period . Orbital period is (Gor98 ). There are problems with optical classification of the determination of its radial velocity curve (Gies02 , Hillwig04 , Cher04 , Cher05 , Barnes05 ). This unique X-ray binary at an advanced evolutionary stage has been investigated in optical, radio and X-ray ranges (see review of Fabrika Fab04 and references therein).
First INTEGRAL observations of SSin hard X-rays gave a surprise: SSis a hard X-ray source with emission clearly detected up to keV. We concluded that SSis a supercritical microquasar with hard X-ray spectrum (Cher03 ). SSwas observed by INTEGRAL in A01-A03 from 2003 to 2005.
2 Observations and data reduction
In this work all publically avaliable data on SSobtained by INTEGRAL from March, 2003 to November, 2004 (AO-1,2) and the results of our pointed observations at October 12-22, 2005 (AO-3) are presented.
The data reduction was performed by the Offline Science Analysis (OSA) software version 5.1, developed by the INTEGRAL science data center (ISDC, http://isdc.unige.ch Cour03 ).
The light curves where reconstructed by processing all the available observations, obtained by the ISGRI/IBIS detector in the keV energy band. The light curve points where taken from the mosaic images integrated by each 10 ScW (Science Windows) with a standard background approximation procedure. Thus, a typical exposition time for each light curve point is ksec.
The variability analysis is based on the precessional and orbital ephemeris of SSby Fab04 . The orbital minima:
and the maximal emission lines separation moments:
where and are the orbital and precession cycle numbers respectively.
During the 3 years of INTEGRAL observations (2003-2005) cover a wide range of the precession phases of SS. The three observation sets of AO-1 are performed at (incontiunosly), (continuosly); AO-2: (incontinuously), (continuously), (continuously); AO-3: . The time distribution of these observations is displayed in Fig.1. The moments are indicated by squares and the closest orbital minima – by triangles.

3 Precessional variability
The keV light curve composed from all the available ISGRI/IBIS observations of SSfolded with the precessional period is displayed in Fig. 2.
The face-on disk position () defined as the maximim of the optical emission lines separation is taken as the moment of zero precession phase. The upper and lower panels of Fig. 2 display the X-ray flux (mCrabs) out of eclipse of the X-ray source by the normal star and in the middle of the eclipse, respectively.
Fig. 2 shows that the flux out of eclipse is varies from mCrab (crossover phase) to mCrab ( phase). The flux in the middle of eclipse (primary minimum) has no significant variablity, staying at average near mCrab.

4 Orbital eclipse variability
Fig. 3 displays the shape of the eclipses of SSX-ray source by the normal component in the energy band keV observed in different phases of the period of precession. The eclipse at is obtained by folding of all the available light curves in the phases (JD 2452770-2453270).
The eclipse depth is maximal at and decreases with the phase of precession. This seen clearly for individual eclipse light curves for (first crossover), (some later than the second crossover), and (see Fig. 3). The dotted line at the figure indicate the moments of the primary minimum.
The good correspondence between X-ray minima with the optical ephemeris for the precession phases close to as well as the delay of the X-ray light curve after the optical one at should be specially noted.
| Model | (keV) | Normalization | Reduced | ||
|---|---|---|---|---|---|
| hemisphere | – | 1.08 (5 d.o.f.) | |||
| slab | 0.5 | 1.06 (5 d.o.f.) |

5 Eclipse in the phase

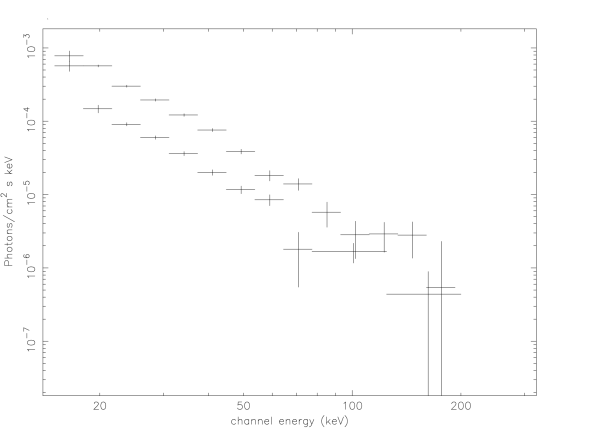
Fig. 4 displays the eclipse light curves in the band keV obtained by INTEGRAL in comparison with the keV light curves obtained by Ginga (GingaObs ), denoted below as hard and soft bands.
Evidently, the eclipse width in the hard band is greater than in the soft one. This seems unexpected because such behaviour is inverse to that in regular X-ray binaries where the X-ray eclipse width decreases in harder band.
The ascending part of the eclipse in the Ginga data is disturbed, probably, by the light absorption by the accretion flows. Some distortions at the same phases can be noticed also in the hard band data.
The phase of the excess point inside the eclipse is coincident with the local maximum on the Ginga light curve.
To avoid the influence of the accretion flows, we analyze only the descending part of the eclipse, which can be considered as corresponding to the pure geometrical eclipse by the normal component body.
6 Spectral analysis
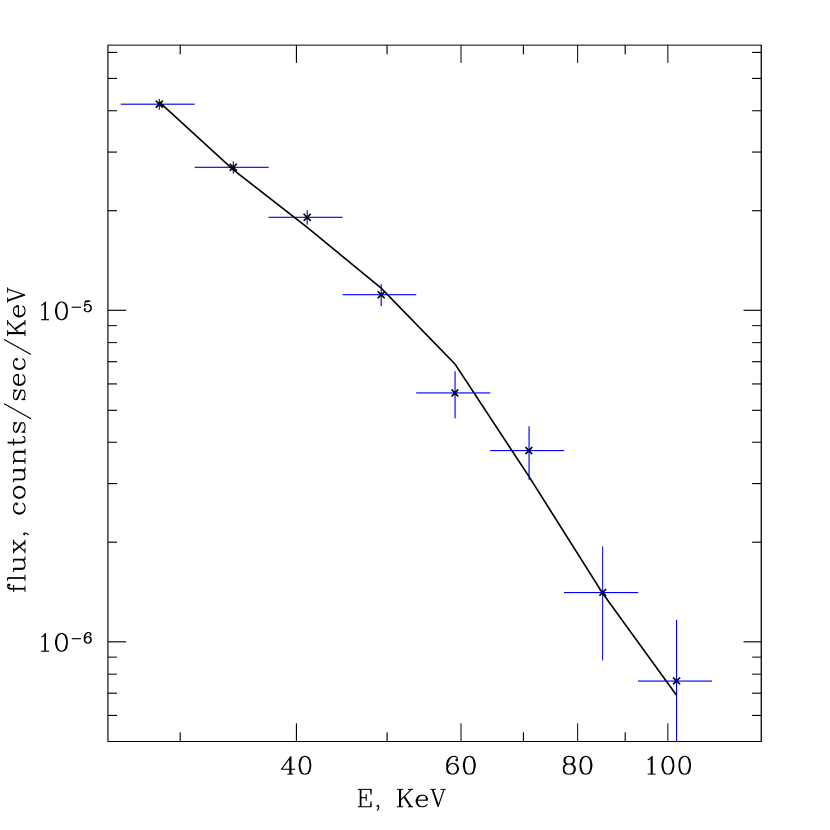
For spectral analysis, we separated all available observations into two parts: below the mean X-ray flux (around 10 mCrab in the 20-50 keV energy range) and above it. The spectra where obtained using the software developed by Revn04 (IKI RAS). No significant difference in the spectral shape was found (see Fig. 5). This suggests a fairly broad region emitting in hard X-rays with size compared to that of the accretion disk, since (apart from orbital eclipses) the observed flux varies due to precession of the disk. The spectral shape of this region in the 20-100 keV range can be fitted by thermal comptonization model (CompPS, Pout96 ). Equally good fits were found for two cloud geometries: (1) a hemisphere with temperature keV and optical thickness for electron scattering , and (2) a slab with keV and (see Fig. 6 and Table 1). In both cases the inclination angle is assumed to be 60 degrees. A blackbody component with keV is added to slightly improve the fits.

This analysis suggests that in addition to thermal X-ray emission from jets (which dominates at smaller energies in the standard X-ray band, see Fil06 and references therein for earlier works), a broad hot corona emitting in hard X-ray exists in SS433 around jets, first discovered by INTEGRAL (Cherepashchuk et al Cher03 , Cher05 ). From the joint analysis of X-ray orbital eclipses and precessional variability presented in this paper it follows that the size of the corona must be comparable with that of the accretion disk ( cm). For the physical parameters obtained from spectral fits the electron denisty around cm-3 can be derived. We note that such a denisty is indeed expected in the wind outflowing from a supercritical accretion disk with M⊙/yr and km/s at distances cm from the center where the photosphere should be formed. The heating of such a corona up to 25 keV can be due to violent interaction of mildly relativistic jets with the surrounding dense wind (Beg06 ).
7 Analysis of orbital and precessional variability
We carried out the joint analysis of orbital eclipses (ingress only) at the precessional phase and of the precessional light curve itself.
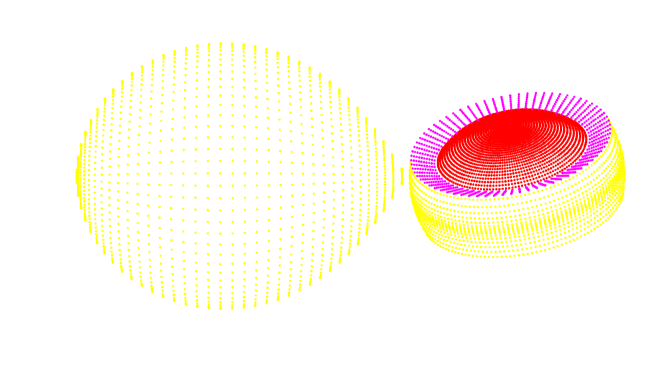
For the analysis of X-ray variability we used a geometrical model of SS433 applied earlier to the analises of Ginga data Ant92 and the INTEGRAL X-ray light curve Cher05 . A close binary system consists of an opaque “normal” star shaped by a Roche equipotential surface and a relativistic object surrounded by an optically and geometrically thick “accretion disk”. The size of the “normal” star is determined by the sizes of the critical Roche lobe for the mass ratio (here is the mass of the relativistic object).
The “accretion disk” includes the disk itself and an extended photosphere formed by the outflowing wind. The disk is inclined with respect to the orbital plane by the angle . The opaque disk body with a central cone-like region (funnel) is described by the radius and the cone opening angle . The accretion disk radius is limited by the distance from its center to the inner Lagrangian point. The relativistic object is surrounded by a transparent homogeneously emitting spheroid with the visible radius and height , which could be interpreted as a “corona” or a “thick jet” (without any relativistic motion).
Only the hot “corona” is assumed to emit hard X-ray flux, while the star and the opaque disk eclipse it during orbital and precessional motion. Physically, such a “corona” could be thought of as hot low dense plasma filling the funnel around the relativistic jets.
During precessional motion the inclination of the disk with respect to the observer changes, causing different conditions of the “corona” visibility. Observed precessional variability can thus be used to obtain a “vertical” scan of the emitting structure, restricting the height and the cone opening angle . The orbital variability (eclipses) allow one to scan the emitting structure “horizontally”, rectricting the possible values of , , and the mass ratio .
The results of the joint analysis of the orbital and precessional variabilities are the following.


From the analysis we conclude that in the framework of our geometrical model of the hard X-ray emitting region in SS433 the eclipse shape (ingress) and the precessional amplitude are best reproduced by a wide oblate “corona” above an optically thick accretion disk.
At any , the best fits for the observed wide orbital eclipse () are obtained for large visible radii of the hot corona just slightly smaller than the disk radius (). The height of the “corona” is about of and the cone opening angle .
The precessional light curve taken alone does not restrict the binary mass ratio : equally good fits are found for varying from to .
Analysis of the orbital X-ray eclipse ingress only (observed at ) shows that in the range of the fit accuracy varies by some only.
Simultaneous analysis of both precessional and orbital variability of SS433 allows one to constrain to the range . The fit is illustrated in Fig. 7 and Fig. 8.
8 Conclusions
Most probably, SScontains a blach hole. The detection of a hot extended corona around the supercritical accretion disk is a new result.
The future plans are connected with a high resolution spectroscopy of SSat the face-on disk phase (planned Subaru observations). The new eclipse observations at in hard X-ray range would confirm the growth of the eclipse width with the photon energy, which would directly evidence the presence of an extended hot corona around the disk. Also the peculiarities of the ascending side of the eclipse are to be studied. These tasks are planned to be done by the INTEGRAL observations in May 2007.
Acknowledgments
This work was partially supported by RFBR grants 06-02-16025 and 05-02-17489.
References
- (1) Goranskii, V.P., Esipov, V.F., Cherepashchuk, A.M., 1998, Astron. Reports, 42, 209
- (2) Gies, D.R., Huang, W., McSwain, M.V., 2002, ApJ 578, L67
- (3) Hillwig, T.C., Gies, D.R., Huang, W., et al 2004, ApJ 615, 422
- (4) Cherepashchuk, A.M.Sunyaev, R.A., Fabrika, S.N. et al, 2004 Proceedings of the 5th INTEGRAL Workshop on the INTEGRAL Universe (ESA SP-552). 16-20 February 2004, Munich, Germany. Scientific Editors: V. Schönfelder, G. Lichti & C. Winkler, p.207
- (5) Cherepashchuk, A.M., Sunyaev, R.A., Fabrika, S.N., Postnov, K. A., Molkov, S. V., et al, & Aph. 2005, 437, 561
- (6) Barnes, A.D., Casares, J., Charles, P.A., Clark, J.S., Cornelisse, R., Knigge, C., Steeghs, D., 2005, MNRAS, (astro-ph/0510448)
- (7) Fabrika, S.N., 2004, Astrophys. Space Phys. Rev. 12, 1
- (8) Cherepashchuk, A.M., Sunyaev, R.A., Seifina, E.V., Panchenko, I. E., Molkov, S. V., Postnov, K. A. 2003, Astron. & Aph. 411, L441
- (9) Courvoisier T.J.-L., Beckmann V., Bourban G., et al. 2003, Astron. & Aph., 411, L53
- (10) Kawai N. and Matsuoka M., 1989, Publ. Astron. Soc. Japan, 41,491
- (11) Revnivtsev M.G., Sunyaev R.A., Varshalovich D.A et al., PaZh, 2004 30, 430
- (12) J. Poutanen, R. Svensson, 2006, ApJ, 470, 249
- (13) Filippova, E., Revnivtsev, M., Fabrika., S., Postnov, K., Seifina, E. 2006, Astron. & Aph., in press. astro-ph/0609367
- (14) Begelman, M.C., King, A.R., Pringle, J.E. 2006, MNRAS, 370, 399
- (15) Antokhina, E.A., Seifina, E.V., Cherepashchuk, A.M., 1992, Astron. Zh, 69, 282