Resolving the inner dust disks surrounding LkCa 15 and MWC 480 at mm wavelengths ††thanks: Based on observations carried out with the IRAM Plateau de Bure Interferometer. IRAM is supported by INSU/CNRS (France), MPG (Germany), and IGN (Spain).
Abstract
Aims. We constrain the dust distribution and its properties (temperature, emissivity) in inner proto-planetary disks
Methods. We performed sub-arcsecond high-sensitivity interferometric observations of the thermal dust emission at 1.4 mm and 2.8 mm in the disks surrounding LkCa 15 and MWC 480, with the new 750 m baselines of the IRAM PdBI array. This provides a linear resolution of AU at the distance of Taurus.
Results. We report the existence of a cavity of AU radius in the inner disk of LkCa 15. Whereas LkCa 15 emission is optically thin, the optically thick core of MWC 480 is resolved at 1.4 mm with a radius of AU, constraining the dust temperature. In MWC 480, the dust emission is coming from a colder layer than the CO emission, most likely the disk mid-plane.
Conclusions. These observations provide direct evidence of an inner cavity around LkCa 15. Such a cavity most probably results from the tidal disturbance created by a low-mass companion or large planet at AU from the star. These results suggest that planetary system formation is already at work in LkCa 15. They also indicate that the classical steady-state viscous disk model is too simplistic a description of the inner 50 AU of “proto-planetary” disks and that the disk evolution is coupled to the planet formation process. The MWC 480 results indicate that a proper estimate of the dust temperature and size of the optically thick core are essential for determining the dust emissivity index .
Key Words.:
Stars: circumstellar matter – planetary systems: protoplanetary disks – individual: LkCa 15, MWC 480 – Radio-continuum: stars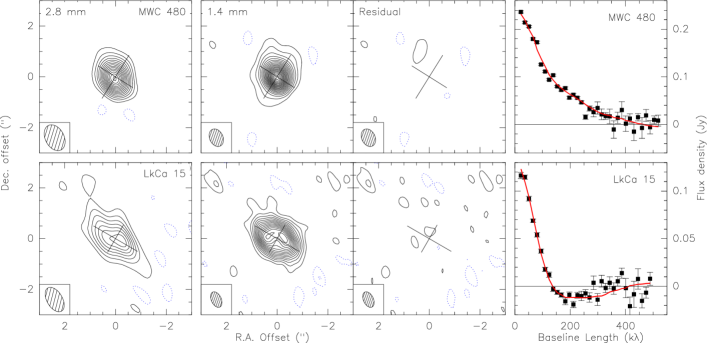
1 Introduction
With current instrumentation, proto-planets located at the distance of Taurus cannot be observed directly. The best evidence of planet formation in proto-planetary disks remains the detection of the tidal gaps. Because of the dependence of the dust temperature on the distance from the star, these gaps should leave signatures in the infrared SED of the objects, in the form of a deficit of emission at wavelengths between 1 and 30 m. Koerner et al. (1993) suggest that the deficit of emission at 10 m in GM Aur was indeed the result of such a gap. Many recent studies of the spectral energy distribution (SED) in the near-infrared (NIR) and mid-infrared (MIR) coming from data obtained by various telescopes, in particular from the Spitzer satellite, have revealed NIR-MIR emission dips that can be interpreted by truncated disks with inner radii of AU up to 25 AU (Calvet et al., 2005). Some direct evidence of inner cavities has been also obtained in the scattered light images of the disks of moderate opacity associated with Herbig Ae stars such as HD141569 (Augereau et al., 1999). More recently, a large inner radius (70 – 100 AU) was measured in the mm domain for the dense spiral-like structure found in AB Auriga (Piétu et al., 2005).
However, models of planet formation predict gaps with density contrasts of only 10-100 for a Jupiter-like planet (e.g Crida et al., 2006). Due to the very high dust opacity observed in the IR (at m, assuming standard dust grain properties, the opacity can be as high as , see D’Alessio et al. 1998), the IR SED does not allow astronomers to get detailed knowledge on the moderate density contrasts. This can be qualitatively understood in Fig.5 in Dullemond et al. (2001), where a change in the slope of 1 on the dust surface density does not significantly affect the SED (by less than 20 %), which is therefore difficult to disentangle from the other physical effects on real data.
As a consequence, only gaps corresponding to a significant decrease in the surface density in the inner disk, i.e. a transition in opacity between thick and thin regimes, can be detected in the modelling of the IR SEDs. Only resolved images obtained with a tracer of moderate opacity can provide reliable insights into the geometrical structure and density contrasts when the inner cavities are not significantly empty. The dust opacity of proto-planetary disks in the millimeter/sub-millimeter range is well adapted to imaging such “young” cavities, provided enough angular resolution and sensitivity is available.
In this paper, we present new PdBI observations at an angular resolution of for the Keplerian disks surrounding two bona-fide single PMS stars LkCa 15 and MWC 480. LkCa 15 is a classical TTauri star of spectral type K5, mass , and age Myr and MWC 480 is a Herbig Ae star of spectral type A4 and age Myr (Simon et al., 2000).
2 Observations and results
The observations were performed from winter 2001 to winter 2005. We observed simultaneously at 110 and 220 GHz (2.8 and 1.4 mm). Typical system temperatures range from 200 to 400 K at 220 GHz. We mainly used 4 configurations: the standard BCD configuration of the IRAM array, with (projected) baselines ranging from 15 m to 320 m, and the new A+ configuration, which provides baselines extending up to 750 m. Some additional data were obtained on MWC 480 in A configuration, using time sharing with AB Aur (see Piétu et al., 2005). The data were obtained under good weather conditions: the rms phase did not exceed at 1.4 mm even on the longest baselines. The two sources were observed in track-sharing mode, alternating every 10 minutes from one source to the other. For the BCD configurations, we calibrated the data using the standard method, with MWC 349 as a reference for flux calibration. On the longest baselines, MWC 349 is partially resolved at 1.4 mm, and a different method was required for the flux calibration. We first based our flux scale on an extrapolation in time of the flux densities of the two phase calibrators, 0415+379 (i.e. 3C111) and 0528+134. However, since quasars have unpredictable flares, we also compared the measured flux density of MWC 480 obtained from the BCD data to that obtained in the A+ data on the overlapping baseline range (from 100 to 400 m). MWC 480 is bright and compact enough to allow such a direct comparison, to a precision of %. The two methods give the same results within 5 %. The simultaneous observation and common calibration ensure that any morphological or intensity difference observed between the two sources is real and not due to instrumental artifacts.
At 220 GHz, these observations provide an angular resolution about using natural weighting. With uniform weighting, the longest baselines (500 k) allow us to reach an angular resolution of about at PA . At 110 GHz, the resolution is a factor lower. Based on the integration time, system noise, and measured efficiencies, the expected (thermal) noise level was 0.7 mJy/beam at 220 GHz. However, the dynamic range is limited by phase noise. This results in an effective noise of 0.9 mJy/beam for LkCa 15 and 2.0 mJy/beam for MWC 480. At 110 GHz, the noise is 0.3 mJy/beam, so essentially thermal.
Figure 1 presents the images obtained at 2.8 mm and 1.4 mm on MWC 480 and LkCa 15. While the disk of MWC 480 appears centrally peaked, the disk around LkCa 15 does not. The 1.4 mm image of LkCa 15 is rather similar to the first image of GG Tau (Dutrey et al., 1994, see their Fig.1) where the inner radius of the circumbinary dust ring was just resolved by the interferometer. The total flux densities at 2.8 and 1.4 mm are mJy and mJy, respectively, for LkCa 15, corresponding to an apparent spectral index of . For MWC 480, S mJy and S mJy, leading to . The calibration uncertainties result in an additional error of on the absolute values of , but the relative values are not affected, since the data were obtained simultaneously. Figure 1 also shows the residual images after subtraction of the best-fit model (see Tables 2-3). The rightmost panels of Fig.1 display the real part of circular average of the calibrated visibilities obtained after deprojection, superimposed with the visibilities from the best models (curves). LkCa 15 is well resolved with a first null at 130 k (and probably a second null at 400 k).
3 Data analysis
| from CO | from 2.8 and 1.4 mm | |
| isotopologues | emission | |
| LkCa 15 | ||
| PA (∘) | ||
| (∘) | ||
| MWC 480 | ||
| PA (∘) | ||
| (∘) | ||
| Fixed input parameters | ||
|---|---|---|
| (AU) | [3]a | [3] |
| [0] | [0.5] | |
| Derived parameters from 2.8 and 1.4 mm dust emission | ||
| (K) | ||
| (AU) | ||
| (g.cm-2) | ||
| () | 0.24 | 0.30 |
| () | 0.04 | 0.19 |
The error bars are the formal errors (effective noise, see Sect.2) from the fit. has been fixed to 3 AU. (a) Square brackets indicate fixed parameters.
To better quantify the obvious morphologic differences between both sources, the 2.8 mm and 1.4 mm data were analyzed in the Fourier Plane using our disk fitting method (see Dutrey et al., 2006, and references therein). We modelled an inclined disk with truncated inner and outer radius and power law distribution of the temperature , surface density . Following Beckwith et al. (1990), we used the Hildebrand (1983) prescription for the dust opacity, cm2/g (per gram of dust+gas). We simultaneously fit the 2.8 and 1.4 mm UV data, thereby constraining directly. As shown in Table 1 for both sources, the inclinations and orientation derived from the continuum data agree with those determined from an analysis of the 12CO (Simon et al., 2000) and 13CO observations (for details, see Piétu et al., 2006). We used the more accurate CO-based inclinations in the analysis. For MWC 480 the temperature can be constrained by the dust observations. For LkCa 15, we used the temperature determined by Piétu et al. (2006) from CO lines. We checked that the choice of the scale height does not influence the results at all: we used AU for both sources.
| Temperature from CO isotopologues | ||
|---|---|---|
| (K) | ||
| Derived parameters from 2.8 and 1.4 mm dust emission | ||
| (AU) | [5]a | |
| (AU) | ||
| (g.cm-2) | ||
| () | 0.029 | 0.025 |
The error bars are the formal errors (effective noise, see Sect.2) from the fit. Two solutions are presented: one with a free inner radius, and one with a fixed inner radius of 5 AU. The dust emission is too optically thin to allow us an independent fit of the temperature, which is adopted from the CO analysis presented in Piétu et al. (2006). (a) Square brackets indicate fixed parameters.
For continuum data, the brightness distribution scales in the optically thick case as the temperature , and its exponent , while in the optically thin case, it scales as the product and the sum . Since in general the dust opacity decreases with radius, one can measure both the surface density and the temperature with angular resolution that is high enough.
Table 2 shows the best fits for MWC 480. The large value of the peak surface brightness (7 K in Fig.1) indicates a significant opacity at both wavelengths in the inner AU. Indeed, optical depth reaches unity between AU (model 1) and 38 AU (model 2) at 220 GHz, and between 20 and 23 AU at 110 GHz. We thus attempted to treat the dust temperature as a free parameter. The measurements directly constrain the temperature around AU to be K. However, the optically thick core is not sufficiently resolved to determine the temperature exponent . Table 2 shows two solutions. The data are compatible with a K, or with steeper laws, K, , but not with higher temperatures. The temperature derived from 12CO ( K and ) is much too high to apply to the dust. All solutions intersect near AU with K. The lack of knowledge on the temperature law results in a significant uncertainty in the surface density law, and thus on the total disk mass. With these opacities, the optically thick inner core contributes quite significantly to the total flux, and the dust emissivity index is thus substantially higher than .
For LkCa 15, the surface brightness of the mm emission is low ( K), indicating that the dust is essentially optically thin. It is thus impossible to constrain the dust temperature with this data. On the other hand, an analysis of and by Piétu et al. (2006) provides a unique value for the temperature, and . We adopted these values. With a small inner radius (5 AU, but the result do not change for lower values), the best-fit solution implies , i.e. a surface density increasing with radius. This is physically implausible. Treating the inner radius as a free parameter results in a better fit at the 4 level and a more physical value for (see Table 3). Other combinations of inner, outer radius and density exponent are possible: for example, a solution with , AU and AU (in agreement with the disk extent in CO) is only 2 – 3 above the best-fit solution for LkCa 15. This may indicate that LkCa 15 is not devoid of dust beyond AU, but surrounded by a more tenuous disk. Despite the correlation between and , the LkCa 15 disk exhibits a clear decrease in surface density towards its center, with the best solution indicating a AU radius central hole.
In conclusion, while MWC 480 presents a “classical” dust distribution, LkCa 15 indicates that dust disks can present brightness distributions versus radius that are more sophisticated than simple power laws, and suggests the existence of a large inner cavity in an otherwise “standard” dust disk.
4 Discussion
4.1 MWC 480
MWC 480 was recently observed at 1.4 mm by Hamidouche et al. (2006, hereafter HLM) using the BIMA array, with slightly higher resolution, but lower sensitivity. HLM mention a similar source orientation. They use a temperature derived from the IR SED, K, and . However, because of the IR opacity, the IR-constrained temperature deduced from an isothermal vertical disk model naturally overestimates the mid-plane temperature to which the mm emission is sensitive (see also D’Alessio et al., 1998, for details). Indeed, the temperature used by HLM is much too high to explain our observations, and using it results in a best-fit solution that is worse than those presented in Table 2. HLM also derive a relatively shallow surface density distribution, , as a result of the high assumed temperature. The HLM temperature law requires a low opacity to reproduce the surface brightness (9 K in their Fig.1). As a consequence, the shallow inner-surface-brightness distribution is represented by a flat surface density, while it is in reality due to contribution by the optically thick core. Also, is biased towards low values by the extended emission present in the HLM image, which is not confirmed in ours. This structure may be due to phase errors. Note that in general, phase noise will result in a flattening of the brightness distribution, since it scatters signal (much like an effective seeing).
The value of indicates moderate grain growth. This is similar to the value obtained for AB Aur by Piétu et al. (2005). Using the coronagraphic mode of the HST/NICMOS camera at m, Augereau et al. (2001) observed the disk of MWC 480, but did not detect its scattered light. Their upper limit on the column density of scattering material is g.cm-2 at 100 AU (of dust only), several orders of magnitude below our measured value. Our results suggest that a significant amount of dust is still “hidden” to the scattered light regime, most likely because the dust disk is geometrically thin and the starlight partially masked by the dust orbiting close to the star. This can occur if the dust has significantly settled on the disk-mid plane. This explanation agrees with the classification of MWC 480 as a group II star (Meeus et al., 2001; Acke & van den Ancker, 2004). The constraint on the dust temperature indicates that the dust is colder than the zone traced by the CO isotopologues, in further agreement with this hypothesis. Although indirect, these arguments suggest that the dust has settled towards the disk plane. Table 2 indicates the MWC 480 disk is quite massive. However, this is largely the result of extrapolation of the density and/or temperature laws, as indicated by the total mass beyond 35 AU in Table 2.
MWC 480 illustrates the need to resolve the inner optically thick core and to measure the dust temperature to properly characterize the dust emissivity. Lower-resolution data (Dutrey et al., 1996) typically tend to find values of , and our new results indicate such values could be significantly biased by contamination from optically thick dust at low temperature.
4.2 The inner disk of LkCa 15
Until now, observations from the NIR to the mm range have shown that LkCa 15 is a bona-fide Classical TTauri star surrounded by a large CO disk of a few (Simon et al., 2000; Qi et al., 2003). Leinert et al. (1993) observed LkCa 15 and classified it as a single star, since they found no companion down to a separation of (20 AU).
Bergin et al. (2004) have observed the H2 UV emission and the NIR-MIR SED of LkCa 15. They conclude that the disk has an inner radius (puffed-up inner rim) located at AU. From their disk modelling, they estimate a column density of dust g.cm-2 at 1 AU, assuming a standard accretion disk model with and K. Extrapolated to 45 AU, this translates into 0.07 g.cm-2 of dust+gas (with a gas-to-dust ratio of 100). This is 200 times lower than the surface density from Table 2, confirming the interpretation of the mm images of LkCa 15 as the result of a cavity of radius AU nearly devoid of dust. If we fit a surface density law into the LkCa 15 cavity, we find an upper limit of g.cm-2 at 1 AU, consistent with the results of Bergin et al. (2004).
In the current knowledge of inner-disk destruction processes, among the mechanisms (such as planetary formation, photo-evaporation, radiation pressure, etc…) that can explain this distribution, planetary formation or a low mass companion remain plausible since the LkCa 15 disk is fairly massive. The large disk density makes photo-evaporation and radiation pressure unlikely to be effective. Alexander et al. (2006) showed that when photo-evaporation starts propagating beyond 20 – 30 AU, the surface density near 50 AU is g.cm-2, within a factor of a few to account for different UV fluxes (see their Fig.1). This is 500 times lower than derived from our best fit model in Table 3.
In a viscous disk, a gap can be opened by a planet as soon as the Hill’s radius is larger than the disk height. Following Takeuchi et al. (1996), the half-width of a gap created by a proto-planet or a low-mass companion can be approximated by: where is the semi-major axis of the orbit. The strength ratio of tidal to viscous effects is :
For AU and assuming , , and the mass of the planet , we find and AU. Hence a Jupiter mass planet orbiting at 30 AU would be sufficient to evacuate the inner 50 AU of the LkCa 15 disk.
Getting an upper limit on the orbiting object mass is more difficult. The separation limit from Leinert et al. (1993) is 20 AU, but given the inclination of the LkCa 15 disk, an object orbiting at 30 AU would spend most of its time at projected distances about 20 AU. The best limit on the companion mass comes from the kinematic determination of Simon et al. (2000), who indicate a total mass for the system of . The spectral type of LkCa 15 makes it unlikely to be a star of less than , leaving at most for a companion. A coeval star of this mass would have a K magnitude of about 10.5.
5 Summary
We used the new 750 m baselines of the IRAM array to image the dust disks orbiting MWC 480 and LkCa 15 at an angular resolution of .
-
•
The dust disk of MWC 480 is centrally peaked with an optically thick core of radius AU at 1.4 mm. Since the core is resolved, we can estimate its temperature, which is significantly lower than that of the CO layers, and measure the dust emissivity index . The low dust temperature suggests that grains emitting at mm wavelengths tend to be located around the colder disk mid-plane, in agreement with sedimentation. The index is , suggesting moderate grain growth, like in AB Aur.
-
•
To be compatible with existing NIR images of MWC 480, the dust must be confined to a geometrically thin disk and mostly hidden from the starlight.
-
•
The LkCa 15 disk reveals a large (50 AU radius) cavity, which is not completely devoid of dust. The most probable explanation for such a wide cavity is the existence of a massive planet () or of a low mass companion () orbiting around AU from the star.
Long baselines on large mm/submm arrays are now opening the planetary formation regions of nearby young disks to investigations. However, as for AB Aur, figuring out whether the companion to LkCa 15 is a proto-planet or a low-mass star requires deeper IR images, or the advent of ALMA, which may resolve the structure of the cavity.
Acknowledgements.
We thank the referee for very useful comments. We thank A.Morbidelli and A.Crida for a very helpful discussion of the formation of gaps in disk. We acknowledge M.Simon for discussion of the binarity of LkCa 15 and J.-C.Augereau for considerations of the scattered light image of MWC 480. We thank the Plateau de Bure IRAM staff, especially J.-M.Winters, for their help during the observations. This research was supported by the French Program “Physique Chimie du Milieu Interstellaire” (PCMI).References
- Acke & van den Ancker (2004) Acke, B. & van den Ancker, M. E. 2004, A&A, 426, 151
- Alexander et al. (2006) Alexander, R. D., Clarke, C. J., & Pringle, J. E. 2006, MNRAS, 369, 229
- Augereau et al. (1999) Augereau, J. C., Lagrange, A. M., Mouillet, D., & Ménard, F. 1999, A&A, 350, L51
- Augereau et al. (2001) Augereau, J. C., Lagrange, A. M., Mouillet, D., & Ménard, F. 2001, A&A, 365, 78
- Beckwith et al. (1990) Beckwith, S. V. W., Sargent, A. I., Chini, R. S., & Guesten, R. 1990, AJ, 99, 924
- Bergin et al. (2004) Bergin, E., Calvet, N., Sitko, M. L., et al. 2004, ApJ, 614, L133
- Calvet et al. (2005) Calvet, N., D’Alessio, P., Watson, D. M., et al. 2005, ApJ, 630, L185
- Crida et al. (2006) Crida, A., Morbidelli, A., & Masset, F. 2006, Icarus, 181, 587
- D’Alessio et al. (1998) D’Alessio, P., Canto, J., Calvet, N., & Lizano, S. 1998, ApJ, 500, 411
- Dullemond et al. (2001) Dullemond, C. P., Dominik, C., & Natta, A. 2001, ApJ, 560, 957
- Dutrey et al. (1996) Dutrey, A., Guilloteau, S., Duvert, G., et al. 1996, A&A, 309, 493
- Dutrey et al. (2006) Dutrey, A., Guilloteau, S., & Ho, P. 2006, Protostars and Planets V
- Dutrey et al. (1994) Dutrey, A., Guilloteau, S., & Simon, M. 1994, A&A, 286, 149
- Hamidouche et al. (2006) Hamidouche, M., Looney, L. W., & Mundy, L. G. 2006, ArXiv Astrophysics e-prints
- Hildebrand (1983) Hildebrand, R. H. 1983, QJRAS, 24, 267
- Koerner et al. (1993) Koerner, D. W., Sargent, A. I., & Beckwith, S. V. W. 1993, Icarus, 106, 2
- Leinert et al. (1993) Leinert, C., Zinnecker, H., Weitzel, N., et al. 1993, A&A, 278, 129
- Meeus et al. (2001) Meeus, G., Waters, L. B. F. M., Bouwman, J., et al. 2001, A&A, 365, 476
- Piétu et al. (2006) Piétu, V., Dutrey, A., & Guilloteau, S. 2006, in prep.
- Piétu et al. (2005) Piétu, V., Guilloteau, S., & Dutrey, A. 2005, A&A, 443, 945
- Qi et al. (2003) Qi, C., Kessler, J. E., Koerner, D. W., Sargent, A. I., & Blake, G. A. 2003, ApJ, 597, 986
- Simon et al. (2000) Simon, M., Dutrey, A., & Guilloteau, S. 2000, ApJ, 545, 1034
- Takeuchi et al. (1996) Takeuchi, T., Miyama, S. M., & Lin, D. N. C. 1996, ApJ, 460, 832