Three-dimensional Modeling of Type Ia Supernova Explosions
Abstract
Modeling type Ia supernova (SN Ia) explosions in three dimensions allows to eliminate any undetermined parameters and provides predictive power to simulations. This is necessary to improve the understanding of the explosion mechanism and to settle the question of the applicability of SNe Ia in cosmological distance measurements. Since the models contain no tunable parameters, it is also possible to directly assess their validity on the basis of a comparison with observations. Here, we describe the modeling of SNe Ia as thermonuclear explosions in which the flame after ignition near the center of the progenitor white dwarf star propagates outward in the sub-sonic deflagration mode accelerated by the interaction with turbulence. We explore the capabilities of this model by comparison with observations and show in a preliminary approach, how such a model can be applied to study the origin of the diversity of SNe Ia.
Keywords:
supernovae – turbulence – computer modeling and simulation – hydrodynamics:
97.60.Bw; 98.38.Am; 95.75.-z; 95.30.Lz1 Introduction
Type Ia supernovae (SNe Ia) have become one of the major tools in observational cosmology. Yet a sound theoretical understanding of these objects – justifying in particular the calibration techniques applied in distance measurements – is still lacking. First attempts to model SNe Ia were based on one-dimensional numerical simulations. Such models gave valuable insight into the basic mechanism of SN Ia explosions. However, their predictive power is limited due to the fact that underlying physical processes enter the models in a parametrized way. This is overcome by three-dimensional modeling of SNe Ia (Reinecke et al., 2002a; Gamezo et al., 2003). As an example, we present a model that is derived from the standard scenario of SN Ia explosions (for a review see (Hillebrandt and Niemeyer, 2000)). A white dwarf (WD) consisting of carbon and oxygen is assumed to accrete matter from a non-degenerate binary companion until its mass approaches the Chandrasekhar limit. Due to the rapid increase of the central density nuclear reactions ignite giving rise to a stage of convective carbon burning. This stage lasts for several hundred years and terminates once the nuclear energy production cannot be balanced by convective cooling any longer. Subsequently, a thermonuclear runaway of a small temperature fluctuation ignites a thermonuclear flame. The exact mechanism of flame ignition, however, remains controversial. While some studies suggest a flame ignition in multiple sparks distributed around the center of the WD (Garcia-Senz and Woosley, 1995; Woosley et al., 2004; Iapichino et al., 2006; Kuhlen et al., 2006), others put forward central single-point ignitions (Höflich and Stein, 2002).
After ignition the flame propagation is determined by the laws of hydrodynamics. Regarding the flame front as a discontinuity between fuel and ashes, they allow for two distinct modes of flame propagation. In a sub-sonic deflagration burning is mediated by thermal conduction while a super-sonic detonation is driven by a shock wave. On the basis of one-dimensional simulations of a prompt detonation, Arnett (1969) ruled out this model for SNe Ia since it drastically underproduces intermediate mass elements observed in spectra of these events.
Starting out as a laminar deflagration, however, the flame propagates too slowly to explain the energy release necessary to explode the WD. Thus, any valid SN Ia model needs to provide means of flame acceleration. Two mechanisms are conceivable here. Firstly, the flame propagation may continue in the deflagration mode being significantly accelerated by the interaction with turbulence. The one-dimensional model W7 of Nomoto et al. (1984) demonstrated that such a model is in principle capable of reproducing the main observational features of SNe Ia. An alternative way to speed up the flame is to assume a deflagration-to-detonation transition (DDT) at later stages of the explosion. The weak point of these delayed detonation models (e.g. (Gamezo et al., 2004)) is that a physical mechanism providing a DDT in SNe Ia could not be identified yet (Niemeyer, 1999; Lisewski et al., 2000; Röpke et al., 2004a, b) and therefore the hypothetical transition of the burning mode enters the model as an undetermined parameter.
2 A deflagration type Ia supernovae model
Our goal in the following is to present a SN Ia explosion model that contains no tunable parameters. Therefore we set aside the possibility of a delayed detonation and focus on the turbulent deflagration model. Turbulence is induced here by generic instabilities. The flame propagates from the center of the star outward leaving behind light and hot ashes. Dense and cold fuel in front of the flame gives rise to an inverse density stratification in the gravitational field of the WD. This renders the flame propagation buoyancy unstable and in its nonlinear stage the Rayleigh-Taylor instability leads to the formation of (typically mushroom-shaped) burning bubbles that rise into the cold fuel. At the interfaces of these bubbles strong shear flows emerge. The corresponding Reynolds numbers reach values of the order of and therefore strong turbulence is generated by secondary shear (Kelvin-Helmholtz) instabilities. The turbulent eddies generated on scales of the buoyancy-induced flame features decay to smaller scales forming a turbulent energy cascade and interact with the flame propagation. This stretches and corrugates the flame enlarging its surface area and thus the net burning rate is increased.
The main challenge in numerically implementing this scenario is the vast range of relevant length scales involved. Not only is the width of a thermonuclear flame in the degenerate carbon/oxygen material at the onset of the explosion 9 orders of magnitude below the radius of the WD. The turbulent cascade extends to even smaller scales and interacts with the flame down to the Gibson length at which the laminar flame speed equals the turbulent velocity fluctuations ( and decreasing in the explosion process). This problem can be tackled in a Large Eddy Simulation (LES) approach. Here, only the largest scales of the problem are directly resolved (applying the Prometheus implementation (Fryxell et al., 1989) for solving the hydrodynamics equations) and turbulence effects on unresolved scales are included via a subgrid-scale model (Niemeyer and Hillebrandt, 1995; Schmidt et al., 2006). The thermonuclear flame is modeled as a sharp discontinuity separating the burnt from the unburnt material. Its evolution is followed utilizing the level-set method (Osher and Sethian, 1988). Since the structure of the flame is not resolved, the flame propagation velocity must be provided externally. This, however, does not introduce an undetermined parameter to the model since the theory of turbulent combustion (Peters, 2000) predicts that for most stages of the SN Ia explosion the flame propagation proceeds in the flamelet regime where it completely decouples from the microphysics of the burning and is determined by the turbulent velocity fluctuations that can be derived from the subgrid-scale model. This implementation provides a self-consistent model of SN Ia explosions in the deflagration scenario.
Our description of burning is augmented by a simplified treatment of the nuclear reactions including only five species (Reinecke et al., 2002b). It provides the energy release necessary to follow the explosion dynamics. In order to derive observables from the models, however, the chemical composition of the ejecta needs to be known in detail. This is achieved in a nucleosynthesis postprocessing step (Travaglio et al., 2004). Of particular interest is the yield of 56Ni, since its radioactive decay powers the light curve.
3 Simulation results
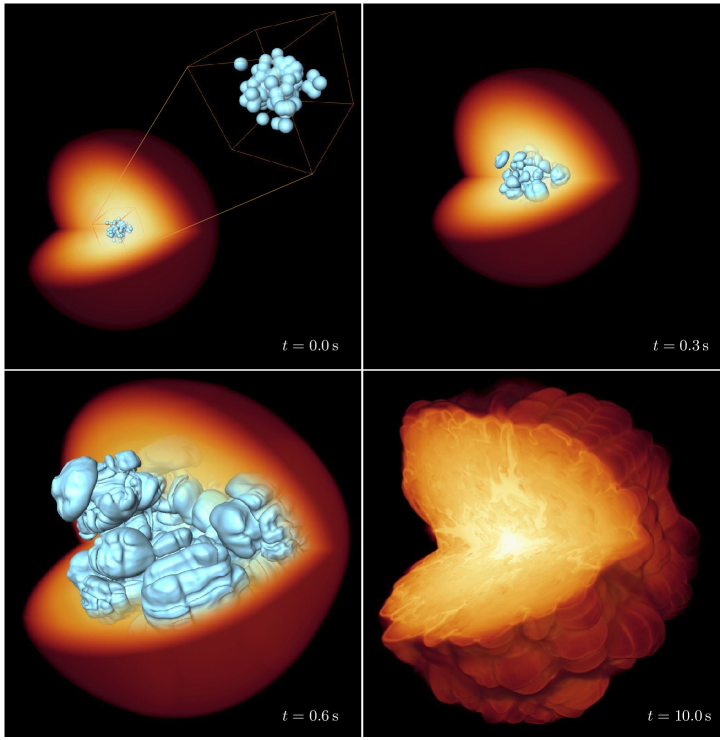
A typical evolution of a SN Ia explosion modeled as described above is shown in Fig. 1. Starting from an ignition in multiple sparks the flame propagates outward. At , the mushroom-shaped features due to the buoyancy instability are clearly visible. Subsequently, the flame becomes increasingly corrugated and is accelerated by interaction with turbulence. It therefore burns through a large fraction of the WD material. The snapshot at shows the flame evolution around the peak of energy production due to nuclear burning. Up to this point, the burning terminated in nuclear statistical equilibrium (NSE) and the carbon/oxygen material was primarily converted to iron group elements. The expansion of the WD decreases the fuel density steadily and once it falls below nuclear burning becomes incomplete and produces mainly intermediate mass elements. About after ignition, expansion quenches the burning and the following evolution is characterized by the relaxation to homologous expansion of the ejecta, which is reached to a reasonable accuracy after ignition (Röpke, 2005). The density structure of the ejecta at this stage is shown in Fig. 1, where the traces of turbulent flame propagation are clearly visible.
| Parameter | Range of variation | Effect on 56Ni production | Effect on total energy |
|---|---|---|---|
| X(12C) | [0.30, 0.62] | 14% | |
| [] | [1.0, 2.6] | 6% | 17% |
| [] | [0.5, 3.0] | 20% | none |
Apart from the initial conditions simulations as described above contain no free parameters. Therefore the question arises whether such models are capable of reproducing observations without any fitting. The explosion energies achievable in the outlined scenario reach up to and the models produce of 56Ni. This falls into the range of observational expectations, although on the side of the weaker SN Ia explosions (Contardo et al., 2000; Stritzinger et al., 2005). Nonetheless, the synthetic lightcurves derived from models of the class described here fit the observations in the and bands around maximum luminosity rather well (Sorokina and Blinnikov, 2003; Blinnikov et al., 2006). A much harder constraint on the explosion model is posed by spectral observations, since spectra are particularly sensitive to the chemical composition of the ejecta. Kozma et al. (2005) pointed out a potential problem of deflagration SN Ia models. In late time “nebular” spectra, unburnt material (transported towards the center in downdrafts due to the large-scale buoyancy-unstable flame pattern) gives rise to a strong oxygen line of low-velocity material which is in conflict with observations. However, the synthetic spectrum of (Kozma et al., 2005) was derived from a simplistic centrally ignited model. Recently, Röpke et al. (2006a) showed that multi-spot ignition models may succeed to burn out the central parts of the WD, reducing the amount of oxygen at low velocities. A stochastic multi-spot ignition leads to similar results (Schmidt and Niemeyer, 2006). Detailed spectral observations allow to determine the chemical composition of the ejecta in velocity space (Stehle et al., 2005). The mixed composition of the ejecta observed there points to a deflagration phase being at least a significant contribution to the SN Ia explosion process. The central parts are found to be clearly dominated by iron group elements, which are mixed out to velocities of about . Intermediate mass elements are distributed over a wide range in radii and no unburnt material is found at velocities . A recent high-resolution full-star deflagration SN Ia simulation (Röpke et al., 2006b) demonstrated that such models can get close to these observational constraints.
Although it cannot be ruled out that the pure deflagration model of SNe Ia is incomplete, the results indicate that it may be at least a dominant part of the mechanism. Therefore it is justified to ask how such models are affected by initial parameters of the exploding WD. This may give a hint to the origin of the diversity of SNe Ia. To moderate the computational expenses, simplified setups may be used to study the effects of physical parameters on the explosion models. Such an approach was recently taken by Röpke et al. (2006c) and resulted in the first systematic study of progenitor parameters in three-dimensional models. The basis of this study was a single-octant setup with moderate (yet numerically converged) resolution. However, the lack in resolution did not allow for a reasonable multi-spot ignition scenario and thus only weak explosions can be expected. It is therefore not possible to set the absolute scale of effects in this approach, but trends can clearly be identified. The parameters chosen for the study were the WD’s carbon-to-oxygen ratio, its central density at ignition and its 22Ne mass fraction resulting from the metallicity of the progenitor. All parameters were varied independently to study the individual effects on the explosion process. The results of this survey are given in Tab. 1.
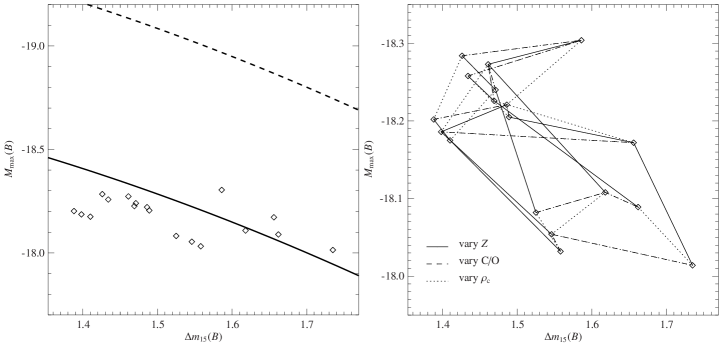
To determine the effects of these variations on observables, synthetic light curves were derived from all models (Blinnikov et al., 2006). From these, the peak luminosities and decline rates (in magnitudes 15 days after maximum; ) were determined. A comparison with the relation given by Phillips et al. (1999) (forming the basis of the calibration of cosmological distance measurements) is provided in the left panel of Fig. 2. Obviously, the absolute magnitude of the Phillips relation is not met by our set of models. Moreover, the range of scatter in is much narrower than that of the set of observations used by Phillips et al. (1999). But there is a trend of our models consistent with the slope of the Phillips relation. The right panel of Fig. 2 shows that this slope is dominated by the variation of the progenitor’s metallicity.
References
- Reinecke et al. (2002a) M. Reinecke, W. Hillebrandt, and J. C. Niemeyer, A&A 391, 1167–1172 (2002a).
- Gamezo et al. (2003) V. N. Gamezo, A. M. Khokhlov, E. S. Oran, A. Y. Chtchelkanova, and R. O. Rosenberg, Science 299, 77–81 (2003).
- Hillebrandt and Niemeyer (2000) W. Hillebrandt, and J. C. Niemeyer, ARA&A 38, 191–230 (2000).
- Garcia-Senz and Woosley (1995) D. Garcia-Senz, and S. E. Woosley, ApJ 454, 895–900 (1995).
- Woosley et al. (2004) S. E. Woosley, S. Wunsch, and M. Kuhlen, ApJ 607, 921–930 (2004).
- Iapichino et al. (2006) L. Iapichino, M. Brüggen, W. Hillebrandt, and J. C. Niemeyer (2006), A&A in press, astro-ph/0512300.
- Kuhlen et al. (2006) M. Kuhlen, S. E. Woosley, and G. A. Glatzmaier, ApJ 640. 407–416 (2006).
- Höflich and Stein (2002) P. Höflich, and J. Stein, ApJ 568, 779–790 (2002).
- Arnett (1969) W. D. Arnett, Ap&SS 5, 180–212 (1969).
- Nomoto et al. (1984) K. Nomoto, F.-K. Thielemann, and K. Yokoi, ApJ 286, 644–658 (1984).
- Gamezo et al. (2004) V. N. Gamezo, A. M. Khokhlov, and E. S. Oran, Phys. Rev. Lett. 92, 211102 (2004).
- Niemeyer (1999) J. C. Niemeyer, ApJ 523, L57–L60 (1999).
- Lisewski et al. (2000) A. M. Lisewski, W. Hillebrandt, and S. E. Woosley, ApJ 538, 831–836 (2000).
- Röpke et al. (2004a) F. K. Röpke, W. Hillebrandt, and J. C. Niemeyer, A&A 420, 411–422 (2004a).
- Röpke et al. (2004b) F. K. Röpke, W. Hillebrandt, and J. C. Niemeyer, A&A 421, 783–795 (2004b).
- Fryxell et al. (1989) B. A. Fryxell, E. Müller, and W. D. Arnett, Hydrodynamics and nuclear burning, MPA Green Report 449, Max-Planck-Institut für Astrophysik, Garching (1989).
- Niemeyer and Hillebrandt (1995) J. C. Niemeyer, and W. Hillebrandt, ApJ 452, 769–778 (1995).
- Schmidt et al. (2006) W. Schmidt, J. C. Niemeyer, W. Hillebrandt, and F. K. Röpke (2006), A&A in press, astro-ph/0601500.
- Osher and Sethian (1988) S. Osher, and J. A. Sethian, J. Comp. Phys. 79, 12–49 (1988).
- Peters (2000) N. Peters, Turbulent Combustion, Cambridge University Press, Cambridge, 2000.
- Reinecke et al. (2002b) M. Reinecke, W. Hillebrandt, and J. C. Niemeyer, A&A 386, 936–943 (2002b).
- Travaglio et al. (2004) C. Travaglio, W. Hillebrandt, M. Reinecke, and F.-K. Thielemann, A&A 425, 1029–1040 (2004).
- Röpke (2005) F. K. Röpke, A&A 432, 969–983 (2005).
- Contardo et al. (2000) G. Contardo, B. Leibundgut, and W. D. Vacca, A&A 359, 876–886 (2000).
- Stritzinger et al. (2005) M. Stritzinger, B. Leibundgut, S. Walch, and G. Contardo (2005), arXiv:astro-ph/0506415.
- Sorokina and Blinnikov (2003) E. Sorokina, and S. Blinnikov, “Light Curves of Type Ia Supernovae as a Probe for an Explosion Model,” in From Twilight to Highlight: The Physics of Supernovae, edited by W. Hillebrandt, and B. Leibundgut, ESO Astrophysics Symposia, Springer, Berlin Heidelberg, 2003, pp. 268–275.
- Blinnikov et al. (2006) S. I. Blinnikov, F. K. Röpke, E. I. Sorokina, M. Gieseler, M. Reinecke, C. Travaglio, W. Hillebrandt, and M. Stritzinger (2006), A&A in press, astro-ph/0603036.
- Kozma et al. (2005) C. Kozma, C. Fransson, W. Hillebrandt, C. Travaglio, J. Sollerman, M. Reinecke, F. K. Röpke, and J. Spyromilio, A&A 437, 983–995 (2005).
- Röpke et al. (2006a) F. K. Röpke, W. Hillebrandt, J. C. Niemeyer, and S. E. Woosley (2005a), A&A 448, 1–14 (2006).
- Schmidt and Niemeyer (2006) W. Schmidt, and J. C. Niemeyer, A&A 446, 627–633 (2006).
- Stehle et al. (2005) M. Stehle, P. A. Mazzali, S. Benetti, and W. Hillebrandt, MNRAS 360, 1231–1243 (2005).
- Röpke et al. (2006b) F. K. Röpke et al. (2006), in preparation.
- Röpke et al. (2006c) F. K. Röpke, M. Gieseler, M. Reinecke, C. Travaglio, and W. Hillebrandt (2005b), A&A in press, astro-ph/0506107.
- Phillips et al. (1999) M. M. Phillips, P. Lira, N. B. Suntzeff, R. A. Schommer, M. Hamuy, and J. Maza, AJ 118, 1766–1776 (1999).