1–3
Isotopic Abundances of Carbon and Oxygen in Oxygen-Rich Giant Stars
Abstract
16O/17O and 12C/13C ratios in 23 M giants are determined from high resolution IR spectra. The results are confronted with the current models on the convective mixing.
keywords:
convection, stars: abundances, stars: AGB and post-AGBIntroduction: It has been known that CNO and their isotopic abundances are useful probes of the mixing in evolved stars. It is, however, by no means clear yet if the observed results could be consistent with the predictions of the stellar evolution models. Here, we concentrate on oxygen-rich giants, possibly experienced the first and second dredges-up, but may not be disturbed by the further processes such as the third dredge-up. For this purpose, we extend our previous analyses on CO spectra in M giant stars to including isotopic ratios, and we also hope to reexamine the carbon abundances.
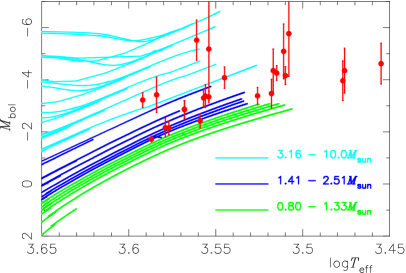
The Basic Stellar Parameters: We selected 23 red giant stars, for which the effective temperatures are determined by the use of the infrared flux method and the bolometric luminosities by the integration of the SEDs. With the Hipparcos parallaxes, absolute bolometric magnitudes are determined. The error bars of are based on those of the parallaxes, but errors in photometric data and in (about mag and 100 K, respectively) are not included. Our sample is shown on the HR diagram and compared with the evolutionary tracks by [Claret (2004)] in Fig. 1. Unfortunately, nearly half of our sample cannot be accounted for by the models of Claret, and we had to extrapolate the evolutionary tracks to estimate stellar masses given in Table 1.
| Obj. | 12C/13C | 12C/13C | 16O/17O | 16O/17O | log | ||||
|---|---|---|---|---|---|---|---|---|---|
| present | others | present | others | km | K | ||||
| RZ Ari | 5 1 | 402 57 | -4.09 | 2.99 | 3295 | -3.47 0.55 | 1.5 | ||
| Cet | 10 2 | 200 | -3.88 | 3.68 | 3905 | -3.22 0.28 | 3.6 | ||
| Per | 9 2 | 15 2a | 1000 | -3.76 | 2.86 | 3505 | -4.08 0.41 | 3.2 | |
| Eri | 9 2 | 560 97 | -3.67 | 2.29 | 3700 | -2.85 0.35 | 2.0 | ||
| Tau | 11 2 | 10 2a | 1000 | 560 180b | -3.71 | 2.59 | 3860 | -1.72 0.10 | 1.4 |
| Gem | 7 1 | 13 2a | 206 30 | 325 112b | -4.15 | 3.30 | 3605 | -3.30 0.33 | 2.1 |
| Vir | 7 1 | 12 2a | 1500 | -4.12 | 2.84 | 3795 | -2.16 0.36 | 1.6 | |
| Vir | 10 2 | 16 4a | 1500 | -3.91 | 3.33 | 3625 | -2.42 0.27 | 1.4 | |
| SW Vir | 11 2 | 188 22 | -4.06 | 4.13 | 2990 | -4.35 0.86 | 1.4 | ||
| 10 Dra | 11 2 | 12 3a | 112 14 | -3.77 | 3.44 | 3700 | -2.87 0.31 | 2.0 | |
| RX Boo | 5 1 | 136 21 | -3.75 | 3.08 | 2850 | -4.62 0.78 | 1.4 | ||
| RR UMi | 5 1 | 1000 | -4.10 | 3.04 | 3355 | -3.38 0.32 | 1.5 | ||
| Lib | 7 1 | 1500 | -4.00 | 3.21 | 3600 | -3.37 0.44 | 2.1 | ||
| Oph | 9 1 | 232 46 | -3.97 | 3.23 | 3775 | -2.15 0.27 | 1.5 | ||
| 30g Her | 9 1 | 10 2a | 197 24 | 675 175c | -4.17 | 3.89 | 3235 | -4.16 0.34 | 1.8 |
| Her | 9 1 | 107 14 | 190 40b | -3.93 | 3.81 | 3220 | -5.77 1.64 | 4.5 | |
| OP Her | 9 1 | 184 21 | -4.12 | 4.02 | 3285 | -4.35 0.83 | 2.1 | ||
| BS6861 | 21 5 | 1000 | -3.43 | 3.43 | 3580 | -5.18 1.98 | 6.1 | ||
| XY Lyr | 11 1 | 218 18 | -4.10 | 3.71 | 3245 | -5.09 1.05 | 3.4 | ||
| Lyr | 11 2 | 199 20 | -4.21 | 4.51 | 3637 | -5.52 0.77 | 7.3 | ||
| R Lyr | 8 2 | 376 61 | -3.73 | 2.76 | 3275 | -4.26 0.28 | 2.0 | ||
| Aqr | 9 1 | 500 | -3.87 | 3.11 | 3835 | -3.42 0.68 | 3.6 | ||
| Peg | 6 1 | 8 2a | 1500 | 1050 375b | -4.11 | 3.39 | 3580 | -3.34 0.22 | 2.1 |
References: a) Smith & Lambert (1990), b) Harris & Lambert (1984), c) Harris et al.(1985)
Method of Analysis: We use the high resolution spectra observed with the KPNO FTS, and measured EWs of isolated lines of 12C16O, 13C16O, and 12C17O in the -band region. We applied a line-by-line analysis on these EWs with the use of the spherically extended 1D model photospheres. In our analysis, the micro-turbulent velocity is determined so that the abundances of 12C16O from individual lines show the least dependence on the EWs. The resulting is used to determine abundances of 13C16O and 12C17O as well. Some examples are shown in Fig.2.
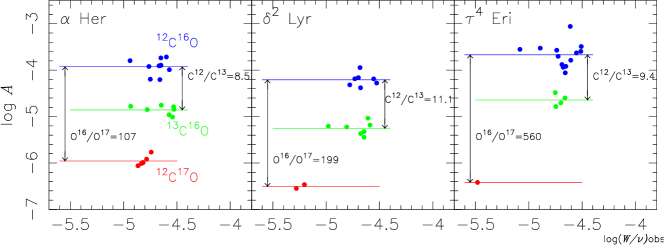
Results: The isotopic ratios based on the 12C16O, 13C16O, and 12C17O abundances are given in Table 1. The results are further confirmed by a direct comparison of the observed spectra with the synthetic spectra in the regions of the 13C16O (2-0) bandhead and 12C17O (2-0) lines. Also, we applied the spectral synthesis method to estimate 16O/17O for the case in which 12C17O lines are too weak to measure EWs accurately, and the results are given without error bars in Table 1. For a few stars, our results appear to be consistent with the results by other authors ([Harris & Lambert (1984), Harris & Lambert 1984], [Harris, Lambert & Smith 1985, Harris, Lambert & Smith 1985], [smith90, Smith & Lambert 1990]) in general, as shown in Table 1.
16O/17O Ratio: The resulting 16O/17O ratios plotted against the stellar masses are compared with the predicted ones by [Claret (2004)] (solid lines) in Fig. 3a. The rather large variation of 16O/17O in low mass stars is well consistent with the prediction of the evolutionary models, confirming the previous analysis by [Dearborn (1992)] using the observed data known at that time. In the higher mass stars, however, some objects have quite low 16O/17O ratios and cannot be consistent with the predicted trend.
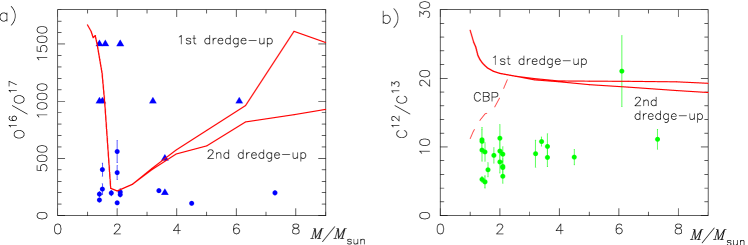
12C/13C Ratio: We confirm in Fig. 3b that 12C/13C ratios are mostly around 10. The contradiction with the evolutionary models, which predict 12C/13C (solid lines), has been a long-standing puzzle. This dilemma may be resolved by assuming a deep circulation below the bottom of the convective zone, referred to as cool bottom processing ([Boothroyd & Sackmann 1999, Boothroyd & Sackmann 1999]), and its prediction is also plotted in Fig. 3b (dashed line). Our result, however, suggests that the extra mixing may not resolve yet the 12C/13C puzzle, even if we make allowance for uncertainties in stellar masses.
Concluding Remarks: We also planned to redetermine C abundances, which showed somewhat different results from the CO 1st ([Tsuji (1986), Tsuji 1986]) and 2nd ([Tsuji (1991), Tsuji 1991]) overtone bands, and details on this issue will be discussed elsewhere. Despite such a problem, the isotopic ratios can be determined more accurately than the elemental abundances. For this reason, isotopic ratios can be useful probes of evolutionary models and mixing processes in cool evolved stars. The observed and predicted isotopic ratios, however, are still by no means consistent (Fig. 3). Introduction of an extra-mixing may be needed, but it is vital to pursue a better theory of convection that may comprehend more efficient mixing.
References
- [Boothroyd & Sackmann 1999] Boothroyd, A., & Sackmann, I. -J. 1999, ApJ 510, 232
- [Claret (2004)] Claret, A. 2004, A&A 424, 919
- [Dearborn (1992)] Dearborn, D. S. P. 1992, Phys. Rep. 210, 367
- [Harris & Lambert (1984)] Harris, M., & Lambert, D. L. 1984 ApJ 285, 674
- [Harris, Lambert & Smith 1985] Harris, M., Lambert, D. L., & Smith, V. V. 1985, ApJ 299, 375
- [Smith & Lambert (1990)] Smith, V. V., & Lambert, D. L. 1990, ApJS 72, 387
- [Tsuji (1986)] Tsuji, T. 1986, A&A 156, 8
- [Tsuji (1991)] Tsuji, T. 1991, A&A 245, 203