Ram Pressure Stripping in Groups: Comparing Theory and Observations
Abstract
Ram pressure stripping may be the dominant mechanisms driving the evolution of galaxy colors in groups and clusters. In this paper, an analytic model of ram pressure stripping is confronted with observations of galaxy colors and star formation rates in groups using a group catalog drawn from the Sloan Digital Sky Survey. An observed increase in the fraction of galaxies residing on the red sequence, the red fraction, with both increasing group mass, , and decreasing satellite luminosity, , is predicted by the model. The size of the differences in the red fraction can be understood in terms of the effect of the scatter in satellite and cluster morphologies and satellite orbits on the relationship between and and the stripped gas fraction. Observations of the group galaxies’ H and 4000Å break spectral measures and a comparison of the distribution of for star forming galaxies in the groups and in isolation both indicate that the color differences observed in the groups are the result of slowly declining SFRs, as expected if the color change is driven by stripping of the outer H i disk.
Subject headings:
galaxies: evolution — galaxies:clusters:general1. INTRODUCTION
Galaxies in clusters have earlier type morphologies, redder colors, and lower star formation rates (SFRs) than galaxies in the field of similar luminosity (Gomez et al., 2003; Goto et al., 2003; Dressler, 1980). Galaxies in groups and clusters formed both earlier and in denser environments than their field counterparts. Cluster galaxies may therefore naturally appear older than field galaxies. In addition, group and cluster galaxies are more likely to have undergone major mergers (Göttlober et al., 2001) and are susceptible to harassment (Moore et al., 1998) and interactions with the ICM (Gunn & Gott, 1972). These interactions with the environment work to transform blue, late-type galaxies into red, early-type galaxies.
Several recent observational studies have explored the relationship between galaxy properties and environment. Blanton et al. (2005b) and Hogg et al. (2003) study the dependence of environment on galaxy properties and find that bright, red, and concentrated galaxies prefer to reside in environments with higher densities. Large galaxy surveys have revealed strong bimodalities in both stellar properties; color, SFR, 4000Å break; and structural properties; concentration, central surface brightness, , (Baldry et al., 2004; Blanton et al., 2003a; Kauffmann et al., 2003a; Li et al., 2006; Strateva et al., 2003). As the local density increases the fraction of galaxies found in the red and high concentration modes increases (Kauffmann et al., 2004), and galaxies in the red or high concentration modes are more clustered than galaxies in the blue or low concentration modes (Li et al., 2006).
Galaxy properties are strongly related to each other as well as to the local environment. Bivariate distributions of , color, central i-band surface brightness, , and the i-band Sersic index, , are shown in Blanton et al. (2005b). Galaxies tend to be either blue with low concentrations or red with high concentrations. In addition, the average 4000Å break, g-r color, concentration, and all monotonically increase with stellar mass (Kauffmann et al., 2003b). Understanding the effect of environment on galaxy evolution requires studying the effect of environment on both the distribution of galaxy properties and on the relationships between galaxy properties.
Three separate studies show that the relationship between color and environment is stronger than the relationship between concentration and environment. Blanton et al. (2005b) demonstrate that the observed relationship between and environment is reproduced when galaxies are assigned new local densities based on their colors and i-band magnitudes, . However, the observed relationship between color and environment cannot be reproduced by assigning local densities based on and . Kauffmann et al. (2003b) show that the relationship between concentration and stellar mass depends on the local environment only weakly and only at low stellar masses, . In contrast the relationship between the 4000Å break or the SFR and the stellar mass shows a strong dependence on the local environment. Li et al. (2006) study the correlation function, in bins of luminosity, for galaxies belonging to the different galaxy modes. Galaxies that are red, have large 4000Å breaks, high concentrations, or bright all have enhanced correlation functions on scales less than 5Mpc. However, for galaxies that are red and have large breaks, the enhancement is larger and extends to larger scales.
If environment causes galaxy colors to evolve, then the timescale on which evolution occurs is a clue to the processes responsible. Kauffmann et al. (2004) and Balogh et al. (2004) both study the timescale over which galaxies’ colors evolve and come to different conclusions. Kauffmann et al. (2004) compare Sloan Digital Sky Survey (SDSS) spectra to stellar evolution models and observe that the absence of galaxies with strong H for their 4000Å break strengths argues against the predominance of any process that truncates star formation on timescales less than a Gyr. In contrast, Balogh et al. (2004) use observations of equivalent widths to argue against slowly evolving SFRs. While they observe an increase in the fraction of non-star forming galaxies in high density environments, they do not see a downward shift in the distributions for either actively star forming galaxies or galaxies with blue colors. These observations indicate that galaxies pass quickly from the star forming to the non-star forming populations.
Ram pressure stripping of galaxies in groups and clusters is one process that can truncate star formation and redden galaxies. Hester (2006) (Hereafter, Paper 1) presents a model of ram pressure stripping that predicts the fraction of the gas that is stripped from the outer H i disk and the hot galactic halo. This fraction depends primarily on the ratio of the galaxy’s mass to the mass of the group or cluster in which it orbits and secondly on several descriptive model parameters.
In this paper, the importance of ram pressure stripping is examined by combining the predictions of the model presented in Paper 1 with observations of galaxy groups in the SDSS. The group catalog used here was assembled by A. Berlind and is presented in Berlind et al. (2006). It is reviewed briefly in § 2. The predictions of the model for the galaxy and group masses of interest are presented in § 3.1. In § 3.2, the timescale on which the SFR declines after a galaxy is stripped of the gas outside its inner star forming disk is discussed. In § 4, observations of the groups are compared to past observations and to the model of ram pressure stripping. The timescale of the decline in the SFR in the groups and the role ram pressure stripping may play in determining general trends in galaxy properties are also examined. § 5 concludes.
2. THE GROUP CATALOG
The Sloan Digital Sky Survey (SDSS) (York et al., 2000) is conducting an imaging and photometric survey of in the northern hemisphere as well as three thin slices in the southern hemisphere. Observing is done using a dedicated 2.5m telescope in Apache Point, NM. The telescope operates in drift scan mode and observes in five bandpasses (Fukugita et al., 1996). Magnitude calibration is carried out using a network of standard stars (Smith et al., 2002). Three sets of spectroscopic targets are selected automatically, the main galaxy sample, the luminous red galaxy sample, and the quasar sample (Strauss et al., 2002; Eisenstein et al., 2001; Richards et al., 2002). Objects in the main galaxy sample have Petrosian magnitudes and are classified as extended. Magnitudes are corrected for galactic extinction using the reddening maps of Schlegel, Finkbbeiner, & Davis (1998) prior to selection. Spectroscopy is taken using a pair of fiber-red spectrographs, and targets are assigned to fibers using an adaptive tiling algorithm (Blanton et al., 2003d). Data reduction for the SDSS is done using a series of automated pipelines (Hogg et al., 2001; Ivezić et al., 2004; Lupton et al, 2005; Pier et al., 2003; Smith et al., 2002).
The catalog used here is a volume limited sample drawn from the NYU Value Added Galaxy Catalog (NYU-VAGC) (Blanton et al., 2005a). The sample goes down to and has a redshift range of 0.015-0.068. The group finding algorithm is described in detail in Berlind et al. (2006). The group finder is a friends of friends algorithm with two linking lengths, one for projected distances and one in red shift space. Linking lengths are chosen such that the multiplicity function, richness, and projected size of recovered groups from simulations projected into redshift space are unbiased measures. The linking lengths are also chosen to maximize the number of groups recovered and minimize the number of spurious groups. The velocity dispersions of the recovered groups are systematically low because the group finder does not link the fastest moving group members to the group. However, as the fastest group members are also those most likely to be stripped, not including these galaxies biases against observing the signature of ram pressure stripping.
Virial masses and radii for the groups are determined by assuming a monotonic relationship between group mass and richness and matching a CDM mass function to the measured group luminosity function (Berlind et al., 2006). This assumes no scatter in the relationship between mass and richness. In this paper, galaxies are grouped by virial mass, and the assumption that there is no scatter should not be important. The absolute magnitudes used here are k-corrected and corrected for passive evolution to (Blanton et al., 2003b, c). Membership in the red sequence is defined using the dependent color cut presented in Li et al. (2006); . The i-band Sersic index, , is defined as and its measurement is discussed in Blanton et al. (2003c). The and the 4000Å break are those measured by Kauffmann et al. (2003a). The measurements of the SFR are from Brinchmann et al. (2004) and are normalized to the galaxies’ stellar masses. The affect of the changing physical size of the spectroscopic fiber’s 3 arcsec diameter is corrected for in by assuming that the relationship between color and is constant throughout the disk. This correction may bias against observing galaxies with blue colors and low and is important for galaxies at the low redshifts of this sample.111H, 4000Å break, , and are available from http://www.mpa-garching.mpg.de/SDSS/
3. RAM PRESSURE STRIPPING
Gunn & Gott (1972) proposed ram pressure striping to explain the observed absence of gas rich galaxies in clusters. Galaxies in clusters feel an intracluster medium (ICM) wind that can overcome the gravitational attraction between the stellar and gas disks and strip the gas disk. They introduced the following condition to estimate when this occurs;
| (1) |
The left-hand side is a ram pressure, where is the density of the ICM and is the orbital speed of the satellite. The right-hand side is a gravitational restoring pressure where and are the surface densities of the stellar and gas disks respectively. Using this condition they concluded that spirals should lose their gas disks when they pass through the centers of clusters.
Galaxies in nearby clusters are observed to be deficient in H i and to have truncated gas disks when compared to field galaxies of similar morphology and optical size (Bravo-Alfaro et al., 2000; Cayatte et al., 1994; Giovanelli & Haynes, 1983; Solanes et al., 2001). In addition, asymmetric extra-planar gas that appears to have been pushed out of the disk is observed in several Virgo spirals (Kenney et al., 2004a; Kenney & Koopman, 1998; Kenney et al., 2004b). These observations can be explained by ram pressure stripping, and observing an undisturbed stellar disks accompanied by extra-planar gas is a strong indication that the gas disk is interacting with the ICM. Ram pressure stripping has also been repeatedly observed in simulations of disk galaxies in an ICM wind (Abadi et al., 1999; Marcolini et al., 2003; Quilis et al., 2000; Roediger & Hensler, 2005; Schulz & Struck, 2001).
Paper 1 uses an analytical model of ram pressure stripping to explore the range of environments in which stripping can occur and the galaxy masses that are susceptible to stripping in each environment. It focuses on the H i disk beyond the stellar disk, and stripping of gas from within the stellar disk is not modeled. The gravitational restoring pressure is found by placing a flat H i disk in a gravitational potential consisting of a dark matter halo, a stellar disk, and a stellar bulge. The ram pressure is determined by letting the satellite orbit in an NFW potential through a profile ICM. The gas fraction that a galaxy is striped of is found to depend on the ratio of the satellite mass to the group mass, , and the values of several descriptive parameters. Observations of stripped spirals in clusters compare well with the model’s predictions for large and . Paper 1 concludes that many galaxies, particularly low-mass galaxies, can be stripped of a substantial fraction of their outer H i disks in a wide range of environments. The specific model predictions for the SDSS group catalog are given below and the possible effects of stripping the outer gas are discussed.
3.1. Model Predictions
In this section, the analytic model developed in Paper 1 is used to predict trends for galaxy colors in the SDSS groups.
The model predicts that the extent of stripping depends on the ratio . However, two separate trends should in fact be observed, one with at fixed and one with at fixed . This is mainly because the average ICM density of groups decreases as decreases, and the average gas fraction in the disk increases as decreases, which shifts the values of for which stripping occurs (Sanderson & Ponman, 2003; Swaters et al., 2002). In addition there is a strong color magnitude relation seen in both groups and the field. Therefore, it is necessary to in fact observe the change in the difference between the red fraction in the groups and in isolation with rather than the red fraction itself.
Observing a color or SFR trend due to ram pressure stripping requires a group catalog with both an appropriate range of group and galaxy masses and a sufficient number of galaxies and groups. A useful group catalog is one in which the effectiveness of stripping varies so that trends in with and are expected. The groups in the catalog have masses between and and the galaxies have . In Tables 1 - 3 the model’s predictions for the satellite mass, , and absolute magnitude, , at which a galaxy is stripped of of its H i disk are given for groups of masses . The model galaxy parameters are those from Paper 1 for a large spiral. The ICM parameters for are from the low-mass group model. The ICM parameters for are from the middle-mass cluster model. The values in Tables 1-3 assume a galaxy orbiting inclined to the ICM wind that is stripped of an intermediate gas fraction between those expected for a galaxy traveling face-on or edge-on to the wind. Total mass to light ratios in the r-band of 40, 65, and 90 are used to convert to . These are a factor 10-15 higher than the stellar mass to light ratios of 4-6 found for the R-band by Maraston (1998). In Tables 1-3 galaxies with are highlighted. The predictions of the model are not exact, but they do demonstrate that the range of and in the group catalog is appropriate for this project. The high-mass groups should contain many stripped galaxies, but the low-mass groups are capable of stripping few of the galaxies in the sample. Though the range in is not as great as the range in , in higher mass groups, galaxies with and are stripped of different gas fractions.
| 13.0 | 11.2 | -19.8 | -20.3 | -19.4 |
| 13.5 | 11.7 | -21.1 | -21.6 | -20.7 |
| 14.0 | 12.2 | -22.3 | -22.8 | -22.0 |
| 14.5 | 13.0 | -23.3 | -23.8 | -23.0 |
| 13.0 | 10.9 | -18.2 | -18.7 | -17.8 |
| 13.5 | 11.4 | -19.5 | -20.0 | -19.1 |
| 14.0 | 11.9 | -20.7 | -21.2 | -20.4 |
| 14.5 | 12.6 | -21.7 | -22.2 | -21.3 |
| 13.0 | 10.2 | -17.1 | -17.7 | -16.8 |
| 13.5 | 10.7 | -18.4 | -18.9 | -18.1 |
| 14.0 | 11.2 | -19.6 | -20.2 | -19.3 |
| 14.5 | 12.0 | -20.6 | -21.1 | -20.3 |
The model also predicts the extent of stripping of the hot galactic halo. The galactic halo is modeled by placing gas at the virial temperature of the galaxy’s dark matter halo in hydrostatic equilibrium with an NFW potential. It is assumed that the galactic halo is stripped down to the radius at which the ram pressure equals the thermal pressure. The galaxies in this sample can only maintain % of their mass in the galactic halo without the gas cooling rapidly. Using this mass fraction, the model predicts that the galaxies in the group sample have more than 70% of this gas stripped in a group and the entire halo is stripped in any group with a mass above . This is an upper limit on the hot halo gas these galaxies can retain in the absence of fresh in-falling gas. Therefore, it is assumed for the rest of the paper that the galactic halo is stripped for all galaxies in the sample, and that any observed trends in are due to ram pressure stripping of the H i disk.
The size of the galaxy catalog needed to detect stripping is determined by the scatter in the relationship between the fraction of the H i disk mass that is stripped, , and the satellite galaxy mass, . The scatter can be thought of in terms of a distribution of effective masses, , at each physical satellite mass . The effective mass is defined such that all satellites with the same effective mass are stripped of the same fraction of their H i disk. This scatter is substantial. As shown in Paper 1, a galaxy can be stripped as much as a galaxy or as little as a galaxy. The scatter is mainly due to differences in the galaxies’ orbits, stellar and H i disk scale lengths, and in the density and extent of the groups’ ICM. Paper 1 discusses the number of groups and galaxies a sample must contain in order to observe systematic changes in with and . However, the relationship between and color is not simple. Therefore, because the connection between and residing on the red sequence is probably more direct, the red fraction will be studied rather than average galaxy colors. Galaxies that have been stripped of more than a critical gas fraction, , should eventually join the red sequence. In this picture, the fraction of blue disk galaxies entering groups that join the red sequence is the fraction with , and the fraction of galaxies with a given that join the red sequence is intimately related to the distribution of at . If the scatter in is large compared to the difference in or between two sub-samples, the difference in the red fraction between the sub-samples should be small. For this sample, the scatter in is similar range in , but smaller than the range in .
To get a rough estimate of the necessary catalog size, the number of galaxies needed to observe a difference in the red fraction of 0.1 is determined here. As errors in the colors are small in comparison, it is assumed that the scatter in the observed red fraction is given by , where is the true red fraction. In the case that two are close to 0.5, approximately 400 galaxies are needed in each sub-sample to observe a difference in the observed red fractions between them of 0.1 with 3 confidence. The scatter in is due to both variations in orbital and satellite parameter values, which vary within a single group, and to variations in the ICM parameter values, which vary across groups. Therefore, this estimate is only valid for a sample that includes a large number of groups. The SDSS group catalog contains 2700 groups, 15400 group galaxies, and 22500 isolated galaxies. It is large enough to place 400 galaxies into reasonable bins in and and has . In other words, the catalog is large enough to detect differences in the red fraction as small as 0.1 with reasonable significance. This demonstrates why observations of colors and SFRs in the SDSS groups are being used to search for the signal of ram pressure stripping rather than the more obvious approach of using H i observations. Potentially observing a trend due to ram pressure stripping requires observing thousands of galaxies, preferably across a wide range of satellite and group masses, with uniform determinations of galaxy mass or luminosity and group mass.
The catalog of SDSS groups used for this project covers a range of and in which stripping should occur and across which the degree of stripping should vary. The fraction of galaxies that belong to the red sequence will be focused on rather than average galaxy colors. This is mainly because residence in the red sequence and ram pressure stripping should be related in a more straight forward manner. It also simplifies comparisons between this project and others that use the galaxy color bimodality. The group catalog should be large enough to observe the signal of ram pressure stripping. The range in is larger than that in . Therefore, the change in across the range should be larger.
3.2. Gas Loss and the SFR
The model of ram pressure stripping presented in Paper 1 addresses the stripping of the outer H i disk. Galaxies can be stripped of their inner gas disk. However, this probably only happens to the smallest galaxies or in the highest density environments. As is seen in Paper 1 and reviewed above, ram pressure stripping of the outer gas disk occurs for a wide range of satellite masses and environments. In this paper, the colors of galaxies, rather than H i observations, are used to confront the predictions of the disk stripping model. It is therefore assumed that stripping of the outer H i disk affects galaxies’ future SFRs. This section discusses the likelihood that the outer gas disk fuels future star formation and the time scale on which the SFR should decline if this gas is removed.
While disk galaxies are currently forming stars from the gas in their inner disks, they cannot continue to form stars at their current rate for longer than a few Gyr unless this gas is replenished. Outside of groups star formation can be sustained by in-fall of new gas into and the continual cooling of the hot galactic halo. However, in almost any group environment, most galaxies are stripped of their hot galactic halo gas and experience no new in-fall. If the loss of this gas were responsible for the majority of the reddening seen in groups, then all but the brightest galaxies would be uniformly reddened in any group with an ICM. This is seen for semi-analytic models of galaxy colors which include galactic halo stripping and ignore the extended H i disk (Weinmann et al., 2006). In this scenario the SFR declines slowly as the galaxy consumes its inner gas disk.
Star formation may also be fed by the inflow of gas from the outer H i disk. Inflow is expected if there is any viscosity in the disk. In-falling gas should often join the outer H i disk, and feeding star formation with a viscous disk can be used to form exponential stellar profiles (Bell, 2002; Lin and Pringle, 1987a, b). Observationally, Gavazzi et al. (2006) find that late-type galaxies that are moderately deficient in H i as compared to galaxies with the same morphology and optical size also have low H equivalent widths for their morphology. If star formation is fed by gas in the outer gas disk, then galaxies in groups that retain this gas will be able to continue forming stars while galaxies that do not will experience a decline in their SFRs. In this case galaxies’ SFRs and colors should depend the effectiveness of ram pressure stripping.
When the gas disk is stripped down to the radius at which star formation is occurring, the time scale over which star formation declines is determined by the rate at which star formation consumes the gas disk. The timescale for the decline in the star formation rate can be defined as , where is the surface density of star formation. If is related to the gas surface density, , by a local Schmidt law, , then . Kennicutt (1998) found that . For of order a few , this relation gives of order a Gyr. If star formation is fed by inflow in the H i disk, galaxies in groups that retain a significant portion of their H i disk can continue to form stars. Galaxies that are stripped of their gas disks will experience a slow decline in their SFRs with a timescale of order a Gyr.
4. RESULTS AND DISCUSSION
In this section the properties of the group galaxies are compared to past observations of the relationship between galaxy properties and environment and to the model of ram pressure stripping presented in Paper 1. The timescale of the star formation decline occurring in the groups is also examined. In addition, the role of ram pressure stripping in determining more general trends in galaxy properties is discussed.
4.1. Comparison with Other Observation and with the Model
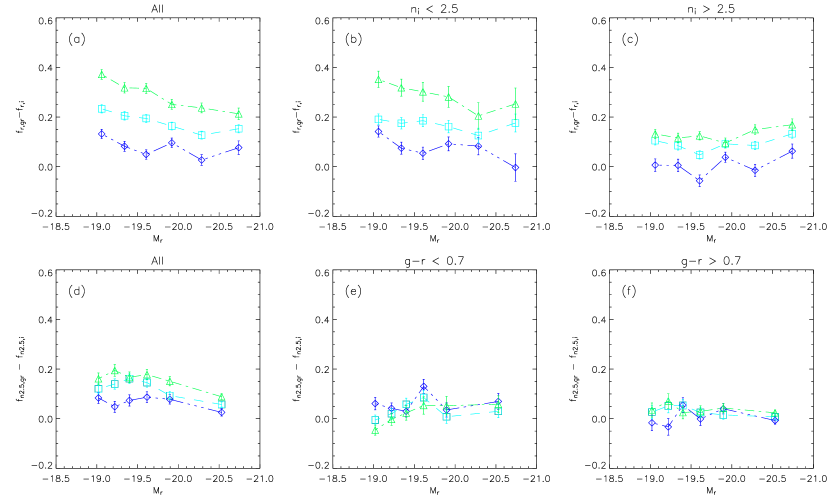
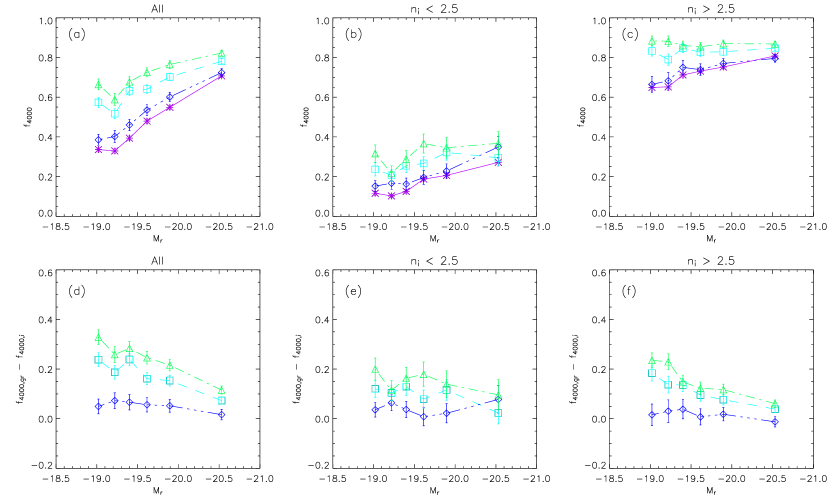
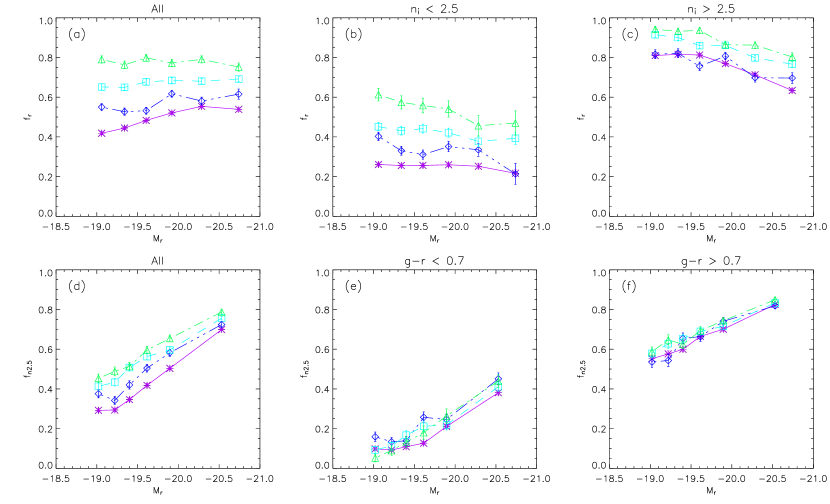
In Figures 1a-c, the fraction of galaxies that belong to the red sequence, , is plotted against the r-band absolute magnitude, . In Figures 1d-e the fraction of galaxies with , , is plotted. Figures 1a,d include all galaxies, 1b(c) includes only galaxies with (), and 1e(f) includes galaxies with (). Figure 2 consists of the same set of plots, only for the difference between or in the groups and in isolation, . In Figure 3, similar plots are made for the fraction of galaxies with large 4000Å breaks. The four lines correspond to isolated galaxies and galaxies in groups of , 13 - 14, and 13.5 - 14.5. Isolated galaxies are defined as galaxies that are either in singlets or pairs. The bins for Figures 1-4 are chosen such that the number of galaxies in the middle bin with blue colors is the same in each bin. This results in uniform errors across the bins. The plotted errors in Figures 1 and 3 are given by . These errors are propagated to determine the errors for Figures 2 and 4.
The observations presented in Figures 1 and 2 agree well with the previous observations discussed in § 1. Figures 1a,c and 2a,c show that both and increase with . As seen most clearly in Figure 2, the excess of galaxies with is smaller than the excess of red galaxies. Figure 3 demonstrates that the 4000Å break behaves similarly to the color. These relations are the group-based counterpart of the observations of Kauffmann et al. (2003b), Kauffmann et al. (2004), Blanton et al. (2005b), and Hogg et al. (2003) correlating these properties with local over-density. The large and in the groups will also increase the correlation function due to the higher clustering of groups compared to isolated galaxies. The increase in with still appears Figures 1b and 2b, which include only galaxies with . However, in Figures 1e and 2e, which include only blue galaxies, a difference in between groups of different mass is not seen. From this it can be concluded that the majority of galaxies responsible for the excess of galaxies in the groups are red, but the galaxies responsible for the excess of red galaxies do not all have . This asymmetry is reflected in the observation by Blanton et al. (2005b) that color is a better predictor of environment that Sersic index.
The analytic model of ram pressure stripping presented in Paper 1 predicts that should increase as increases and as decreases. An increase in as increases is clearly seen in Figures 1 and 2. In Figure 2a, a decrease in as increases can also be seen. While the difference between consecutive bins is small, for the two higher samples, a clear trend is seen across the range of and the difference in between the brightest and dimmest bins is several times the errors. For galaxies with , increases with and, for the highest bin, with . The trend in with for all galaxies is shallower in the middle bin and is not observed in Figure 2b. Possible reasons for this are given below and in § 4.3.
The observed differences in in the sub-population may not reflect true differences. Both the measurement errors for and the intrinsic scatter in the two modes are substantial. Galaxies that scatter out of the populations into the population have a higher red fraction than those scattering in the opposite direction, which tends to make the measured , , greater than the true value, . A consequence of this is that a change in can cause a change in while remains unchanged. In order to examine this effect and to determine the significance of the observed changes in the following definitions are made: let be the percentage of the true galaxies that scatter into the observed population, be the percentage of the true galaxies that scatter in the opposite direction, and be the true in the population. At fixed , and should not change with . With these definitions
| (2) |
and for small ,
| (3) |
A fortunate property of equation (3) is that for and , , which is a useful bound when . To make a conservative estimate of the size of that can be caused by the increase in with in the dimmest bin, let , , , , and . With these values, , which is significantly smaller than the observed change in between the low and high bins. Estimating the size of the induced change in with is less straight forward because , , and all change. For the highest bin, increases from to across the range. Again assuming that , the induced change in is
| (4) |
In general, scatter between the populations tends to make behave similarly to . Contrary to this expectation, while increases, decreases from to . If the scatter between the two populations decreases as increases, may decrease. However, producing the and observed without a decrease in requires a somewhat unrealistic decrease in . Assuming that both and are between 0.05 and 0.5, would need to decrease by at least 70% (for example, and or and can reproduce the observations with appropriate values of and ). It is therefore probable that both of the observed trends in are real. The decrease in with may contribute to erasing the shallow slope of the correlation of with between Figures 2a and 2b.
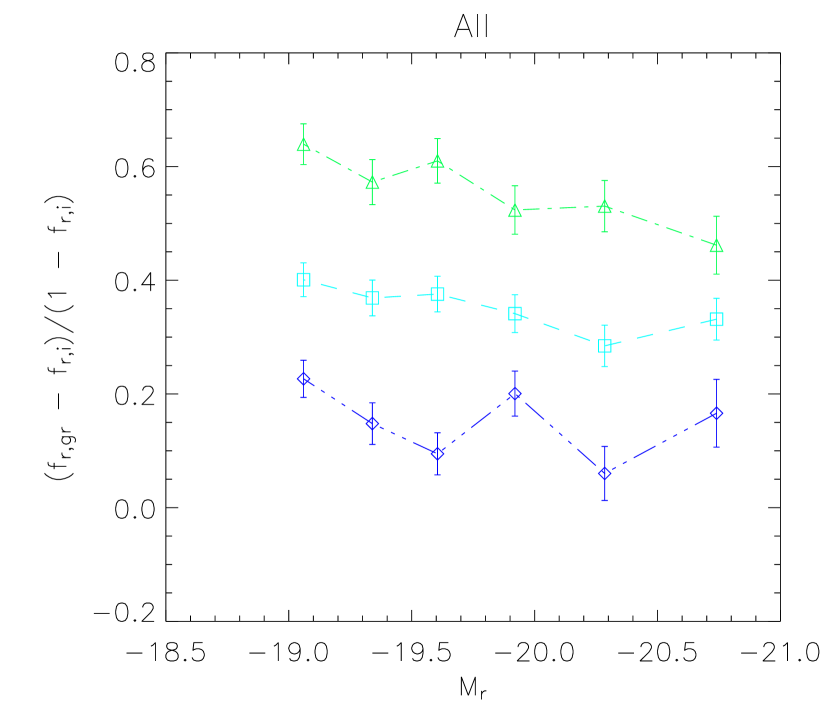
The model’s predictions refer specifically to the fraction of the in-falling blue disk galaxies that eventually join the red sequence rather than to the difference in between the group and isolated galaxies. In Figure 4 the difference between in the groups and in isolation is normalized by the blue fraction in isolation. This normalized difference is an estimate of the fraction of the in-falling blue galaxies that join the red sequence. It is a rough estimate because the properties of the isolated galaxies may not reflect those of the galaxies that actually joined the groups. The normalized difference increases with and for the higher bins decreases with , and the increase with is smaller than that with . According to the model of ram pressure stripping, the small size of the change in the normalized with results from the comparable sizes of the scatter in and the range of in the sample. Rather than an indication that ram pressure stripping is not occurring, the existence of a small change with is expected if stripping is occurring.
4.2. Timescale of the SFR Decline
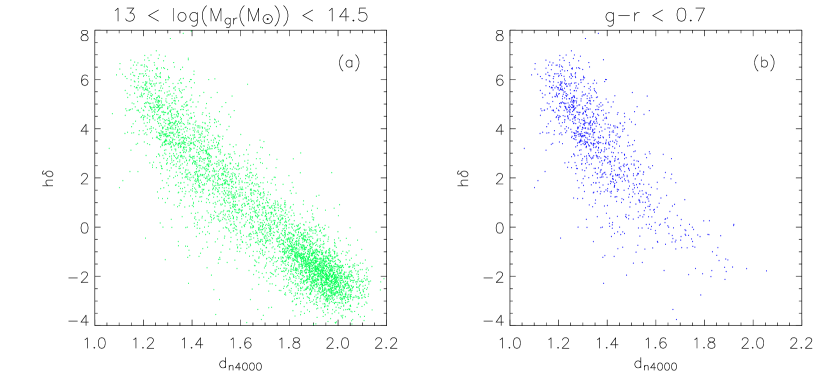
As discussed in § 3.2, the timescale over which a galaxy’s SFR should decline after the outer H i disk is stripped is of order a Gyr. Evolution of the SFRs on this timescale is consistent with the galaxies’ spectral indices remaining on the standard track in versus the 4000Å break, as seen in Kauffmann et al. (2004). However, it is inconsistent with lack of an observable shift in the SFR distribution for star forming galaxies seen in Balogh et al. (2004). Both of these tests are repeated here to determine whether color evolution in these groups is fast or slow.
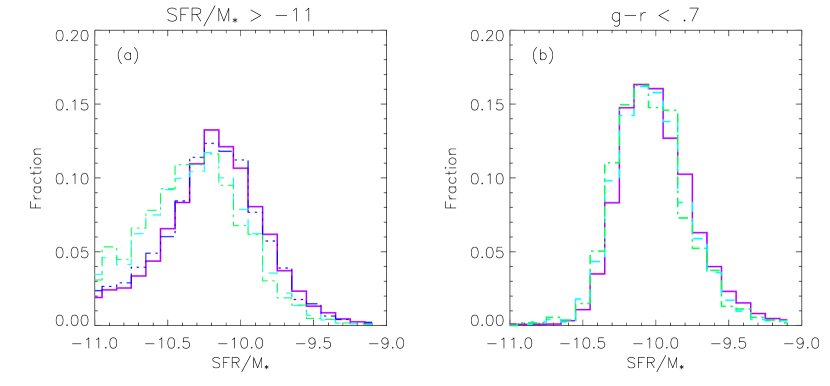
Figure 5 shows versus the 4000Å break for for all galaxies and for galaxies with . Compared to Figure 8 in Kauffmann et al. (2004), there is no excess of galaxies residing above the standard track, where a galaxy that has had its star formation abruptly truncated should lie. In Figure 6 distributions of are plotted. Figure 6a shows the distributions for star-forming galaxies, , and Figure 6b shows the distributions for galaxies with . For the medium and large bins, a clear shift in the distribution of is seen for the star-forming galaxies. A KS test gives a less than 0.01% probability that the distributions in the groups and in isolation are drawn from the same sample. Though less visually apparent, a slight shift also exists for the blue galaxies. The average is slightly lower in the groups than in isolation, and a KS test gives a 0.5% probability that they are drawn from the same distribution. These observations are consistent with a decline in the star formation rate on timescales of order a Gyr.
In Figure 6, the values from Brinchmann et al. (2004) are used rather than the equivalent widths, , which are used in Balogh et al. (2004). The are likely a better measure of the relative star formation rate in part because they measure rather than . The distributions presented here also differ from the Balogh et al. (2004) distributions in that group membership is used for all comparisons. When the distributions for all isolated and group galaxies with Å are compared, is lower for the group galaxies and a KS test rules out the possibility that the two populations are drawn from the same distribution. This results disappears when only galaxies with Å are considered. However, if the galaxies’ are divided by their ratios, as measured by Kauffmann et al. (2003a), then the difference in the distributions remain regardless of the cut used. In both instances a slight difference is also seen in the blue population, and a KS test gives a few percent chance that the blue group and isolated galaxies are drawn from the same population.
The size of any shift in the distribution of in the blue galaxy population is likely to be small. As can be seen in Figure 4, approximately half of the in-falling blue galaxies are unaffected by reddening. The distribution for blue galaxies is therefore a superposition of the unaffected blue galaxy population and a transiting population of blue galaxies with low SFRs that have not yet joined the red sequence. In addition, the difference in between an average in-falling blue galaxy, , and the at which galaxies appear to leave the blue population, , is small. Furthermore, the use of color to estimate the effect of the finite fiber size on biases against seeing a shift in in the blue galaxy population. The change in the average in the middle(high) bin is 0.04(0.06). If the decay in the SFR is exponential, then placing 20%(30%) of the blue galaxies halfway along a journey from their incoming to joining the red sequence will result in this shift. Therefore, a significantly larger shift in the than that observed for the blue group galaxies isn’t expected.
The location of the galaxies in this sample in the H versus 4000Å break plane and the relative distributions of for star-forming and blue galaxies in the groups versus in isolation both indicate that galaxies that transition between the blue and red populations experience a decline in their SFRs on long timescales. This is consistent with color evolution that is driven by the ram pressure stripping of gas from the outer H i disks of blue disk galaxies.
4.3. The Larger Picture
The differences observed in color and structure between the group and isolated galaxy populations can be summarized as follows. For both galaxies with and , the red fraction is larger in the groups than in isolation. This can be seen in Figures 1b,c and 2b,c. In addition, color selected galaxy populations have identical distributions both inside and outside groups (Fig. 1e,f & 2e,f; (Quintero et al., 2005)). In this section, the role that ram pressure stripping may play in this larger picture is discussed.
In isolation, for red galaxies and for galaxies with are both large. Therefore, for the color selected distributions in the groups to match those in isolation, the normalized difference in the red fraction between group and isolated galaxies, that is , must be larger for galaxies with than for galaxies with . In addition, though the distributions within color selected subsamples are identical in the group and isolated galaxy populations, the larger red fraction in the groups is accompanied by a larger fraction of galaxies with . Ram pressure stripping can create an excess of red galaxies in groups in both the and populations. In particular, because ram pressure stripping does not affect galaxies’ structures, it can transform a blue disk galaxy into a red disk. Furthermore, a greater fraction of the in-falling spherical galaxies that have gas will be stripped than of the in-falling disk galaxies. However, ram pressure stripping cannot account for the structural differences that are observed.
It is worth pointing out that, while in the most massive groups in this sample almost no mergers should occur, the merger rates in the low and medium-mass groups may be quite high (Mamon, 2000). In addition, N-body simulations show that a greater fraction of the halos that reside in clusters today underwent major mergers in their pasts (Göttlober et al., 2001). Therefore, the high-mass group galaxy population may have experienced an enhanced merger rate in the past while the low- and middle-mass group galaxy populations may be experiencing enhanced merger rates currently. In this light, Figure 2b becomes interesting. The slope of the correlation between and is shallower in the middle bin than in the high bin. Mergers may tend to wash out the dependence of on in the middle-mass groups while the dependence is preserved in the high-mass groups. A larger merger remnant fraction in the groups may, of course, also account for some of the structural differences observed in the group galaxy populations.
5. CONCLUSIONS
Observations of the red fraction, , the fraction of galaxies with a large 4000Å break, , and the fraction of galaxies with , , in the SDSS groups are presented in Figures 1 and 2. These are the group-based analog of previous observations and are consistent with the correlations between galaxy properties and local environment in Kauffmann et al. (2003b, 2004), Hogg et al. (2003), and Blanton et al. (2005b). In addition, the observed excess of red galaxies in the groups regardless of makes color a better predictor of environment, as observed in Blanton et al. (2005b).
In § 3.1 several predictions are made for the group sample using an analytical model of ram pressure stripping presented in Hester (2006). In general, the model predicts that the red fraction should increase as either the group mass, , increases or the satellite mass, , decreases. For the SDSS group sample in particular, it predicts that mild stripping should occur in the low-mass groups while moderate to severe stripping should occur in the middle- and high-mass groups. Therefore, differences in with both and are expected if ram pressure stripping is driving color change. The expected scatter in an effective mass for stripping at fixed is smaller than the range of present in the sample, but comparable to the range of . Therefore, in the stripping scenario, observed changes in with should be small while the change with should be larger. In addition, if stripping of the outer H i disk, along with the hot galactic halo, is causing the decline in SFRs in the groups, then the timescale of the decline should be of order a Gyr.
The predicted behaviors are observed in the group sample. As seen in Figures 1ab, 2ab, and 4, the red fraction increases with both and, for the higher mass groups, with for both all galaxies and galaxies with . This is despite a decrease in with . In the lowest mass groups, where only mild disk stripping is expected, the increase in is slight and may be due to galactic halo stripping alone. In Figure 4, an estimate of the fraction of the in-falling blue galaxies that join in the red sequence after entering a group is presented. This estimate is the best test of the model’s predictions for the sizes of the change in . As predicted, the change in across the range is quite small while the change across the range is significantly larger. As shown in Figures 5 and 6, the positions of the group members in the H versus 4000Å break plane and the distributions of for the star forming and blue galaxies both demonstrate that SFRs in the groups are declining on timescales greater than a Gyr. These observations all indicate that the observed color differences in the groups are the result of the ram pressure stripping of the outer H i disk followed by a gradual decline in the galaxies’ SFRs.
One alternate scenario for color evolution in groups postulates that the two dominate processes in groups are galactic halo stripping and mergers. The observed trends in Figures 1 and 2 do combine color change for galaxies at all values of and structural differences which are accompanied by color differences. If a galaxy’s structure is altered, for instance by a major merger, while it orbits in a group, then any remaining gas should be quickly stripped and the SFR should decline. In addition, if star formation in disk galaxies is fed only by the cooling of the galactic halo directly onto the star-forming disk, then the stripping of this halo will result in red galaxies at all and . Similar uniform reddening should be seen for spherical galaxies.
The observed trends in in Figures 1ab, 2ab, and 4 are an excellent match to predictions based on the ram pressure stripping model, which is in itself a strong indication that disk stripping plays a role in galaxy evolution in groups. However, the observation that the red fraction increases with group mass is particularly strong and can be used to differentiate between the scenario presented in the previous paragraph and the disk stripping scenario. In § 3.1, the model presented in Paper 1 is combined with an estimate of the maximum gas density that can be sustained in these galaxies in order to place an upper limit on the fraction of the hot halo gas that the galaxies can retain. All galaxies in both the middle- and high-mass groups should be stripped of the majority of their galactic halo gas. Considering the small mass of the remaining gas and the absence of any new in-falling gas, the remaining galactic halo cannot continue to feed star-formation in any of these galaxies. This would lead to the expectation that should not depend on either or in these groups. This loose theoretical expectation is affirmed by simulations. In N-body based semi-analytic models in which star formation is shut off when satellite galaxies enter a group, the red fraction in groups is independent of (Weinmann et al., 2006). However, in Figure 1b a substantial difference in is seen for groups of different . This difference, which is unexpected and must be rationalized in the strangulation scenario, is easily understood in the disk stripping scenario.
The observations presented in this paper favor ram pressure stripping of the outer H i disk as the dominant driver of color change for disk galaxies in groups. Despite this, other processes must occur at some level. Galaxies in groups are expected to undergo mergers and some merging galaxies will have retained their H i disks. In the dense inner regions of clusters stripping of gas from within the stellar disk should occur on occasion. Finally, even galaxies that retain their disks are stripped of their galactic halo and will eventually experience a decline in the SFRs. However, for the low redshift groups studied here, ram pressure stripping appears to be driving the relationships between SFR, color, , and environment.
Sorting out which processes are dominant for different and at different redshifts will require combining further modeling and observations. To determine the importance of ram pressure stripping it is most important to understand how galaxies fuel their star formation. Understanding trends like those shown in Figures 1 and 2 will also require understanding the processes that can alter structure.
6. ACKNOWLEDGEMENTS
This project was advised by D. N. Spergel and funded by NASA Grant Award #NNG04GK55G. I’d like to thank A. Berlind, M. Blanton, and D. Hogg for the use of the SDSS group catalog and for useful discussions.
Funding for the Sloan Digital Sky Survey (SDSS) has been provided by the Alfred P. Sloan Foundation, the Participating Institutions, the National Aeronautics and Space Administration, the National Science Foundation, the U.S. Department of Energy, the Japanese Monbukagakusho, and the Max Planck Society. The SDSS Web site is http://www.sdss.org/.
The SDSS is managed by the Astrophysical Research Consortium (ARC) for the Participating Institutions. The Participating Institutions are The University of Chicago, Fermilab, the Institute for Advanced Study, the Japan Participation Group, The Johns Hopkins University, the Korean Scientist Group, Los Alamos National Laboratory, the Max-Planck-Institute for Astronomy (MPIA), the Max-Planck-Institute for Astrophysics (MPA), New Mexico State University, University of Pittsburgh, University of Portsmouth, Princeton University, the United States Naval Observatory, and the University of Washington.
References
- Abadi et al. (1999) Abadi, M. G., Moore, B., & Bower, R. G. 1999, MNRAS, 308, 947
- Baldry et al. (2004) Baldry, I. K., Glazebrook, K., Brinkman, J., Ivezić, Ž., Lupton, R. H., Nichol, R. C., Szalay, A. S. ApJ, 2004, 600, 681
- Balogh et al. (2004) Balogh, M., et al. 2004, MNRAS, 348, 1355
- Bell (2002) Bell, E.F. 2002, ApJ, 581, 1013
- Berlind et al. (2006) Berlind, A. A., et al. 2006, ApJS, 167, 1
- Blanton et al. (2003a) Blanton, M. R., et al. 2003a, ApJ, 594, 186
- Blanton et al. (2003b) Blanton, M. R., et al. 2003b, AJ, 125, 2348
- Blanton et al. (2003c) Blanton, M. R., et al. 2003c, ApJ, 592, 819
- Blanton et al. (2003d) Blanton, M. R., Lin, H., Lupton, R. H., Maley, F. M., Young, N., Zehavi, I., & Loveday, J. 2003d, AJ, 125, 2276
- Blanton et al. (2005a) Blanton, M. R., et al. 2005a, AJ, 129, 2562
- Blanton et al. (2005b) Blanton, M. R., Eisenstein, D., Hogg, D.W., Schlegel, D. J., & Brinkmann, J. 2005b, ApJ, 629, 143B
- Bravo-Alfaro et al. (2000) Bravo-Alfaro, H., Cayatte, V., van Gorkom, J., & Balkowski, C. 2000, AJ, 119, 580
- Brinchmann et al. (2004) Brinchmann, J., Charlot, S., White, S. D. M., Tremonti, C., Kauffmann, G., Heckman, T., & Brinkmann, J. 2004, MNRAS, 351, 1151
- Cayatte et al. (1994) Cayatte, V., Kotanyi, C., Balkowski, C., & van Gorkom, J. H. 1994, AJ, 107, 1003C
- Dressler (1980) Dressler, A. ApJ, 236, 351, 1980
- Eisenstein et al. (2001) Eisenstein, D. J., et al. 2001, AJ, 122, 2267
- Fukugita et al. (1996) Fukugita, M., Ichikawa, T., Gunn, J. E., Doi, M., Shimasaku, K., & Schneider, D. P. 1996, AJ, 111, 1748
- Gavazzi et al. (2006) Gavazzi, G., Boselli, A., Cortese, L., Arosio, I., Gallazzi, A., Pedotti, P., & Carrasco, L. 2006, A&A, 446, 839
- Giovanelli & Haynes (1983) Giovanelli, R. & Haynes, M. P. 1983, AJ, 88, 881G
- Gomez et al. (2003) Gomez, P. L., et al. 2003, ApJ, 584, 210
- Goto et al. (2003) Goto, T., Yamauchi, C., Fujita, Y., Okamura, S., Sekiguchi, M., Smail, I., Bernardi, M., & Gomez, P. L. 2003, MNRAS, 346, 601G
- Göttlober et al. (2001) Göttlober, S., Klypin, A., & Kravtsov, A. V. 2001, ApJ, 546, 223
- Gunn & Gott (1972) Gunn, J. E. & Gott, J. R. 1972, ApJ, 176, 1
- Hester (2006) Hester, J. A. 2006, ApJ, 647, 910.
- Hogg et al. (2001) Hogg, D. W., Finkbeiner, D. P., Schlegel, D. J., & Gunn, J. E. 2001, AJ, 122, 2129
- Hogg et al. (2003) Hogg, D. W., et al. 2003, ApJ, 585, L5
- Ivezić et al. (2004) Ivezić, Ž., et al. 2004, Astonomische Nachrichten, 325, 583
- Kauffmann et al. (2003a) Kauffmann, G., et al. 2003a, MNRAS, 341, 33
- Kauffmann et al. (2003b) Kauffmann, G., et al. 2003b, MNRAS, 341, 54
- Kauffmann et al. (2004) Kauffmann, G., White, S. D. M., Heckman, T. M., Menard, B., Brinchmann, J., Charlot, S., Tremonti, C., & Brinkmann, J. 2004, MNRAS, 353, 713
- Kennicutt (1998) Kennicutt, R. C. 1998, ApJ, 498, 541
- Kenney et al. (2004a) Kenney, J. D. P., Crowl, H., van Gorkom, J., & Vollmer, B. 2004, IAUS, 217, 370K
- Kenney & Koopman (1998) Kenney, J. D. P., & Koopmann, R. A. 1998, AJ, 117, 181K
- Kenney et al. (2004b) Kenney, J. D. P., van Gorkom, J., Vollmer, B. 2004, AJ, 127, 3361K
- Li et al. (2006) Li, C., Kauffmann, G., Jing, Y. P., White, S. D. M., Borner, G., & Cheng, F. Z. 2006, MNRAS, 368, 37
- Lin and Pringle (1987a) Lin, D. N. C. & Pringle, J. E. 1987a, ApJ, 320, L87
- Lin and Pringle (1987b) Lin, D. N. C. & Pringle, J. E. 1987b, MNRAS, 225, 607
- Lupton et al (2005) Lupton, R. H., Gunn, J. E., Ivezić, Ž., Knapp, G. R., Kent, S., & Yasuda, N. 2001, in ASP conf. Ser. 238: Astronomical Data Analysis Software and Systems X, 269
- Mamon (2000) Mamon, G. A. 2000, in ASP Conf. Ser. 197, Dynamics of Galaxies: From the Early Universe to the Present, ed. F. Combes, G. A. Mamon, & V. Charmandaris (San Fransisco: ASP), 377
- Maraston (1998) Maraston, C. 1998, MNRAS, 300, 872
- Marcolini et al. (2003) Marcolini, A., Brighenti, F., & D’Ercole, A. 2003, MNRAS, 345, 1329
- Moore et al. (1998) Moore, B., Lake, G., & Katz, N. 1998, ApJ, 495, 139
- Pier et al. (2003) Pier, J. R., Munn, J. A., Hindsley, R. B., Hennessy, G. S., Kent, S. M., Lupton, R. H., & Ivezić, Ž. 2003, AJ, 125, 1559
- Quilis et al. (2000) Quilis, V., Moore, B., & Bower, R. 2000, Science, 288, 1617
- Quintero et al. (2005) Quintero, A. D., Berlind, A. A., Blanton, M. R., & Hogg, D. W., 2006, ApJ, submitted
- Richards et al. (2002) Richards, G. T., et al. 2002, AJ, 123, 2945
- Roediger & Hensler (2005) Roediger, E. & Hensler, G. 2005, A&A, 433, 875R
- Schlegel, Finkbbeiner, & Davis (1998) Schlegel, D. J., Finkbeiner, D. P., & Davis, M. 1998, ApJ, 500, 525
- Sanderson & Ponman (2003) Sanderson, A. J. R. & Ponman, T. J. 2003, in Clusters of Galaxies: Probes of Cosmological Structure and Galaxy Evolution, ed. J. S. Mulchaey, A. Dressler, & A. Oemler (Pasadena: Carnegie Observatories)
- Schulz & Struck (2001) Schulz, S. & Struck, C. 2001, MNRAS, 328, 185
- Smith et al. (2002) Smith, J. A., et al. 2002, AJ, 123, 2121
- Solanes et al. (2001) Solanes, J. M., Manrique, A., Garcia-Gomez, C., Gonzalez-Casado, G., Giovanalli, R., & Haynes, M. P. 2001, ApJ, 548, 97
- Strateva et al. (2003) Strateva, I., et al. 2003, ApJ, 122, 1861
- Strauss et al. (2002) Strauss, M. A., et al. 2002, AJ, 124, 1810
- Swaters et al. (2002) Swaters, R. A., van Albada, T. S., van der Hulst, J. M., & Sancisi, R. 2002, A&A, 390, 829
- Weinmann et al. (2006) Weinmann, S. M., van den Bosch, F. C., Yang, X., Mo, H. J., Croton, D. J., & Moore, B. 2006, MNRAS, 372, 1161
- York et al. (2000) York, D. G., et al. 2000, AJ, 120, 1579