2 Dunsink Observatory, Castleknock, Dublin 15, Ireland;
3 INAF, Osservatorio Astronomico di Brera, via E. Bianchi 46, 23807 Merate (LC), Italy;
4 Universita’ di Milano Bicocca, Piazza della Scienza 3, 20126 Milano, Italy.
5 Astronomic Research Institute, Liverpool John Moores University, Twelve Quays House, Egerton Wharf, Birkenhead, CH41 1LD, UK;
6 School of Physical Sciences and NCPST, Dublin City University, Glasnevin, Dublin 9, Ireland
7 CEA Saclay, DSM/DAPNIA/Service d’Astrophysique, Bat. 709, L’Orme des Merisiers, 91191 Gif-sur-Yvette, Cedex, France;
8 JILA, Campus Box 440, University of Colorado, Boulder, CO 80309-0440, USA;
9 NASA-Goddard Space Flight Center, Greenbelt, Maryland, 20771, USA;
10 Department of Astronomy and Astrophysics, Pennsylvania State University, University Park, Pennsylvania 16802, USA;
11 ASI Science Data Center, Via G. Galilei, I-00044, Frascati(Roma), Italy;
12 INAF-Osservatorio Astronomico di Arcetri, Largo E. Fermi 5, 50125, Firenze, Italy;
13 INAF-Roma, Via Fosso del Cavaliere 100, I-00133, Roma, Italy;
14 INAF-Istituto di Astrofisica Spaziale e Fisica Cosmica di Palermo, Via U. La Malfa 153, I-90146, Palermo, Italy;
15 Universita’ di Ferrara, Via Paradiso 12, 44100, Ferrara, Italy;
16 UMR 7164, 11 Place M. Berthelot, 75231, Paris, France;
17 International School for Advanced Physics, Via Beirut 2-4, I-34014, Trieste, Italy;
18 European Southern Observatory, Casilla 19001, Santiago, Chile;
19 PPARC, Polaris House, North Star Avenue, Swindon SN2 15Z, UK;
20 INAF-Istituto di Astrofisica Spaziale e Fisica Cosmica, Via Bassini, 15, I-20133, Milano, Italy;
21 European Southern Observatory-Vitacura, Casilla 19001, Santiago 19, Chile;
22 Scuola Normale Superiore, Piazza dei Cavalieri 7, 56126, Pisa, Italy;
UVES/VLT high resolution spectroscopy of GRB 050730 afterglow: probing the features of the GRB environment ††thanks: Based on observations collected at the European Southern Observatory, ESO, the VLT/Kueyen telescope, Paranal, Chile, in the framework of programs 075.A-0603
Abstract
Aims. The aim of this paper is to study the Gamma Ray Burst (GRB) environment through the analysis of the optical absorption features due to the gas surrounding the GRB.
Methods. To this purpose we analyze high resolution spectroscopic observations (R=20000-45000, corresponding to 14 km/s at 4200Å and 6.6 km/s at 9000Å) of the optical afterglow of GRB050730, obtained with UVES@VLT hours after the GRB trigger.
Results. The spectrum shows that the ISM of the GRB host galaxy at z = 3.967 is complex, with at least five components contributing to the main absorption system. We detect strong C II*, Si II*, O I* and Fe II* fine structure absorption lines associated to the second and third component.
Conclusions. For the first three components we derive information on the relative distance from the site of the GRB explosion. Component 1, which has the longest wavelength, highest positive velocity shift, does not present any fine structure nor low ionization lines; it only shows very high ionization features, such as C IV and O VI, suggesting that this component is very close to the GRB site. From the analysis of low and high ionization lines and fine structure lines, we find evidences that the distance of component 2 from the site of the GRB explosion is 10-100 times smaller than that of component 3. We evaluated the mean metallicity of the z=3.967 system obtaining values of the solar metallicity or less. However, this should not be taken as representative of the circumburst medium, since the main contribution to the hydrogen column density comes from the outer regions of the galaxy while that of the other elements presumably comes from the ISM closer to the GRB site. Furthermore, difficulties in evaluating dust depletion correction can modify significantly these values.
The mean [C/Fe] ratio agrees well with that expected by single star-formation event models. Interestingly the [C/Fe] of component 2 is smaller than that of component 3, in agreement with GRB dust destruction scenarios, if component 2 is closer than component 3 to the GRB site.
Key Words.:
gamma rays: bursts - cosmology: observations - galaxies: abundances - ISM1 Introduction
For a few hours after their onset, Gamma Ray Bursts (GRBs) are the brightest beacons in the far Universe, offering a superb opportunity to investigate both GRB physics and high redshift galaxies. Tens of minutes after a GRB, its optical afterglow can be as bright as magnitude 13–15. High resolution (a few tens of km/s in the optical band), high quality (signal to noise per resolution element) spectra can therefore be gathered, provided that the afterglow is observed on such a short time scale by 8m class telescopes.
Fiore et al. (2005) studied the UVES high resolution spectroscopy of GRB020813 and GRB021004 afterglows; they showed that the InterStellar Medium (ISM) of GRB host galaxies is complex when resolved down to a width of a few tens of km/s, with many components contributing to each main absorption system, and spanning a total velocity range of up to thousands of km/s. Velocity ranges of hundreds of km/s were found on the high resolution spectra obtained with MIKE@MagellanII and HIRES@Keck on GRB051111 and GRB050730 (Chen et al. 2005, Prochaska, Chen & Bloom 2006, PCB06 hereafter, Penprase et al. 2006).
The absorption systems can be divided into three broad categories. First, those associated with the GRB surrounding medium, second, those produced by the ISM of the host galaxy along the line of sight but distant enough not to be strongly modified by the GRB, and third the intergalactic matter along the line of sight. We discuss these three systems in turn.
The physical, dynamical and chemical status of the circumburst medium in the star-forming region hosting the GRB progenitor can be modified by the explosive event, through shock waves and ionizing photons. Blueshifted absorbers may be ionized and even radiatively and/or collisionally accelerated by the GRB and its afterglow. Circumstellar absorption lines in gamma-ray burst afterglow spectra can be used to determine the main properties of the star progenitors (van Marle, Langer,& Garcia-Segura 2005). The variability of the intensity of absorption lines can be used to determine the location and density of the absorber, following Perna & Loeb (1998), Boettcher, Fryer & Dermer (2002), Draine & Hao (2002), Mirabal et al. (2002), Perna & Lazzati (2002), Perna, Lazzati & Fiore (2003). The temperature and density of the absorbing gas can be also accurately determined by studying particular line ratios, namely those of a fine structure transition to its ground state.
High resolution spectra do not reveal only the circumburst matter. They can also be used to probe the ISM of the host galaxy along the line of sight. The study of the ISM of z galaxies has so far relied upon Lyman-break galaxies (LBGs) at z (see e.g. Steidel et al. 1999) and galaxies which happen to be along lines of sight to bright background quasars (QSOs). However, LBGs are characterized by pronounced star-formation and their inferred chemical abundances may be related to these regions rather than being representative of typical high-z galaxies. Faint metal line systems along the line of sight to quasars probe mainly galaxy haloes, rather than their bulges or discs. Taking advantage of ultra-deep Gemini multi-object spectrograph observations, Savaglio et al. (2004, 2005) studied the ISM of a sample of faint K band selected galaxies at 1.4z2.0, finding MgII and FeII abundances much higher than in QSO systems and similar to those in GRB host galaxies. Such studies will hardly be extended to higher redshift with the present generation of 8m class telescopes, because of the faintness of high-z galaxies. On the other hand, GRB afterglows provide an independent tool to study the ISM of high z galaxies.
Finally, GRB afterglow high resolution spectra can be used to probe the Ly- forest and the high-z intergalactic medium. Using GRBs as remote beacons opens up the opportunity to highlight any deviation from what is already known from quasar forests. For example the so-called “proximity effect” (the feedback of QSOs on their local IGM) should be much reduced for GRBs.
The need to disentangle the contribution to the absorption spectra coming from these three different categories renders high resolution spectroscopy the ideal technique to study GRB optical afterglows.
Therefore we set up a program to observe bright optical afterglows of promptly localized GRBs with UVES@VLT, taking advantage of the capabilities of the GRB-dedicated Swift satellite. Swift was launched in November 2004, and provides GRB positions ( precision) in s, X–ray afterglow positions ( precision) in s, and an optical finding chart in s (few arcsec to sub-arcsec positional accuracy). These characteristics, together with the possibility of quick follow-up with UVES@VLT in RRM (Rapid Response Mode), offers the opportunity to obtain high resolution spectra of GRBs with delays from a few hours down to a few tens of minutes from the event.
To date, five GRBs have been observed with UVES@VLT after a Swift trigger: GRB050730, GRB050820A, GRB050922C, GRB060418 and GRB060607A.
In this paper, we present high resolution spectroscopy of GRB050730. This GRB was detected by Swift on 2005 July 30 19:58:23 UT (Holland et al. 2005, Sota et al. 2005) at RA(J2000) and DEC(J2000) . seconds later, Swift’s XRT started to observe the X-ray afterglow in WT mode (Barthelmy et al. 2005). Chen et al. (2005) found the redshift of the GRB at with the MIKE echelle spectrograph on Magellan II, starting the observation hours after the burst. The redshift was confirmed by Rol et al. (2005) using the ISIS spectrograph on the William Herschel Telescope at the Observatorio del Roque de los Muchachos on La Palma.
Starling et al. (2005) show an early WHT ISIS optical spectroscopy of GRB050730, finding that the host is a low metallicity galaxy, with low dust content. PCB06 present an analysis of the MIKE high resolution spectrum of GRB050730, treating the various absorption features as single Voigt profiles. Our main goal is instead that of trying to disentangle the relative contribution of the various components (in velocity space) contributing to each absorption system, making a step forward with respect to Chen, et al. (2005) and PCB06.
We focus here on the study of the local medium surrounding the GRB, and in particular on the analysis of the fine structure absorption lines produced by the gas in the host galaxy. The comparison of such absorption features and their corresponding ground states yields information about the gas density, the temperature and the radiation field. A detailed analysis of the intervening absorption systems and of the Ly- forest will be presented in a forthcoming paper.
The paper is organized as follows. Section presents the observations and data reduction; Section gives a brief description of the absorbing systems identified from the spectra; Section is devoted to the analysis of the fine structure lines and to the estimate of the physical quantities characterizing the host galaxy gas; in Section the results are discussed and conclusions are drawn.
2 Observations and data reduction
In the framework of ESO programs 075.A-0603 we observed the afterglow of GRB050730 with the high resolution UV-visual echelle spectrograph (UVES, Dekker et al. 2000), mounted at the VLT-UT2 telescope. Table 1 gives the log of the observations. Both UVES dichroics were used, employing the red as well as the blue arm. This allowed us to achieve a particularly wide spectral coverage, extending from 3200Å to 9500Å. In order to maximize the signal to noise ratio the CCD was rebinned by pixels. The data reduction has been performed using the UVES pipeline (Ballester et al. 2000). The final useful spectra extend from about 3750Å to about 9780Å and were rebinned to 0.1Å. The resolution element, set to two pixels, ranges then from 14 km/s at 4200Å to 6.6 km/s at 9000Å. The noise spectrum, used to determine the errors on the best fit line parameters, has been calculated from the real, background subtracted and rebinned spectrum, using line free regions. This therefore takes into account both statistical errors and systematic errors in the pipeline processing as well as the background subtraction.
| Date UT | Dichroic | B. Arm C.W. | R. Arm C.W. | slita | seeinga | exposureb | time since GRBc |
|---|---|---|---|---|---|---|---|
| 07/31/05 00:07:17 | 1 | 3460Å | 5800Å | 1 | 50 | 4.15 | |
| 07/31/05 01:02:09 | 2 | 4370Å | 8600Å | 1 | 50 | 5.07 |
aarcsec; bmin; chr
3 Absorbing systems
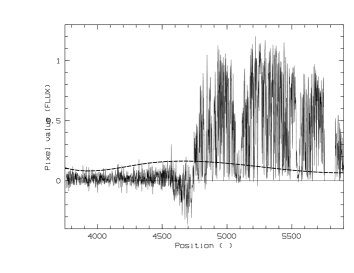
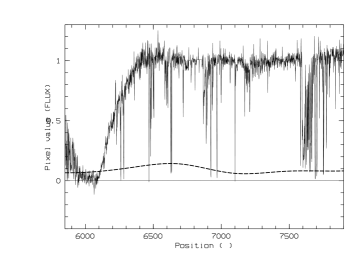
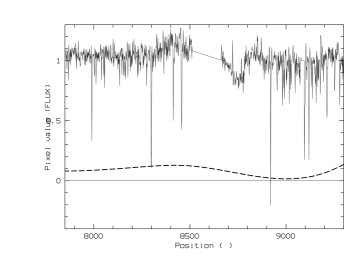
Fig. 1 shows the high resolution spectrum of GRB050730, with a cut-off at both the bluemost and redmost end, where the signal-to-noise ratio becomes too small. The spectrum exhibits a large number of absorption features, belonging to different absorption systems. The main system is due to the gas in the host galaxy, at redshift . This value confirms the previous redshift determinations for this GRBs. We identified four more intervening absorbers at not related to the GRB host galaxy but rather to galaxies along the line of sight. Each system is briefly described in the next subsections.
3.1 The host environment at
This is the system with the greatest number of features on the GRB line of sight. Fig. 1 clearly shows the Ly- absorption at Å. The redshift inferred from this feature is confirmed by a large number of metal-line transitions. The precise value, which we calculated from the analysis of the narrowest lines associated with the host galaxy, is . The spectrum exhibits a large number of absorption lines, from neutral hydrogen (Ly-, Ly-, Ly-), via neutral metal-absorption lines (O I) and low ionization lines (C II, Si II, Al II, Ni II, Fe II, P II, S II) to high-ionization absorption features (C IV, Si IV,N V, O VI). In addition, strong fine structure lines (C II*, Si II*, O I* O II**, Fe II*, Fe II**, Fe II***) have been identified, meaning either that the GRB environment is composed of a high density gas or that an intense radiation field is exciting such features.
The ISM of the host galaxy is complex, with many components contributing to the absorption system. This complex environment, together with a detailed study of the fine structure lines aimed at estimating the physical quantities of the circumburst gas, will be described in the next section.
3.2 The intervening absorber at
This system presents neutral hydrogen features (Ly-, Ly-), neutral metal-absorption lines (C I, Si I), low ionization lines (Al II, Mg II, Si II, Fe II) and high ionization lines (C IV, Si IV, N V). The redshift calculated from these features is .
3.3 The intervening absorber at
This system presents only a few neutral metal-absorption lines (OI, SiI, AlI) and some low ionization transitions (Al II, Fe II). The redshift of this system is .
3.4 The intervening absorber at
This is actually a double absorption system, the redshifts of the two components being and . It shows neutral metal-absorption lines (Si I, Mg I), low ionization transitions (Si II, Fe II, Mg II) and possibly a C IV high ionization line.
3.5 The intervening absorber at
This is another double absorption system, the redshifts of the two components being and . The system shows neutral metal-absorption lines (Mg I, Fe I) and low ionization transitions (Mg II, Fe II).
4 The main system at z=3.967: physical properties of the GRB environment
This section, as well as the rest of the paper, is devoted to the study of the main absorption feature of the spectrum, produced by the gas in the host environment, located close to the GRB explosion site.
The analysis of the GRB environment is intricate due to the complexity of the absorption lines of the spectrum, which in several cases can hardly be fitted with a single Voigt profile. This means that many components contribute to the gas in the GRB environment. In other words, several shells of gas which may be close to or far from each other, appear mixed together in the spectrum (in velocity space). Our main goal is to disentangle their relative contribution.
The identification of the components of the absorption lines and the fitting procedures will be discussed in the next subsection.
4.1 Absorption features of the GRB environment
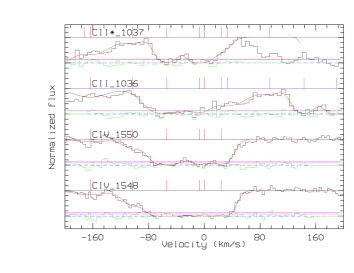
The gas surrounding the GRB constitutes a complex environment, and this is reflected in the complexity of the absorption features. The presence of several components is indicative of clumpy gas in the GRB environment, composed of different absorbing regions each with different physical properties. For example, a first component is present for the high ionization lines O VI and (less intensely) C IV, but not for Si IV and lower ionization lines (Fig. 2). This means that this particular component probably comes from a region very close to the GRB site, where it experienced a very intense flux of radiation ionizing the atoms several times.
If the absorption features are treated as a single Voigt profile, we obtain very bad fitting parameters and very high values. The identification of the different components is somewhat subjective, the true message being that the geometry and kinematics of the ISM clouds probed by the GRB line of sight are complex. We decided to use the C IV 1548,1550 Å and Si IV 1393,1402 Å doublets, which have the wider velocity range, to identify the different components constituting the circumburst matter. Fig. 2 shows C IV 1550 Å at . For this line we obtain a good fit () if we assume that five different components contribute to the absorption features.
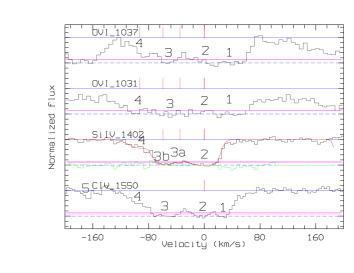
In the following, the components are numbered so that the first component is the one with the longest wavelength and the highest, positive, velocity shift with respect to a zero point arbitrarily placed at z=3.96764, and so on. We next fixed the redshifts of the C IV components and tried to fit the Si IV doublet with the same five Voigt profiles. We did not obtain a good fit for the following reasons. First, the Si IV doublet does not exhibit the first and the last components that we see in the C IV (i.e., there are only three components), and second, a single central component is not enough to model the central part of the Si IV features alone. More precisely, the central component (number 3) must be splitted in two parts (3a and 3b) in order to obtain a good fit for Si IV; infact, such a feature does not show saturation in its central part, while C IV does. This is clearly visible especially for Si IV 1402 Å (Fig. 2). Thus, using four components to represent Si IV, the first and the last being fixed at the redhift of the second and the fourth of C IV, we obtain a good fit () for this feature. All the further features we analyzed have been fitted fixing the redshift of the components to those we identified for either C IV or Si IV. Case by case, we decided to fit groups of elements with either C IV or Si IV, the choice depending on the extension of the lines and the saturation of the central part of the features. We specify that in these fitting procedures, the redshift of the components has been linked to that of C IV or Si IV, which in turn has been fixed to the values we find in the C IV and Si IV fit. Similarly, the column densities and Doppler parameters of the components of C IV and Si IV has been fixed while fitting these pilot lines together with other ones.
Finally, since the two central components of Si IV (3a and 3b) can not be resolved in the case of C IV, the corresponding column densities are computed separately, but summed together in the analysis as if we were dealing with a single component.
We detected several absorption fine structure features in the spectrum at the GRB redshift. The gas can be excited to such states via collisional effects (if the density is sufficiently high) or by the absorption of UV photons followed by the spontaneous radiative decay to an excited level of the ground state. Such lines can be very important in determining some physical properties of the gas, and thus we will consider them carefully. The next sub-subsections describe the fits we performed to obtain the column densities of the elements that show fine structure transitions. The column densities corresponding to each component are reported in Table 2 and 3.
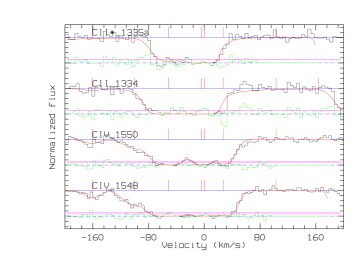
4.1.1 The ion CII
For this ion, we identified two fine structure doublets, namely C II 1036 Å C II* 1037 Å and C II 1335 Å C II* 1337 Å. We fitted these doublets together with C IV (Figs. 3 and 4). We note that only the second and third components out of the five in the fits in Figure 2 are present in the excited fine structure levels, with a possible indication of the first component for C II* 1037 Å. The fifth component, which is the one with the lowest redshift, is present only for C II 1036 Å; the blending of C II* 1037 Å by C II 1036 Å. makes impossible to say whether this component is present in the excited level or not. The C II 1335 Å doublet appears to be saturated; this is evident by looking at the best fit, which is completely flat in the center of this line complex. Therefore, we use only the C II 1036 Å doublet to evaluate the electron density and temperature.
4.1.2 The ion SiII
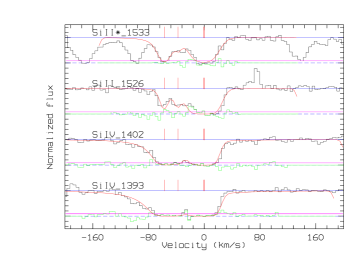
For this ion, we identified three fine structure doublets: Si II 1304 Å (Si II* 1309 Å), Si II 1526 Å (Si II* 1533 Å) and Si II 1260 Å (Si II* 1265 Å). We fitted the first two doublets together with Si IV (Figs. 5 and 6). The first of these doublets has been fitted with the OI fine structure triplet too.
The third doublet falls in the Ly- absorption gap. A reliable analysis of this feature is difficult because a correct subtraction of the continuum is not possible. Moreover, the excited level is further splitted into two sublevels, which blend with each other and render it impossible to fit the contribution of the various components.
As for CII, only the second and possibly the third component is present in the excited fine structure levels. Finally, the third component of the Si II* 1533 Å, if present, would fall in a region rich of telluric features, and thus can hardly be useful in determining the physical parameters of the gas.
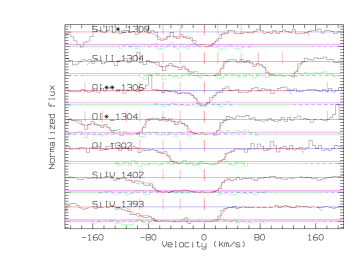
4.1.3 The atom OI
This atom is present with the O I 1302,1304*,1306** Å fine structure triplet (Fig. 5). It has been fitted with a four component profile, together with the Si IV components and the Si II 1304,1309* Å fine structure doublet. As for previous ions, the only components present in the excited fine structure levels are the second and the third (splitted in 3a and 3b). The second component appears to be saturated both in the ground and in the first excited level O I 1304* Å, and will not be used in the analysis.
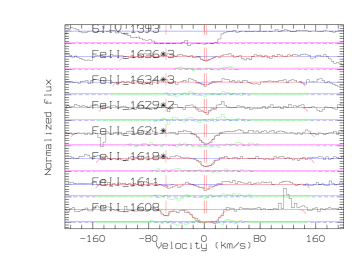
4.1.4 The ion FeII
This ion is present in a wide variety of flavors. In this paper, we concentrate on the fine structure multiplet around Å. This multiplet shows the following absorption features: Fe II 1608 Å, Fe II 1611 Å, Fe II* 1618 Å, Fe II* 1621 Å, Fe II** 1629 Å, Fe II*** 1634 Å, Fe II*** 1636 Å. Fig. 7 presents the multiplet, together with the Si IV 1393 Å absorption feature.
We can see that the Fe II excited levels only show the second component, while the ground state also includes the third component. We obtain a good fit with a single Voigt profile for the excited levels and a double line profile for the ground state. The central wavelengths of these Voigt profiles have been fixed to the redshifts of the second and third components of C IV.
In the next subsections we will describe in detail the physics which relates the fine structure transitions to the density and temperature of the gas that produces these features (provided that the fine levels are excitated by collisional effects).
4.2 Fine structure line excitation via collisions
For ions with a doublet fine structure in the ground state, the ratio between the population density of the higher and the lower level is:
where and are the collision rates from level 1 to level 2 and vice versa, and () is the photon absorption (decay) rate between the two levels (Bahcall & Wolf 1968). and can be written in the form , where each kind of exciting particle (proton, electron, etc.) is denoted by , is the collisional cross section for the process involving the -th species, whose density and average speed are and , respectively.
We are interested in the situation in which level 2 is the excited fine structure of the ground state 1. The excited fine structure levels can be produced by photon pumping or collisional excitations. Generally, the following mechanisms can be responsible for this excitation: (i) direct excitation by IR photons; (ii) excitation to upper levels through absorption of UV photons, followed by the spontaneous decay to an excited level of the ground state (indirect UV pumping); (iii) collisions with charged particles (mainly electrons) or with neutral hydrogen. PCB06 showed that the excitation rate by UV pumping is larger than IR pumping, rendering the latter excitation mechanism unimportant for gas observed in GRB afterglow spectra. In the following, we will elaborate the scenario in which collisions are the main mechanism responsible for the production of fine structure transitions and discuss subsequently (section 4.4) the situation in which indirect UV pumping is at work.
If we assume that the collisions between electrons and ions represent the main process responsible for the excitation of the fine structure levels, equation (1) simplifies since the quantities of the parameter now refer only to electrons. In particular, for the C II and Si II fine structure doublets, equation (1) becomes:
and
respectively (Srianand & Petitjean 2001). These equations have been derived taking into account that the radiative excitation from the ground to the excited state is forbidden, and using the statistical weights; the radiative decay rates and the energy gaps are given in Bahcall & Wolf (1968). Here is the electron density, is the column density of the element in parentheses (the asterisk refers to excited fine structure levels) and is the kinetic temperature in units of .
For a fine structure system with multiple levels, the situation is more complicated, unless we assume that electron-ion collisions are dominant with respect to the radiative processes. If this is the case, the terms in equation (1) can be neglected, and the electron density disappears, yielding:
in the case of thermal equilibrium (PCB06). Equation (4) tells us that the levels are populated according to a Boltzmann distribution; here is the degeneracy of the state , is the energy difference between the state and and is the excitation temperature.
| Velocity shifta (component) | C II | C IV | O I | Si II | Si IV | Fe II |
|---|---|---|---|---|---|---|
| +32.6 (1) | Blend | 14.4 0.08 | NO | NO | NO | NO |
| +2.4 (2) | 14.33 0.15 | 14.86 0.08 | SAT | 14.68 0.23 | 15.53 0.11 | 15.24 0.06 |
| -44.0 (3a) | 14.81 0.13 | 14.75 0.12 | 14.94 0.09 | 13.62 0.06 | 13.72 0.09 | 14.66 0.22 |
| -44.0b (3b) | 13.43 0.11 | 13.60 0.07 | 14.11 0.10 | |||
| -90.2 (4) | 12.98 0.3 | 13.57 0.13 | NO | 12.53 0.24 | 13.21 0.03 | NO |
| -154.6 (5) | 12.75 0.35 | 13.04 0.06 | NO . | NO | NO | NO |
akm/s
| Vel.a (Comp) | C II* | O I* | O 1** | Si II* | Fe II* | Fe II** | Fe II*** |
|---|---|---|---|---|---|---|---|
| +2.4 (2) | 14.69 0.26 | SAT | 14.64 0.05 | 14.44 0.09 | 14.29 0.03 | 13.74 0.08 | 13.60 0.09 |
| -44.0 (3a) | 14.55 0.09 | 13.56 0.08 | 13.46 0.09 | 13.41 0.15 | NO | NO | |
| -44.0b (3b) | NO | 12.55 0.60 | 13.66 0.11 | NO | NO | NO |
akm/s


4.3 Temperature and density of the gas in the case of collisional excitation
In this section we try to obtain an estimate of the temperature and density of the gas in the GRB environment. We showed in the previous section that the excited states of the fine structure transitions present some absorption only in the second and third component of the five identified. For this reason, the physical quantities can be computed or constrained only in these two cases.
We proceed in the following way. First of all, we assume that the electron-ion collisions are the main mechanism responsible for the production of the excited fine structure feature (PCB06).
For fine structure doublets (C II and Si II), we plot in Fig. 8 the electron density as a function of the ratio between the absorbing columns of the ground state with respect to the excited one (), using eqs. (2) and (3), and for different values of the temperature. In this plot, vertical lines are loci of constant . We then draw vertical lines corresponding to our measure of the ratio and to the corresponding errors. In this way we can constrain the density of the gas for a fixed interval of temperature, and even constrain the temperature itself, if both the C II and Si II present an excited fine structure absorption.
For fine structure multiplets, we use eq. 4 under the assumpion of thermal equilibrium. Fitting the ratio of the column densities to their multiplicity factors with respect to the energy difference between each excited state and the ground state, we can obtain a measure of the temperature of the gas. Such a temperature can constrain the gas density using the plots of eqs. (2) and (3) for the fine structure doublets, or can be used as an input for the PopRatio software package (Silva & Viegas 2001), to estimate the electron density independently once the ratio between the column densities of the fine structure levels of the multiplets is known.
As previously remarked, only component 2 and 3 of the main absorption system feature fine structure transition; in the following sub-subsections we present the analysis of such components.
4.3.1 Component z=3.967_2
This component features high column densities for all the ground states: C II, O I, Si II and Fe II. The excited fine structure levels appear in all their flavors: we have strong C II*, O I* / O I** and Si II* columns; moreover Fe II is present with its first three excited levels. We plot the electron density as a function of () for three different temperatures, namely , and K, for C II (Fig. 8, left panel) and Si II (Fig. 8, right panel). For C II we used the 1036-1037 Å feature, because C II 1334 Å is saturated.
We can see from Fig. 8 that both for C II and Si II the observed column densities can only put a lower limit to the electron density, independently of the temperature of the gas. This lower limit lies in the range cm-3 and cm-3 for temperatures of K, for C II and Si II respectively.
For this component, we also made a fit to the temperature using eq. (4) and the Fe II multiplet data (Fig. 9). The value we found is K (90% confidence limit); such a value agrees with that found by PCB06, for the same GRB.
The same fit has not been performed for the O I, because its ground state appears to be saturated.


4.3.2 Component z=3.967_3
This component features high column densities for the ground states of the C II, O I and Fe II, while that of Si II is very low. As for the excited fine structure levels, we have strong C II* and low O I columns; Fe II excited levels are absent. Si II* is difficult to treat. Apart from the 1265 line that falls in the Ly- absorption gap, the 1533 line is blended with several telluric features (Fig. 6). The last flavor of Si II, the 1309 line, shows a hint of a possible absorption feature (Fig. 5); however, since the corresponding ground state is very lowly populated, this feature is somewhat suspect. As for the second component, we plot the electron density as a function of () for three different temperatures, namely , and K, for C II and Si II (Fig. 10). For C II we used the 1036-1037 feature, because C II 1334 Å is saturated.
Fig. 10, left panel indicates that the electron density inferred from C II lies in the range cm-3 for a temperature of K. If we consider the plot for Si II, the density appears to be higher than cm-3, if we assume a temperature of K. Thus, there is no overlap between the two solutions. As we discussed above, the Si II* 1309 Å is a suspicious feature, because the corresponding ground state (Si II 1304 Å) is poorly populated, while for the other elements the ground state is very highly populated when an excited level is present. In the following, we will consider either that Si II* 1309 Å is real or it is not.
For this component, we also estimate a temperature using eq. 4 and O I triplet data. The value we find is K, but we only have two points in the fit so the errors are too large to put an acceptable constraint on the temperature.
4.4 Fine structure line excitation via indirect UV pumping
In the previous sections we assumed that fine structure excited levels are produced by collisions. The other, competitive mechanism is indirect UV pumping. In fact, the fine structure levels can be excited by the absorption of a UV photon to an upper level followed by the spontaneous decay to an excited lower level. If this mechanism is at work, we cannot use the fine structure abundances to gather information about the temperature and density of the gas, but only on the strength of the radiation field. PCB06 (using the PopRatio code developed by Silva & Viegas 2001, 2002) analyzed the relation between the far UV radiation field intensity and the relative fraction of excited fine structure states with respect to their ground levels (for O I, Si II and Fe II, see their Figs. 7 and 8). In the following subsections, we will use their plots to estimate the radiation field intensity from our column density data, in the case that the fine structure transitions are produced by indirect UV pumping.
4.4.1 Component z=3.967_2
As we showed before, this is the component which presents more fine structure excited states. We evaluate the ratio between the ground and the first excited levels for Fe II(1608-1611 Åand 1618*-1621* Å) as well as the ratio between the Si II 1526 Å and Si II* 1533 Å fine structure levels. The O I ground state is saturated and can not be used in the analysis. Using Fig. 7 of PCB06, we find that the two ratios are compatible with a radiation field intensity of , erg cm-2 s-1 being the Habing constant. A consistent result is obtained estimating the ratios of the absorbing column of the first excited level of FeII to the second and third ones, and using Fig. 8 of PCB06. Again, we find that the two ratios yield a value of . The 90% confidence interval for the field intensity is .
4.4.2 Component z=3.967_3
This component exhibits the C II fine structure doublet, the O I triplet and possibly the Si II excited level. As we discussed in section 4.3.2, the Si II* detection is uncertain. Nevertheless, using the O I and Si II ratios between the ground and first excited level, we find two different values for the radiation field intensity: and , respectively. These values do not overlap at the 90% confidence limit. Since the detection of Si II* is uncertain, we cannot exclude in this way that the fine structure excited levels in this component are produced by indirect UV pumping. However, the theoretical lines representing the Fe II*/Fe II and O I*/O I abundance ratios as a function of the radiation field in Fig. 8 of PCB06, approach each other very closely. This means that we should observe a similar column of Fe II* with respect to Fe II, as we observe for O I* with respect to O I. Since , and cm-2 (see Tab. 2), we expect cm-2. However, this is not the case, because the upper limit that we found for the first excited level of the Fe II is cm-2 at the 90% confidence level. On the other hand, if the fine structure states of the third component are produced by collisions, the O I*/O I abundance ratio would yield an electron density of a few tens cm-3, compatible with that found for the C II fine structure doublet in section 4.3.2, and the ratio Fe II*/Fe II would be times smaller the O I*/O I one (See Fig 9 in PCB06). This means that we expect cm-2, a value consistent with the observed upper limit.
4.5 Neutral elements and gas distance from the GRB
The presence of neutral elements in the spectra of GRB afterglows is important, because it can put strong constraints on the distance of the gas from the GRB. This is because the first ionization potential of the elements usually lies below the 1 Ryd threshold. Thus, the intense radiation coming from the GRB would easily ionize the neutral elements, without the screening of the Hydrogen atoms, the first ionization potential of which is at higher energies. PCB06 observed the Mg I 2852 Å transition in GRB051111, and they put a lower limit of pc to the distance of the gas from the GRB. Moreover, they refined this limit to pc since no variability of the Mg I line has been observed.
In GRB050730, we observe many O I transitions. Oxygen, however, has a first ionization potential that lies just above the 1 Ryd threshold, and can exist in its neutral state even in the presence of a strong radiation field, because the Hydrogen screens it from the UV photons. We can not observe the Mg I 2852 Å transition because of the redshift of our GRB. In addition, we do not observe any other neutral element in the afterglow so we can not put any constraint on the gas distance from the GRB this way. The upper limit that we find for the neutral carbon absorption line (C I 1656 Å) is cm-2 at the 90% confidence level.
Some considerations on the relative distance of the different shells of gas from the GRB can be pursued. Component 1 of the z = 3.967 system, the one with the longest wavelength, highest positive velocity shift (see sec. 4.1), does not present any fine structure or low ionization lines; it only shows very high ionization features, such as C IV and O VI, suggesting that this component is very close to the GRB site. Moreover, if we assume that the fine structure lines of the shells are produced by the same mechanism (collisions or UV pumping), we can also say something about component 2 and 3. In fact, in the case of collisional excitations we, can estimate the electron density of the gas and this can be related to the distance using the definition of the ionization parameter:
where is the number of ionizing photons and is the speed of light. A time independent estimate of with photoionization codes like CLOUDY (Ferland 2002) is inappropriate in the case of a strongly variable phenomenon such as a GRB. Nevertheless, if we assume the electron density found in section 4.3 for the third component ( cm-3) and for the second one ( cm-3) we can conclude (using the scaling law of eq. 5) that the gas belonging to the third component lies times farther from the GRB than that belonging to the second one.
In a similar way, we can assume that indirect UV pumping is at work. In this case, the distance increases as the square root of the UV flux. If we trust the estimate of the radiation field intensity evaluated only from the O I*/O I ratio for the third component, we can conclude that the gas in the second component is a few ten times closer to the GRB than that of the third one.
4.6 Metallicity
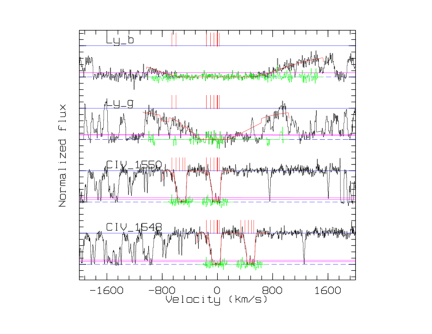
Fig. 11 shows the Ly- and Ly- absorption features. It is impossible to discriminate between the five components identified from the analysis of C IV and Si IV. The hydrogen absorption features result in very broad lines with two extended wings, which reach well beyond the velocity range of the heavier ions. Since a component by component analysis is not possible, we can only estimate the metallicity of the circumburst material in terms of the ratio [X/H] between the total absorption column of the X element with respect to that of hydrogen. Since the latter mainly includes hydrogen in the outer regions of the galaxy, we will underestimate the metallicity.
| Ion | (cm-2) | (cm-2) | [X/H] | [X/H] |
|---|---|---|---|---|
| H I | - | - | - | |
| C II | ||||
| C IV | ||||
| C | ||||
| O I | SAT | |||
| O VI | SAT | - | - | - |
| Si II | ||||
| Si IV | ||||
| Si | ||||
| Fe II |
(a) Total column density of the element
Table 4 shows our estimate of the metallicity. The second column presents the column densities of the different ions, being the sum of the columns of the five components of the ground states and of the excited fine structure levels, if these are present. The third column of Table 4 is the total column density for each element, and is obtained adding the column densities of the various ions through which the element appears in the spectrum. We could not get an estimate of the column density of Oxygen, because the absorption features of O I and O VI are saturated. Not surprisingly, we obtain a metallicity of relative to the solar one, in agreement with the paper by Starling et al. (2005). It should also be noted that these estimates are not corrected for depletion in dust grains. In the Galactic ISM only of the iron is in the gas phase while the rest is locked in dust grains (Savage & Sembach 1996). The situation can be very different in a GRB host galaxy, and in particular, in the GRB surrounding medium (Waxman & Draine 2000, Draine & Hao 2002, Perna & Lazzati 2002, Perna, Lazzati & Fiore, 2003), because the intense GRB radiation field can efficiently destroy dust grains. Caution should therefore be used in using mean metallicity estimates.
We can also calculate the ratio [C/Fe], representative of the enrichment of the elements relative to iron. We measure a mean [C/Fe]=0.080.24, consistent with the value predicted by the models of Pipino & Matteucci (2004, 2006) for a galaxy younger than 1 Gyr subject to a burst of star-formation. In such a case Pipino & Matteucci (2006) also predict a low [Fe/H] value, close to that in Table 4. Again, we warn that mean abundance estimates may be affected by large systematic uncertainties.
A safer approach is to estimate the [C/Fe] of each component of the z=3.967 system. We find that [C/Fe] of component 2 is -0.150.13 while that of component 3 is +0.530.23. Indeed, note in Tables 2 and 3 that while the total carbon column density of component 2 and 3 are similar, the total colum density of iron of component 3 is about four times less than that of component 2. A similar conclusion applies to silicon. The total silicon column density of component 3 is also about 10 times less than that of component 2. Interestingly, Perna, Lazzati & Fiore (2003) found that silicates tend to be destroyed more efficiently than graphite if a dusty medium is exposed to the intense GRB radiation field. This would leave more iron free in the gas phase in clouds closer to the GRB site than in farther clouds, in agreement with our suggestion that component 2 is 10-100 times closer to the GRB site than component 3.
5 Conclusions
In this paper we present high resolution (R=20000-45000, corresponding to 14 km/s at 4200Å and 6.6 km/s at 9000Å) spectroscopy of the optical afterglow of Gamma Ray Burst GRB050730, observed by UVES@VLT hours after the trigger.
We confirm that the redshift of the host galaxy is z=3.96764. Four intervening systems between z = 3.56 and z = 1.77 have been identified along the GRB line of sight, in addition to the main system at the redshift of the host galaxy.
For what concerns the main absorption system, the spectrum shows that the ISM of the GRB host galaxy is complex, with at least five components contributing to this main absorption system at z= 3.967. Such components are identified in this paper with progressive numbers with decreasing velocity values.
These absorption lines appear in different flavors, from neutral hydrogen (Ly-, Ly-, Ly-), to neutral metal-absorption lines (O I), and via low ionization lines (C II, Si II, Mg II, Al II, Ni II, Fe II, P II, S II) to high-ionization absorption features (C IV, Si IV, N V, O VI).
In addition, we detect strong C II*, Si II*, O I* and Fe II* fine structure absorption features in components 2 and 3 (no Fe II* in the last component). The ratio of these lines to their ground states are used to constrain the gas density and temperature, under the assumption that they are produced via collisional excitation, or alternatively by UV pumping. If collisional excitation is at work, we find that the gas producing the fine structure features has a temperature of a few thousand K, and an electron density cm-3 (component 2) or cm-3 (component 3). On the other hand, if UV pumping is the process responsible for the fine structure features, the radiation field exciting the gas has an intensity of .
We speculate that the excitation mechanisms of the fine structure lines may be different, with component 3 probably excited by collisions, and component 2 by UV pumping. This is because the observed O I*/O I ratio in component 3 would imply a similar Fe II*/Fe II ratio in the case of UV pumping, which is not observed. On the other hand, the radiation field intensities calculated from the fine structure ratios for component 2 are all in agreement with each other.
Component 1, the one with the longest vawelenght, highest positive velocity shift, does not present any fine structure or low ionization lines; it only shows very high ionization features, such as C IV and O VI, suggesting that this component is very close to the GRB site.
For the first three components we can derive information on the relative distance to the site of the GRB explosion. Both for collisional excitation and UV pumping, component 2 appears to be 10-100 times closer to the GRB site than component 3.
As to the metallicity, for the system at z=3.967 we obtain mean values of the solar metallicity or less. However, this should not be taken as representative of the circumburst medium, since the main contribution to the hydrogen column density comes from the outer regions of the galaxy while that of the other elements presumably comes from the ISM closer to the GRB site and since the correction for dust depletion is highly uncertain. It is however interesting to note that the mean [C/Fe] ratio agrees well with that expected by the single star-formation event models of Pipino and Matteucci (2004, 2006).
We could also measure the [C/Fe] of the single components 2 and 3. The [C/Fe] ratio of component 2 is -0.150.13, marginally different from that of component 3, 0.540.23. Although the result is significant at only 2.6 confidence level, it is interesting to speculate on its origin. If the cloud responsible for the absorption component 2 is closer than the cloud producing component 3 to the GRB site, we expect that dust destruction in this cloud, due to the interaction of the GRB radiation field with the medium, is more efficient than in the cloud responsible for component 3. Since silicates tend to be destroyed more efficiently than graphite (Perna, Lazzati & Fiore 2003), we expect more iron and silicon freed in the gas phase in cloud 2 than in cloud 3, as observed.
Acknowledgements.
We acknowledge support from contract ASI/I/R/039/04 (Swift). FF acknowledges support from contract ASI/I/R/023/05/0. We thank Roberto Maiolino for useful discussions. RP and DL ackowledge support by NSF grant AST-0507571References
- (1) Bahcall J. N., Wolf R. A., 1968, ApJ, 152, 701
- (2) Barthelmy, S. et al., 2005, GCN Circ 3704
- (3) Ballester, P., Modigliani, A., Boitquin, O., et al.: 2000, ESO Messenger, 101, 31
- (4) Boettcher, M. Fryer, C.L. & Dermer, C.D., 2002, ApJ, 567, 441;
- (5) Chen, H.W., Prochaska, J.X., Bloom, J.S. and Thompson, I.B., 2005, ApJ, 634, 25L
- (6) Chen, H.W. et al. 2005, GCN Circ 3709
- (7) Draine, B.T. & Hao, L., 2002, ApJ, 569, 780
- (8) Ferland, G.S. 2002, University of Kentucky Dept. of Physics and Astronomy, Internal Report
- (9) Fiore, F.; D’Elia, V.; Lazzati, D., et al., 2005, ApJ, 624, 853
- (10) Holland, S.T., Barthelmy, S., Burrows, D.N., Gronwall, C., Kennea, J., Gehrels, N., Palmer, D., 2005, GCN Circ 3704
- (11) Mirabal, N., Halpern, J.P., Kulkarni, S.R. et al. 2002, ApJ, 578, 818
- (12) Penprase, B.E., Berger, E., Fox, D.B., Kulkarni, S.R., Kadish, S., Kerber, L., Ofek, E., Kasliwal, M., Hill, G., Schaefer, B., Reed, M., 2006, ApJ, 646, 358
- (13) Perna, R. & Lazzati, D. 2002, ApJ, 580, 261
- (14) Perna, R. & Lazzati, D., Fiore, F. 2003, ApJ, 585, 775
- (15) Perna, R. & Loeb, A., 1998, ApJ, 501,467
- (16) Pipino, A. & Matteucci, F, 2004, MNRAS, 347, 968
- (17) Pipino, A. & Matteucci, F, 2006, MNRAS, 365, 1114
- (18) Prochaska, J.X., Chen, H.W., Bloom, J.S., 2006, ApJ, 648, 95 (PCB06)
- (19) Rol, E. et al. 2005, GCN Circ, 3710
- (20) Savage, B.D., Sembach, K.R., 1996, ApJ, 470, 893
- (21) Savaglio, S., Fall, S.M., Fiore, F. 2003, ApJ, 585, 638
- (22) Savaglio, S., Glazebrook, K., Crampton, D. et al. 2004, ApJ, 602, 51
- (23) Savaglio, S., Glazebrook, K., Le Borgne, D., Juneau, S., Abraham, R.G., Chen, H-W., Crampton, D., McCarthy, P.J., Carlberg, R.G., Marzke, R.O., Roth, K., Jørgensen, I., Murowinski, R., 2005, ApJ, 635, 260
- (24) Silva, A.I. & Viegas, S.M., 2001, Computer Physics Communications, 139, 319
- (25) Silva, A.I. & Viegas, S.M., 2002, MNRAS, 329, 135
- (26) Sota, A., Castro-Tirado, A.J., Guziy, S., Jelinek, M., de Ugarte Postigo, A., Gorosabel, J., Bodganov, A., Perez-Ramirez, M.D., 2005, GCN Circ 3705
- (27) Starling, R.L.C., Vreeswijk, P.M., Ellison, S.L. et al. 2005, A&A, 442, L21
- (28) Steidel, C.C., Adelberger, K.L., Giavalisco, M., Dickinson, M., Pettini, M. 1999, ApJ, 519, 1
- (29) Srianand, R., Petitjean, P., 2001, A&A , 373, 816
- (30) Srianand, R.; Petitjean, P.; Ledoux, C., 2000, Nature, 408, 931
- (31) van Marle, A.J., Langer, N., Garcia-Segura, G, 2005, A&A, 444, 837
- (32) Waxman, E. & Draine, B.T., 2002, ApJ, 537, 796
- (33) Vreeswijk, P.M., Ellison S.L., Ledoux, C. et al. 2004, A&A, 419, 927