x \acceptedx \MakeShortVerb∥
Electromagnetic Signatures of Massive Black Hole Binaries
Abstract
We model the electromagnetic emission signatures of massive black hole binaries (MBHBs) with an associated gas component. The method comprises numerical simulations of relativistic binaries and gas coupled with calculations of the physical properties of the emitting gas. We calculate the accretion powered UV/X-ray and H light curves and the H emission line profiles. The simulations have been carried out with a modified version of the parallel tree SPH code Gadget. The heating, cooling, and radiative processes for the solar metallicity gas have been calculated with the photoionization code Cloudy. We investigate gravitationally bound, sub-parsec binaries which have not yet entered the gravitational radiation phase. The results from the first set of calculations, carried out for a coplanar binary and gas disk, suggest that the outbursts in the X-ray light curve are pronounced during pericentric passages and can serve as a fingerprint for this type of binaries if periodic outbursts are a long lived signature of the binary. The H emission-line profiles also offer strong indications of a binary presence and may be used as a criterion for selection of MBHB candidates for further monitoring from existing archival data. The orbital period and mass ratio of a binary could be determined from the H light curves and profiles of carefully monitored candidates. Although systems with the orbital periods studied here are not within the frequency band of the Laser Interferometer Space Antenna (LISA), their discovery is important for understanding of the merger rates of MBHBs and the evolution of such binaries through the last parsec and towards the detectable gravitational wave window.
Keywords:
supermassive black hole binaries, electromagnetic signatures, SPH simulations:
98.62.Js1 Introduction
Massive black hole binaries (MBHBs) are expected to be the most luminous sources of gravitational radiation in the universe. The simultaneous identification of the gravitational radiation and electromagnetic counterpart from MBHBs would allow unprecedented tests of the physics of massive black holes, such as accretion, and also offer an alternative method to constrain cosmological parameters. However, there are only a handful of MBHB candidates known from observations so far and none of them are expected to merge within our lifetimes. Although galaxy mergers are the natural places to look for MBHBs (Begelman, Blandford, & Rees, 1980; Valtaoja, Valtonen, & Byrd, 1989; Milosavljević & Merritt, 2001; Yu, 2002), not every such galaxy forms a MBHB which will merge within the Hubble time, hence the difficulty in determining the merger rates. Practical obstacles in the direct identification arise for several reasons. Firstly, fairly high spatial resolution and accuracy in position measurements are required to resolve a binary with two active nuclei. For example, the spatial resolution required to resolve an intermediate binary with orbital separation of 1pc at the distance of 100 Mpc is about 2 mas. With spatial resolutions currently achievable, it is easier to spot and resolve wide binaries, like NGC 6240, whereas it has been suggested that MBHBs spend a major fraction of their life time as intermediate, hard binaries (Begelman et al., 1980). It follows that a better understanding of electromagnetic signatures of galactic nuclei hosting the massive binaries is essential in order to recognize the presence of MBHBs and put tighter constraints on their merger rates.
2 Numerical simulations
We have carried out smoothed particle hydrodynamical (SPH) simulations of the binary and gaseous component, and we have characterized the physical properties of the gas by calculating heating, cooling, and radiative processes as an integral part of simulations. Based on these results we have calculated the accretion-powered continuum and H light curves, as well as the H emission line profiles emerging from the inner parts of a gas disk on a scale of pc.
We have used Gadget (Springel, Yoshida, & White, 2001; Springel, 2005) to carry out the MBHB simulations. Gadget is a code for collisionless and gas-dynamical cosmological simulations. It evolves self-gravitating collisionless fluids with a tree -body approach, and collisional gas by SPH. We have performed several modifications to the code in order to treat the two massive black holes relativistically. We have introduced the black holes as collisionless massive particles with pseudo-Newtonian Paczynsky-Wiita potentials (Paczynsky & Wiita, 1980). The calculations account for the decay of a black hole binary orbit through emission of gravitational radiation. We have estimated the accretion rate of gas and resulting accretion luminosity. We assume that sources of illumination are powered by accretion onto the massive black holes. After accretion on either of the two black holes becomes significant, UV and soft X-ray radiation emitted from the innermost accretion flow photo-ionizes the gas.
The approximate method was developed for calculation of heating and cooling of a gas with metals. We have constructed a number of cooling maps using the photoionization code Cloudy (Ferland et al., 1998). The parameter grid is read in by the simulation code, and radiative heating and cooling rates are linearly interpolated from the existing grid points. The cooling maps are calculated in the parameter space of density and temperature of the gas and intensity of ionizing radiation. The range of parameter values for which the maps were computed is as follows: , K, and . Because one of the assumptions in Cloudy is that the electrons are non-relativistic, the present range of its validity extends to temperatures below roughly K. Gas at higher temperatures than this is commonly encountered in our simulations; in such cases we calculate heating and cooling rates by linearly extrapolating the grid values. In addition to the cooling processes included in Cloudy we also consider Compton cooling from a thermal distribution of non-relativistic electrons, which may become a significant coolant for the hottest and densest gas in the nuclear region. Since Cloudy includes a detailed treatment of radiation processes, we have also used it to calculate the H line intensity and optical depth, the electron scattering optical depth, and the neutral hydrogen column density for each gas cell. The H emission line profiles have been calculated taking into account the relativistic Doppler shift and the gravitational redshift in the potential well of a Schwarzschild black hole. We compute line profiles emerging from the gaseous disk under assumption that the observer is located at a distance , at to the axis orthogonal to the plane of the binary orbit.
The masses of the primary and secondary black holes are and . At the beginning of the simulation the black holes start from the apocenters of their orbits. The initial values of the eccentricity and semi-major axis are 0.7 and 3007, respectively, with the semi-major axis in units of (used as the unit of distance throughout this paper), where , and is the mass of a black hole. The period of the binary, calculated at the beginning of the simulation is 15.67 yr. The accretion disk is initially associated with the primary black hole. It is co-planar with the binary orbit and it extends from to ( translates to pc in physical units, a size expected for AGN accretion disks). The mass of the disk is and the number of gas particles in the disk is . The initial surface density distribution in the disk is chosen to be . The initial temperature of the disk is K. The numerical viscosity parameter (), accretion efficiency (), and metallicity of the gas () are kept constant. For detailed description of numerical methods used see Bogdanović et al. (2006).
3 Results
In the scenario described here the binary is co-rotating with the accretion disk and the gas is assumed to have a solar metallicity. Figure 1 shows the morphology and temperature of gas at two different times in the simulation.
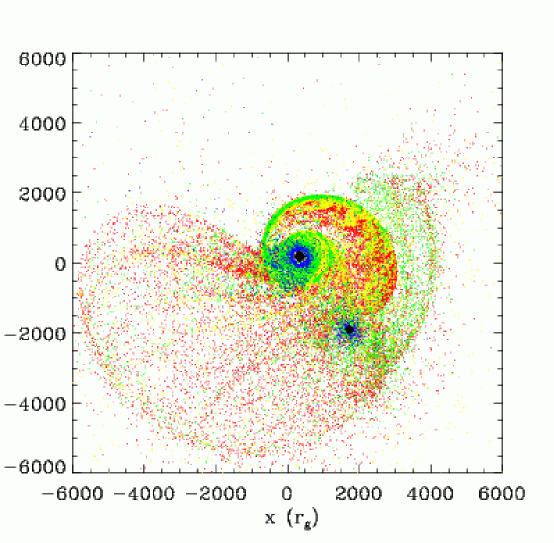
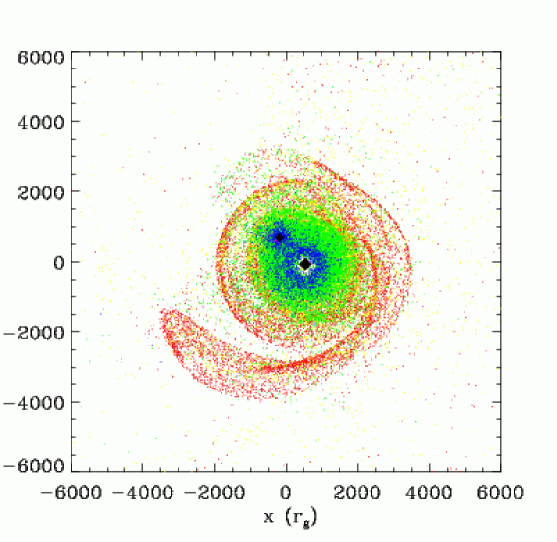
After the passage of the secondary black hole through the disk the disk density settles in the range . The disk gas remains well above the Toomre threshold for gravitational instability. The speed of sound is about in the cold disk and in the hotter gas component. The temperature of the gas reaches the highest value (T K) after the shock is formed by the secondary. On a time scale of months, the temperature of the gas falls below K due to the combined effects of radiation and adiabatic expansion. The hot component of the gas spends a significant amount of time in the temperature range K. In this regime the radiative cooling is dominated by free-free emission and recombination radiation, while inverse Compton emission becomes inefficient in comparison. On the other hand, the cold component of the gas, confined to the spiral arm retains a temperature of K.
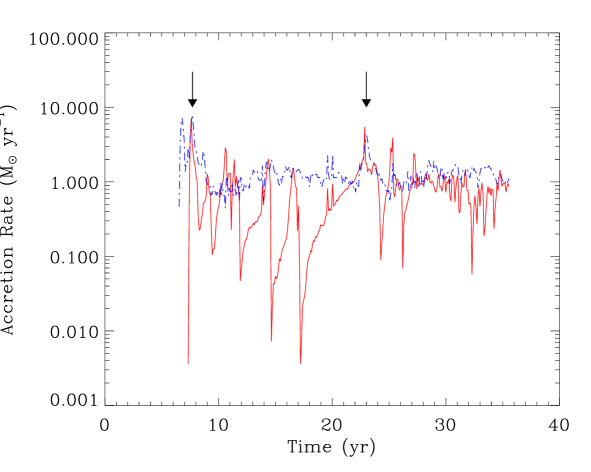
After the first pericentric passage of the secondary the accretion rate reaches (Figure 2), comparable to the Eddington rate for this system, . During the remainder of the simulation the accretion rate remains at a nearly constant level of about . This implies that the total accretion luminosity is just below the Eddington luminosity () for a few years after the first pericentric passage of the binary and later settles at luminosity . During this period the bolometric luminosity of the disk, powered by shocks and illumination, is found to be on average, with fluctuations of up to 2 orders of magnitude. Additionally, the pericentric passages, in the 7th and 23rd years of the simulation can be easily discerned in the accretion rate curves of both black holes (Figure 2).
We calculate the X-ray luminosity contributed by two different mechanisms: the X-ray emission powered by accretion and that powered by bremsstrahlung emission from the hot gas. The accretion rates onto the primary and secondary black holes in the simulation result in a UV/X-ray luminosity of about and up to during times of high accretion rate (Figure 2). We calculate the thermal bremsstrahlung emission from the population of relativistic electrons hotter than K. The electrons are heated in the process of photoionization of the gas by the accretion powered sources and in shocks taking place in the gas gravitationally perturbed by the secondary black hole. The calculation of the size of the emitting volume from a SPH simulation is complicated by the finite spatial resolution, as set by the characteristic size assigned to each gas particle (i.e., the smoothing length, ). In our calculations . It follows that as a result of “smoothing”, the bremsstrahlung X-ray emission from shocks, which typically occur on scales smaller than in our simulations, is not resolved. In order to address this uncertainty we calculate analytically the values of some physical properties of the X-ray emitting gas following the analytical treatment of shock structure in Hollenbach & McKee (1979). We find that the resulting bremsstrahlung X-ray luminosity from the shocked gas is in the range , with the peaks reaching up to . In the second step we estimate the bremsstrahlung X-ray luminosity emitted from the photoionized portion of the gas. We identify the gas cells responsible for most of the X-ray emission powered by photoionization as low density cells with temperatures higher than . The number of photoionized gas particles that contribute to the X-ray bremsstrahlung emission is about a few percent of all gas particles. However, the large volume of this halo makes up for its small mass and low number density. Thus, the resulting bremsstrahlung luminosity from the halo is , comparable to the estimated contribution of the shocked regions. We emphasize that the estimates of the bremsstrahlung X-ray luminosity presented here are based on astrophysically motivated but simplified assumptions and that they should be regarded as constraints rather then the exact values.
The bremsstrahlung X-ray luminosity of the gas is, in general, lower than the accretion powered UV/X-ray luminosity, although during the times of pericentric passage the peak bremsstrahlung X-ray luminosity may be comparable to that of the accretion powered X-ray luminosity. The latter X-ray light curve also exhibits peaks during pericentric passages of the binary, thus such peaks are good markers of such events. The estimated level of the total X-ray emission (accretion powered plus bremsstrahlung) should be observable to a redshift of during the outburst phases. A calculation following the X-ray light curve variability over a large number of orbits is necessary in order to confirm that the periodicity is a long lived signature of the binary.
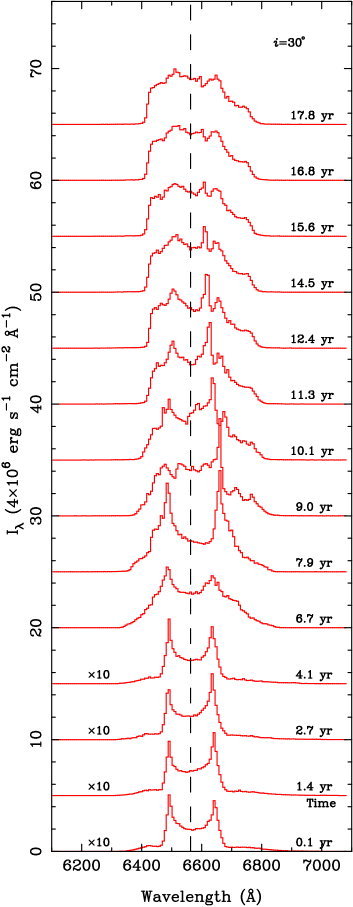
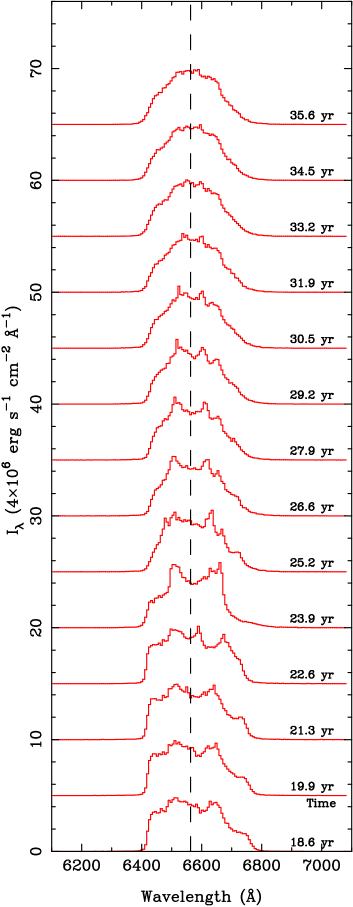
By modeling the H light curves we find that after the beginning of accretion the H luminosity gradually reaches . Sources with such H luminosities are observable out to the distance of the Virgo Cluster and possibly up to a distance of 100 Mpc. We also calculate the broad H emission-line profiles in order to better illustrate the kinematics of the gas (see Figure 3). Initially, from the unperturbed disk we observe low intensity double-peaked emission line profiles but they gradually depart from this shape as the perturbation propagates through the gas. The profiles appear variable on a time scale of months to years, both in shape and width. The profiles show an extended, low intensity red wing, most pronounced during the periods of increased accretion and after the times of pericentric passages. During such events a number of emitting gas particles find themselves deeper in the potential well of the binary. The emitted photons that leave the potential well are gravitationally redshifted and Doppler boosted, thus contributing to the extended red wing and the blue shoulder of the relativistic H profiles. Because the relativistic effects emphasize the distinctive features in the H emission line profiles during and after the pericentric passages of the binary they are in general case a helpful marker which can be used to infer the orbital period of the binary from the observed profile sequences. The trailed spectrogram (a 2D map of the H intensity against observed velocity, not shown here) reveals the repetitive behavior in segments between 7 to 22 years and 22 to 36 years. The width of the H profile increases after the pericentric passages of the system, reflecting the inflow of gas towards the primary. Additionally the widening of the profile appears asymmetric and shifted towards the red with respect to the pre-pericentric sequence of profiles. The shift in the emission line profile sequence is a signature of the motion of the accretion disk which follows the primary on its orbit. In general, we expect the signature of the velocity curves of the two black holes to appear in the emission line profiles at pericentric passages, because that is when the binary interaction with the gas is most intense. If such features could be discerned in the observed H emission-line profiles, they would confirm the existence of the binary. In practice, one may constrain the period and the mass ratio of the binary from the periodicity and projected velocity components of the two black holes, all measured from the H profile sequence. The determination of the individual black hole masses is more challenging, because it requires knowledge of the inclination of the binary orbit with respect to the observer. Also, before any of the binary parameters can be measured from observations of light curves and the H line sequence, it is necessary to follow a few revolutions of the binary.
4 Conclusions
Since there are reasons to expect that MBHBs spend the largest fraction of their lives at sub-parsec scales (Begelman et al., 1980) this phase naturally emerges as an optimal one for the study of the observational signatures of such binaries. Based on the first set of calculations, one portion of which is presented here, we find that X-ray outbursts should occur during pericentric passages of a co-planar binary. We suggest that periodical X-ray outbursts should persist as long as there is a supply of the nuclear gas that the MBHB can interact with. A calculation of a much larger number of binary orbits is needed in order to confirm that the periodic outbursts are a long lived signature of the binary. The current limitation of the numerical method used in this study is that the calculation of a large number of orbits along with the hydrodynamics and radiative heating and cooling becomes prohibitively expensive.
Except for the recurrent outbursts in the X-ray light curve the signature of a binary is most easily discernible in the H emission line profiles. The irregular shape of the broad H emission line profiles can be used as a first set of criteria when searching for MBHBs. Once candidates are selected from a large spectroscopic survey (e.g., the SDSS) they can be monitored over long time intervals to look for the time-dependent signature of a binary. Based on simulation described here, for a mass ratio of 0.1, the wavelength shift in the H emission lines over the course of an orbital period should be measurable. If one can follow the regular variations of the line over a few cycles, one could constrain the properties of the binary. If the signatures of binaries are found in observations, they could be used to estimate the number of MBHBs in this evolutionary stage and whether MBHBs indeed evolve quickly through the last parsec.
5 Acknowledgments
T.B. gratefully acknowledges the support of the Center for Gravitational Wave Physics.
References
- Begelman et al. (1980) Begelman, M. C., Blandford, R. D., & Rees, M. J. 1980, Nature, 287, 307
- Bogdanović et al. (2006) Bogdanović, T., Smith, B. D., Sigurdsson, S., & Eracleous, M. 2006, ApJ, submitted.
- Ferland et al. (1998) Ferland, G. J., Korista, K. T., Verner, D. A., Ferguson, J. W., Kingdon, J. B., & Verner, E. M. 1998, PASP, 110, 761
- Hollenbach & McKee (1979) Hollenbach, D., & McKee, C. F. 1979, ApJS, 41, 555
- Milosavljević & Merritt (2001) Milosavljević, M. & Merritt, D. 2001, ApJ, 563, 34
- Paczynsky & Wiita (1980) Paczynsky, B. & Wiita, P. J. 1980, A&A, 88, 23
- Springel et al. (2001) Springel, V., Yoshida, N., & White, S. D. M. 2001, New Astronomy, 6, 79
- Springel (2005) Springel, V. 2005, MNRAS, 364, 1105
- Valtaoja et al. (1989) Valtaoja, L., Valtonen, M. J., & Byrd, G. G. 1989, ApJ, 343, 47
- Yu (2002) Yu, Q. 2002, MNRAS, 331, 935