Latest results on Jovian disk X-rays from XMM-Newton
Abstract
We present the results of a spectral study of the soft X-ray emission (0.22.5 keV) from low-latitude (‘disk’) regions of Jupiter. The data were obtained during two observing campaigns with XMM-Newton in April and November 2003. While the level of the emission remained approximately the same between April and the first half of the November observation, the second part of the latter shows an enhancement by about 40% in the 0.22.5 keV flux. A very similar, and apparently correlated increase, in time and scale, was observed in the solar X-ray and EUV flux.
The months of October and November 2003 saw a period of particularly intense solar activity, which appears reflected in the behaviour of the soft X-rays from Jupiter’s disk. The X-ray spectra, from the XMM-Newton EPIC CCD cameras, are all well fitted by a coronal model with temperatures in the range 0.40.5 keV, with additional line emission from Mg XI (1.35 keV) and Si XIII (1.86 keV): these are characteristic lines of solar X-ray spectra at maximum activity and during flares.
The XMM-Newton observations lend further support to the theory that Jupiter’s disk X-ray emission is controlled by the Sun, and may be produced in large part by scattering, elastic and fluorescent, of solar X-rays in the upper atmosphere of the planet.
keywords:
Planets , Jupiter , X-rays, , , , , , , ,
1 Introduction
The current generation of X-ray observatories, with their greatly improved spatial resolution (Chandra) and sensitivity (XMM-Newton), coupled to moderate (CCD) to high (gratings) spectral resolution, have made it feasible for the first time to study solar system objects in detail. X-ray observations of planets, satellites and comets, coupled with solar X-ray studies and solar wind and magnetospheric measurements in situ, are being used to extend our understanding of the photon and particle processes taking place all over the solar system, of the interactions between the Sun and solar system bodies, and ultimately of the effects solar activity may have on our own Earth (for a review see Bhardwaj et al., 2006b, this issue).
Jupiter has a particularly complex magnetospheric environment, which is governed by the fast rotation of the giant planet, and by the presence of Io and its dense plasma torus. This made it an interesting target since the earliest attempts of solar system X-ray studies: Jupiter was first detected at X-ray energies with the Einstein observatory (Metzger et al., 1983); later studies with ROSAT (Waite et al., 1994, 1997) established the presence of two distinct types of X-ray emission from the planet: ‘auroral’, from regions near the magnetic poles, and ‘disk’ emission, from lower latitudes. The present paper focuses on the disk emission; recent detailed studies of the Jovian X-ray aurorae can be found in Branduardi-Raymont et al. (2004, 2006a,b) and Elsner et al. (2005), and references therein.
The first attempt to explain the origin of Jupiter’s disk emission (Waite et al., 1997) was based on energetic ion precipitation, the same mechanism invoked to account for the auroral emissions also seen by ROSAT. However, a general decrease in the overall X-ray brightness of Jupiter over the years 1994-1996 was found to be coincident with a similar decay in solar activity, as characterised by the solar 10.7 cm flux; the X-ray flux from the Jovian disk also revealed an interesting dependence on local time, with the X-ray bright limb coinciding with the bright visible limb (Gladstone et al., 1998). These two facts combined suggested that the planet’s disk emission may be controlled by the Sun to some extent. Indeed Maurellis et al. (2000) were able to demonstrate that scattering of solar X-rays in Jupiter’s atmosphere may well play a role in generating its equatorial emission. They modelled this component of solar origin with a combination of elastic scattering by atmospheric neutrals, and, to a smaller degree, fluorescent scattering of C K-shell X-rays on methane molecules.
Chandra High Resolution Camera (HRC) observations of Jupiter in Dec. 2000 (Gladstone et al., 2002) not only revealed surprising characteristics in its auroral emission, but gave us the sharpest X-ray view of the planet yet, clearly separating the bright auroral and the essentially uniform disk emissions (see Figure 28 of Bhardwaj et al., 2006b, this issue). However, no information on the spectral characteristics of the emissions could be obtained from the HRC data. Jupiter was observed again in Feb. 2003 with the Chandra Advanced CCD Imaging Spectrometer (ACIS), and the HRC, and this time spectra were acquired of both auroral (Elsner et al., 2005) and disk (Bhardwaj et al., 2006a) emissions. Recently Cravens et al. (2006) have produced calculations of the scattering albedo for soft X-rays from the outer planets and have compared them against the ACIS spectra of Jupiter’s disk. The conclusion is that indeed the soft X-ray emissions of Jupiter (and Saturn) can largely be explained by scattering and fluorescence of solar X-rays.
A study of Jupiter’s soft X-ray emission from the first XMM-Newton observation of the planet in Apr. 2003 (Branduardi-Raymont et al., 2004) clearly demonstrated the different characteristics of the auroral and disk spectra: while charge exchange was found most likely to be responsible for the auroral soft X-ray production, a coronal (i.e. optically thin collisional plasma) model best fitted the disk emission, giving support to the solar X-ray scattering hypothesis. In the following we describe the results of a second XMM-Newton observation, carried out in Nov. 2003 (a preliminary account of this can be found in Branduardi-Raymont et al., 2006a), and we compare them with those from a re-analysis of the Apr. 2003 data.
2 XMM-Newton observations
XMM-Newton (Jansen et al., 2001) observed Jupiter for two consecutive spacecraft revolutions (0726 and 0727; a total of 245 ks) between Nov. 25, 23:00 and Nov. 29, 12:00, i.e. for more than twice the duration of the Apr. 2003 observation (110 ks, Branduardi-Raymont et al., 2004). As on that occasion the EPIC-MOS (Turner et al., 2001) and -pn (Strüder et al., 2001) cameras (with a field of view of 30’ diameter) were operated in Full Frame and Large Window mode respectively, and the RGS instrument (den Herder et al., 2001) in Spectroscopy. The filter wheel of the OM telescope (Mason et al., 2001) was kept in the blocked position because the optical brightness of Jupiter is above the safe limit for the instrument, so no OM data were collected; also to minimise the risk of optical contamination in the X-ray data the EPIC cameras were used with the thick filter. Jupiter’s motion on the sky (11 and 16”/hr in Apr. and Nov. 2003 respectively) required several pointing trims during the long observations so that the target would not move out of the cameras’ central CCD chip, and to avoid worsening the RGS spectral resolution. During both observations the planet’s path on the sky was roughly along the RGS dispersion direction, so that good separation of the two auroral spectra could be achieved. The planet’s disk diameter was 38” in Apr. and 36” in Nov. 2003.
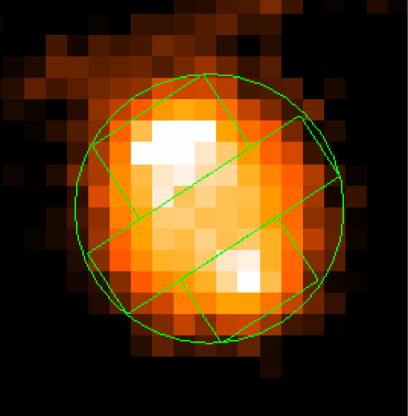
The data were processed and analysed with the XMM-Newton Science Analysis Software (SAS) (see SAS User’s Guide at http://xmm.vilspa.esa.es/extern- al/xmm_user_support/documentation). Photons collected along Jupiter’s path during the pointings were referred to the centre of the planet’s disk so that images, lightcurves and average spectra could be constructed in the planet’s reference system. Exclusion of data affected by high particle background at the end of both spacecraft revolutions in Nov. 2003 leaves a total of 210 ks of good quality data for analysis (this total was 80 ks in Apr. 2003). Figure 1 displays the 0.22.0 keV image of Jupiter obtained combining the Nov. 2003 data for all XMM-Newton EPIC CCD cameras.
3 Temporal analysis
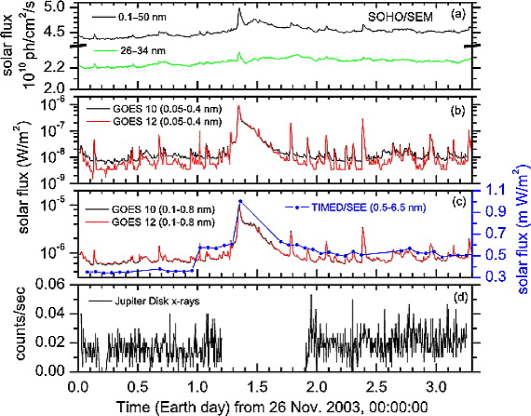
Unlike in Apr. 2003 (Branduardi-Raymont et al., 2004), the EPIC lightcurve of X-ray events extracted from the equatorial regions of Jupiter in Nov. 2003 presents evidence for variability, with a smooth visible increase in flux from beginning to end by 40%. A similar increase is present in the solar EUV and X-ray fluxes over the same period (see Figure 2, taken from Bhardwaj et al., 2005). Moreover, a large solar X-ray flare taking place on the Jupiter-facing side of the Sun (at 2.4 days into the observation; see Figure 2, this paper, and Figure 30 of Bhardwaj et al., 2006b, this issue) appears to have a corresponding feature in the Jovian X-rays. Both these facts support the hypothesis that Jupiter’s disk emission is predominantly scattered solar X-rays from the planet’s upper atmosphere and that it is directly controlled by solar irradiation. It is interesting to note that the months of Oct. and Nov. 2003 corresponded to a period of particularly intense solar activity, of the kind previously observed during the decay phases of a solar cycle, and much stronger than that in Apr. 2003.
4 Spectral study
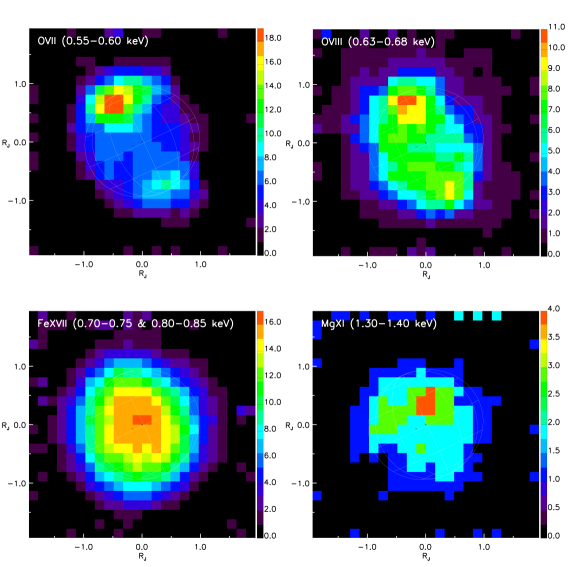
The spectral differences between the disk and the auroral X-ray emissions of Jupiter, already revealed by the Apr. 2003 XMM-Newton observation (Brandu-ardi-Raymont et al., 2004), are very evident when we construct spectral maps of the planet in narrow energy bands using the Nov. 2003 EPIC data (Figure 3); the bright, well separated aurorae shine at the lowest energies (spectral bands centred on the O VII, 0.57 keV, and O VIII, 0.65 keV, emission lines), while the more uniform and round-shaped emission from the disk emerges clearly at higher energies (around the Fe XVII and Mg XI ionic transitions, at 0.70.8 and 1.4 keV respectively).
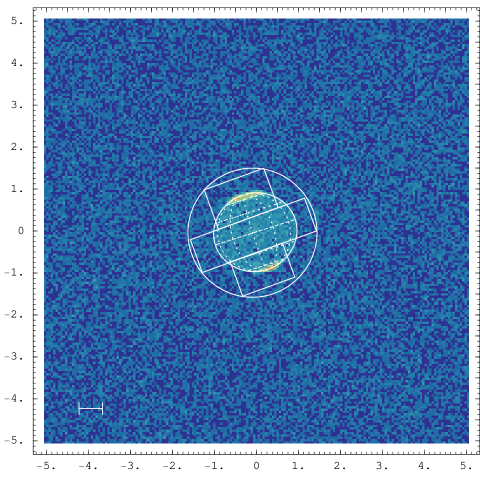
When extracting Jupiter’s auroral and disk spectra from the EPIC data the blurring effect introduced by the XMM-Newton Point Spread Function (PSF, 15” Half Energy Width) has to be taken into account, and some form of ‘de-mixing’ of the X-ray events from the different parts of the planet needs to be carried out. This was done by subtracting appropriate fractions of disk and auroral emissions from the aurorae and the disk spectra respectively. These fractions were established by convolving the XMM-Newton PSF with the summed Chandra ACIS and HRC surface brightness distributions of Jupiter observed in Feb. 2003 (displayed in Figure 4; Elsner et al., 2005) for the regions used in the extraction. These regions are shown in Figures 1 and 4; the rectangular box at the centre, from which the disk spectrum was extracted, has sides of 51.7” and 14.9”, and covers 32% of the circle enclosing the XMM-Newton image of the whole planet (see Branduardi-Raymont et al., 2006b, for details of the spectral extraction).
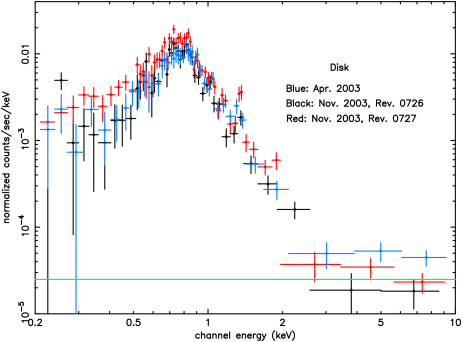
Figure 5 shows a comparison of the EPIC disk spectra over the band 0.210 keV from the Apr. and Nov. 2003 XMM-Newton observations. The latter was broken up into two observing intervals defined by the two consecutive spacecraft revolutions (0726 and 0727), so that we have a total of three datasets of similar duration (80100 ks). The main reasons for separating the two revolutions were the variability in the overall level of the disk emission, which increased from beginning to end of the Nov. observation (see Figure 2), and also the remarkable change observed in the auroral spectra between the two intervals (Branduardi-Raymont et al., 2006a,b); the latter suggests that a significant change took place in the planet’s magnetospheric environment over the two halves of the observation. The Apr. 2003 spectrum was re-extracted using the same technique as for the Nov. observation, so that the three spectra in Figure 5 are directly comparable.
The horizontal green line in Figure 5 represents the predicted level of particle background (the cosmic ray diffuse background is occulted by the planet’s body). This, together with the systematic flattening of the spectra at high energies, suggests that the disk emission dominates and is well above the particle background only up to 2.5 keV. Thus spectral fitting was carried out in the band 0.22.5 keV. The spectra were binned at a minimum of 20 counts per bin, so that the minimization technique would be applicable.
Given the likely connection between the observed disk X-ray emission of Jupiter and the solar one, we started by considering that a solar spectrum may be a good model to apply to the XMM-Newton data of the planet. Peres et al. (2000) synthesized the solar X-ray spectrum from Yohkoh/SXT data and folded it through the instrumental responses of non-solar X-ray observatories, to generate simulated solar spectra at the ASCA spectral resolution. They then derived spectral parameters from a best fit analysis of the data, and did this for three cases: solar minimum, solar maximum and flaring Sun. We have taken their parameters as the initial ones for our fits to Jupiter’s disk spectra. Briefly, Peres et al. (2000) spectra were synthesized using coronal emission components (mekal model in XSPEC, the standard spectral fitting code in X-ray astronomy): one mekal component (kT = 0.15 keV) was sufficient to describe the solar minimum spectrum, two (kT = 0.18 and 0.49 keV) were required at solar maximum and three (kT = 0.21, 1.07, 1.59 keV) for the flaring Sun. The appearence of the synthetic spectra changes significantly from the first to the third case, and this is clearly reflected in the simulated ASCA data (which are at a similar resolution to that of XMM-Newton EPIC): the spectrum becomes increasingly harder, with the flux rising in the 15 keV band, and emission features appear prominently at and above 1 keV; in particular, line emission between 1 and 2 keV, corresponding to Mg XI and Si XIII transitions (Phillips et al., 1982), is strong at solar maximum (Figure 7 of Peres et al., 2000), while the spectrum of the flaring Sun (their Figure 8) has a peak around 1 keV, due to a combination of Fe XVII, Fe XXI and Ne X lines (Phillips et al., 1982).
We first combined the spectra from the three XMM-Newton datasets in order to establish the significance of the spectral features and characterize them at the highest possible signal-to-noise level. The best fit is obtained with a single mekal model with a temperature of 0.42 keV and solar abundances, and the inclusion of line emission (described by a gaussian function in XSPEC) from the Mg XI resonance transition at 1.35 keV and from that of Si XIII at 1.86 keV. Given the moderate statistical quality of the data, the line energies were kept fixed in the fits, in order to limit the number of degrees of freedom. We confirm that the presence of line emission from both Mg and Si ions is statistically significant in the combined spectrum. The best fit parameters are listed in Table 1. Figure 6 displays the data and the best fit model, together with the contributions for all spectral bins. Indicated in the figure are the locations of the Mg XI and Si XIII lines, as well as those of the most prominent line emission contributions from the coronal plasma (Fe XVII at 0.70.8 keV, Fe XVII and XXI and Ne X at 1 keV). The results of this spectral fitting reinforce and quantify what was visually already clear from Figure 3: the iron emission (especially the bright features around 0.70.8 keV) and that, weaker, of Mg XI, clearly map out the X-ray brightness of the whole disk of Jupiter; in the spectral fitting, however, we only used X-ray events extracted from the low latitude regions of the planet, where a proper de-mixing from the auroral emission can be carried out.
We also analysed the three XMM-Newton spectra from Apr. and Nov. 2003 separately, to check for any sign of variability beween them. The same combination of coronal plasma and line emission is required to represent the individual spectra as the combined one: the mekal temperature lies in the range 0.40.5 keV; the presence of Mg XI emission is clearly detected in the individual spectra, but that of Si XIII is less convincing. The best fit parameters are listed in Table 1 and the spectra and best fits are shown in Figure 7. The calculations of line equivalent widths in particular suffer from large uncertainties: this is most likely due to the low flux observed, and thus the severe binning required, at the upper end of the energy range examined. Moreover, it must be noted that the equivalent widths listed in Table 1 are for the lines added to the coronal model, which already includes some Mg XI and Si XIII emission, as appropriate for the best fit temperature; this makes the level of the underlying continuum very dependent on the energy band over which it is estimated, and the equivalent widths (which are essentially lower limits to the total emission from the transitions) particularly inaccurate.
There is evidence in all three spectra (marginally in rev. 0727) of emission, unaccounted for, at 0.57 keV (the energy of the resonance transition of O VII), which may be residual contamination from the auroral regions. Alternative models, such as two coronal components, were tried, but produced statistically worse fits.
The 0.22.5 keV fluxes listed in Table 1 have been used to calculate the emitted power at Jupiter after normalisation to the total area of the planet’s disk. As mentioned above, the low-latitude spectral extraction box (see Figure 1) is about one third in size of the circle enclosing the planet’s image, which is blurred by the XMM-Newton PSF (15” Half Energy Width). Assuming that the circle (of radius 27.5”) contains the vast majority of the X-ray emission from Jupiter, the power emitted from the planet’s full disk (excluding the aurorae) is estimated to be 0.37, 0.38 and 0.58 GW in Apr. and Nov. (rev. 0726 and 0727) 2003 respectively.
5 Discussion and conclusions
The results of the spectral analysis reported in the previous section reinforce the idea that Jupiter’s low-latitude disk X-ray emission, away from the auroral zones, is predominantly the consequence of the Sun’s X-ray irradiation and of scattering in the upper atmosphere of the planet (Cravens et al., 2006): the XMM-Newton spectra are very well fitted by a coronal model with a temperature which is very similar to that observed at solar maximum for the Sun’s X-rays. The Mg XI and Si XIII line emissions, also observed in Jupiter, are considered the signatures of flaring episodes on the Sun: the Jovian Mg XI flux was strongest in Nov. 2003, rev. 0727, when Jupiter’s disk flux was highest and flares were observed in both solar and Jupiter’s X-ray lightcurves (see Bhardwaj et al., 2005).
However, with the available data we cannot exclude the possibility that other processes may play a role in this scenario: recent results (Bhardwaj et al., 2006a) have confirmed the existence of a correlation between low-latitude X-ray intensity and surface magnetic field strength which was originally reported in ROSAT data (Gladstone et al., 1998), and which seemed to contradict other evidence supporting a solar connection. This would suggest that some phenomenon of magnetospheric origin is also at work at low latitudes on Jupiter.
6 Acknowledgements
This work is based on observations obtained with XMM-Newton, an ESA science mission with instruments and contributions directly funded by ESA Member States and the USA (NASA). The MSSL authors acknowledge financial support from PPARC.
References
- Bhardwaj et al. (2005) Bhardwaj, A., Branduardi-Raymont, G., Elsner, R. F., Gladstone, G. R., Ramsay, G., Rodriguez, P., Soria, R., Waite, J. H., Jr., Cravens, T. E., 2005. Solar control on Jupiter’s equatorial X-ray emissions: 26-29 November 2003 XMM-Newton observation, Geophys. Res. Lett. 32, L03S08-L03S12.
- Bhardwaj et al. (2006a) Bhardwaj, A., Elsner, R. F., Gladstone, G. R., Waite, J. H., Jr., Branduardi-Raymont, G., Cravens, T. E., Ford, P., 2006a. Low- to mid-latitude X-ray emission from Jupiter, J. Geophys. Res. In press.
- Bhardwaj et al. (2006b) Bhardwaj, A., Elsner, R. F., Gladstone, G. R., Cravens, T. E., Lisse, C. M., Dennerl, K., Branduardi-Raymont, G., Wargelin, B. J., Waite, J. H., Jr., Robertson, I., Ostgaard, N., Beiersdorfer, P., Snowden, S. L., Kharchenko, V., 2006b. X-rays from solar system bodies, Planet. Space Sci., this issue. Submitted.
- Branduardi-Raymont et al. (2004) Branduardi-Raymont, G., Elsner, R., Gladstone, G., Ramsay, G., Rodriguez, P., Soria, R., Waite, J. H., Jr., 2004. First observation of Jupiter with XMM-Newton. Astron. Astrophys. 424, 331-337.
- Branduardi-Raymont et al. (2006a) Branduardi-Raymont, G., Bhardwaj, A., G., Elsner, R., R., Gladstone, G., Ramsay, G., Rodriguez, P., Soria, R., Waite, J. H., Jr., Cravens, T. E., 2006a. XMM-Newton observations of X-ray emission from Jupiter, ESA SP-604, 15-20. Proceedings of the Symposium ‘The X-ray Universe 2005’, San Lorenzo de El Escorial, Spain, 26-30 September 2005 (astro-ph/0512249).
- Branduardi-Raymont et al. (2006b) Branduardi-Raymont, G., Bhardwaj, A., Elsner, R. F., Gladstone, G. R., Ramsay, G., Rodriguez, P., Soria, R., Waite, J. H., Jr., Cravens, T. E., 2006b. A study of Jupiter’s aurorae with XMM-Newton, Astron. Astrophys. Submitted.
- Cravens et al. (2006) Cravens, T. E., Clark, J., Bhardwaj, A., Elsner, R., Waite, J. H., Jr., Maurellis, A. N., Gladstone, G. R., Branduardi-Raymont, G., 2006. X-ray emission from the outer planets: albedo for scattering and fluorescence of solar X-rays, J. Geophys. Res. 111, A07308-A07318.
- den Herder et al. (2001) den Herder, J. W. et al., 2001. The Reflection Grating Spectrometer on board XMM-Newton, Astron. Astroph. 365, L7-L17.
- Elsner et al. (2005) Elsner, R., Lugaz, N., Waite, J. H., Jr., Cravens, T. E., Gladstone, G. R., Ford, P., Grodent, D., Bhardwaj, A., MacDowall, R. J., Desch, M. D., Majeed, T., 2005. Simultaneous Chandra X-ray, Hubble Space Telescope ultraviolet, and Ulysses radio observations of Jupiter’s aurora, J. Geophys. Res. 110, A01207-A01222.
- Jansen et al. (2001) Jansen, F., Lumb, D., Altieri, B., Clavel, J., Ehle, M., Erd, C., Gabriel, C., Guainazzi, M., Gondoin, P., Much, R., Munoz, R., Santos, M., Schartel, N., Texier, D., Vacanti, G., 2001. XMM-Newton observatory. I. The spacecraft and operations, Astron. Astroph. 365, L1-L6.
- Gladstone et al. (1998) Gladstone, G. R., Waite, J. H., Jr., Lewis, W. S., 1998. Secular and local time dependence of Jovian X-ray emissions, J. Geophys. Res. 103, 20083-20088.
- Gladstone et al. (2002) Gladstone, G. R., Waite, J. H., Jr., Grodent, D., Lewis, W. S., Crary, F. J., Elsner, R. F., Weisskopf, M. C., Majeed, T., Jahn, J.-M., Bhardwaj, A., Clarke, J. T., Young, D. T., Dougherty, M. K., Espinosa, S. A., Cravens, T. E., 2002. A pulsating auroral X-ray hot spot on Jupiter, Nature 415, 1000-1003.
- Mason et al. (2001) Mason, K. O., Breeveld, A., Much, R., Carter, M., Cordova, F. A., Cropper, M. S., Fordham, J., Huckle, H., Ho, C., Kawakami, H., Kennea, J., Kennedy, T., Mittaz, J., Pandel, D., Priedhorsky, W. C., Sasseen, T., Shirey, R., Smith, P., Vreux, J.-M., 2001. The XMM-Newton optical/UV monitor telescope, Astron. Astroph. 365, L36-L44.
- Maurellis et al. (2000) Maurellis, A. N., Cravens, T. E., Gladstone, G. R., Waite, J. H., Jr., Acton, L. W., 2000. Jovian X-ray emission from solar X-ray scattering, J. Geophys. Res. 27, 1339-1342.
- Metzger et al. (1983) Metzger, A. E., Luthey, J. L., Gilman, D. A., Hurley, K. C., Schnopper, H. W., Seward, F. D., Sullivan, J. D., 1983. The detection of X-rays from Jupiter, J. Geophys. Res. 88, 7731-7741.
- Peres et al. (2000) Peres, G., Orlando, S., Reale, F., Rosner, R., Hudson, H., 2000. The Sun as an X-ray star. II. Using the Yohkoh/Soft X-ray Telescope-derived solar emission measure versus temperature to interpret stellar X-ray observations, Astrophys. J. 528, 537-551.
- Phillips et al. (1982) Phillips, K.J.H., Fawcett, B. C., Kent, B. J., Gabriel, A. H., Leibacher, J. W., Wolfson, C. J., Acton, L. W., Parkinson, J. H., Culhane, J. L., Mason, H. E., 1982. Solar flare X-ray spectra from the Solar Maximum Mission Flat Crystal Spectrometer, Astrophys. J. 256, 774-787.
- Strüder et al. (2001) Strüder, L. et al., 2001. The European Photon Imaging Camera on XMM-Newton: The pn-CCD camera, Astron. Astroph. 365, L18-L26.
- Turner et al. (2001) Turner, M. J., L. et al., 2001. The European Photon Imaging Camera on XMM-Newton: The MOS cameras: The MOS cameras, Astron. Astroph. 365, L27-L35.
- Waite et al. (1994) Waite, J. H., Jr., Bagenal, F., Seward, F., Na, C., Gladstone, G. R., Cravens, T. E., Hurley, K. C., Clarke, J. T., Elsner, R., Stern, S. A., 1994. ROSAT observations of the Jupiter aurora, J. Geophys. Res. 99, 14799-14810.
- Waite et al. (1997) Waite, J. H., Jr., Gladstone, G. R., Lewis, W. S., Drossart, P., Cravens, T. E., Maurellis, A. N., Mauk, B. H., Miller, S., 1997. Equatorial X-ray emissions: implications for Jupiter’s high exospheric temperatures, Science 276, 104-108.
-
a
mekal temperature in keV
-
b
mekal normalisation in units of 10-6 ph cm-2 s-1 keV-1
-
c
Energy of the emission line in keV (fixed in the fits)
-
d
Total flux in the line in units of 10-6 ph cm-2 s-1
-
e
Line equivalent width in eV
-
f
Flux in units of 10-14 erg cm-2 s-1