GRO J1655-40: Early Stages of the 2005 Outburst
Abstract
The black-hole X-ray binary transient GRO J1655-40 underwent an outburst beginning in early 2005. We present the results of our multi-wavelength observational campaign to study the early outburst spectral and temporal evolution, which combines data from X-ray (RXTE, INTEGRAL), radio (VLA) and optical (ROTSE, SMARTS) instruments. During the reported period the source left quiescence and went through four major accreting black hole states: low-hard, hard intermediate, soft intermediate and high-soft. We investigated dipping behavior in the RXTE band and compare our results to the 1996–1997 case, when the source was predominantly in the high-soft state, finding significant differences. We consider the evolution of the low frequency quasi-periodic oscillations and find that the frequency strongly correlates with the spectral characteristics, before shutting off prior to the transition to the high-soft state. We model the broad-band high-energy spectrum in the context of empirical models, as well as more physically motivated thermal and bulk-motion Comptonization and Compton reflection models. RXTE and INTEGRAL data together support a statistically significant high energy cut-off in the energy spectrum at keV during the low-hard state. The RXTE data alone also show it very significantly during the transition, but cannot see one in the high-soft state spectra. We consider radio, optical and X-ray connections in the context of possible synchrotron and synchrotron self-Compton origins of X-ray emission in low-hard and intermediate states. In this outburst of GRO J1655–40, the radio flux does not rise strongly with the X-ray flux.
1 Introduction
X-ray Novae, also known as soft X-ray transients, are a subclass of the low-mass X-ray binaries (LMXBs) for which prolonged periods of quiescence are occasionally interrupted by dramatic, accretion-powered optical, UV, and X-ray outbursts (Chen, Shrader & Livio, 1997; McClintock & Remillard, 2006). A majority of these binaries have been determined to contain compact primaries with mass functions exceeding the nominal 3-solar-mass limit for neutron stars; indeed, most of the known stellar mass black holes are associated with this class of objects. These outbursts are frequently accompanied by radio emission which is generally associated with collimated outflows. The radio emission is transient in nature, and a wide range of behavior has been documented.
Conventional classification of black hole (BH) spectral states includes five states, namely: quiescent state, low-hard state (LHS), intermediate state (IS), high-soft (or thermally dominant) state (HSS) and very high (or steep power law) state. McClintock & Remillard (2006) recently reviewed these states. They advocate the names in parentheses, as being more accurately descriptive. However, we follow tradition in the use of the abbreviation HSS. The LHS energy spectrum is dominated by a hard (spectral index 1.4–1.6) power law. A thermal component is either very small or not seen at all. Strong variability (up to 40 %) in the form of band-limited noise is observed in this state, often accompanied by quasi-periodic oscillations (QPO) seen in the Fourier Power Density Spectrum (PDS) as narrow peaks. Stable radio emission with a flat spectrum has been observed during the LHSs of a set of BH X-ray sources. It has been associated with steady relativistic jets and outflows (Gallo et al., 2003). BH transients are usually observed in the LHS when their luminosity is less than 5 % of the Eddington luminosity. The HSS, in contrast to the LHS, is dominated by a thermal component with a characteristic temperature of 0.5–1.0 keV, which is attributed to bright emission from an optically thick accretion disk. In the HSS the power law index is steeper (2.0) and variability is suppressed to not more than several percent (which is dominated by red noise, i.e. ). The LHS and the HSS are the most well observed and documented BH states. During transitions between them, a BH source enters an IS, where the source may exhibit diverse behavior with mixed LHS and HSS properties. Homan & Belloni (2005) considered the phenomenology of the IS in detail and introduced two substates, which they call hard intermediate state (HIMS) and soft intermediate state (SIMS) (See also Belloni, 2005; Belloni et al., 2006). For the HIMS the energy spectrum is softer than in the LHS and the thermal component is more pronounced. The PDS is still dominated by band-limited noise with characteristic frequencies higher than those observed for the LHS. Radio emission is also observed in the HIMS, but with a slightly steeper spectrum. In the SIMS the disk component starts to dominate the energy spectrum and further softening is observed. The total rms variability drops sharply. The PDS is a sum of band-limited and power law components, or is sometimes even more complicated in shape. This subdivision of IS into HIMS and SIMS is consistent with the behavior of GRO J1655-40 during the hard-to-soft transition that we observed, so we adopt this terminology when we want to refer to a particular intermediate substate. In our data we identify LHS, HIMS, SIMS, and HSS periods.
The X-ray binary GRO J1655–40 is a well known example of BH X-ray transient, having undergone several major outbursts within the the last 12 years. It was discovered by the BATSE instrument onboard the Compton Gamma-Ray Observatory in mid 1994 (Zhang et al., 1994; Harmon et al., 1995). The secondary star being relatively bright, the binary parameters are exceptionally well determined amongst LMXBs. The most recent optical photometry of Green, Bailyn & Orosz (2001) led to a BH mass estimate of . Hjellming & Rupen (1995) inferred a distance to GRO J1655–40 of kpc from radio jet analysis. Mirabel et al. (2002) discussed in detail different methods of distance estimates and concluded that for GRO J1655–40 the upper limit is 3.5 kpc and the lower limit is 0.9 kpc. The light curve of the discovery outburst was irregular, in the sense that it deviated substantially from the often seen fast-rise exponential decay form (Chen, Shrader & Livio, 1997). It was instead characterized by several distinct peaks, with subsequent sporadic, lower amplitude outburst activity continuing into 1995. These initial events were correlated with the contemporaneous radio observations. Most notable was the discovery of radio jets which exhibited apparent superluminal motion (Harmon et al., 1995; Hjellming & Rupen, 1995; Tingay et al., 1995). The later, low-amplitude events however, were apparently not associated with additional plasma ejections leading to the type of radio emission initially seen (e.g. Tavani et al., 1996). In April 1996, after a short period of quiescence, a new outburst appeared in the data of the Rossi X-ray Timing Explorer (RXTE) All-Sky Monitor (Remillard et al., 1996). This event also consisted of two giant flares which lasted 100 and 222 days. Although the radio behavior was far less dramatic, extensive RXTE coverage allowed this outburst to be studied in greater detail than the 1994–1995 events. However, pointed RXTE observations started when the source was already in the HSS and the state transition was not covered. The 2005 outburst was recognized at a very early stage and observers at different wavelengths were relatively prepared and successful at responding relatively quickly. In this paper we present the analysis of the first multi-frequency observations of an initial hard-to-soft state transition for a GRO J1655–40 outburst. The data comprise one the most detailed multi-frequency observations of the initial hard-to-soft transition in a BH transient [see Brocksopp et al. (2002) for a review of the observed state transitions in BH sources].
On February 17, 2005 (MJD 53419) RXTE Proportional Counter Array (PCA) bulge scan observations detected emission consistent with coming from the position of GRO J1655–40 and strongly suggested a new outburst (Markwardt & Swank, 2005). The flux in the 2-10 keV band was 4.1 +/- 0.6 mCrab. Near infra-red (NIR) J photometry on February 20.39 UT found the source 0.5 mag brighter than at its brightest in quiescence (Torres et al., 2005) and the NIR activity was confirmed on February 21.3-21.4 (Buxton, Bailyn & Maitra, 2005). NRAO Very Large Array Radio Observatory (VLA) observations on February 20.6 found that it was again a detectable radio source (Rupen, Dhawan, & Mioduszewski, 2005). A campaign of daily pointed RXTE observations started on February 21, 2005 (MJD 53423). These observations and the PCA bulge scans triggered our program of Target of Opportunity (ToO) observations with INTernational Gamma-Ray Astrophysical Laboratory (INTEGRAL), the goal of which was to characterize the early-rise phase of X-ray nova events. Subsequently the source brightened and triggered other programs for observing bright transients. The observations we consider in this paper span a 25 day period starting on 21 February 2005. We have utilized the radio flux-history from an ongoing program of transient monitoring at the VLA. The outburst was also monitored by the Swift observatory with a series of pointed observations (Brocksopp et al., 2006), the first of which fell on the initial LHS within the time frame of the data reported here. The source was observed extensively until the outburst faded, by RXTE (Homan et al., 2005a, b, c) and other missions.
In this paper we report on the results of our multi-wavelength observational campaign, beginning with the outburst detection and ending on March 16, 2005 (MJD 53445) after the source completed the hard-to-soft state transition. The data are described in §2. Our analysis of the INTEGRAL and RXTE observations is presented in §3. This includes light curve analysis as well as our spectral model fitting. We discuss dipping behavior in §4. Interpretation and conclusion are presented in §5.
2 Observations and Data Analysis
Our data combine programs of target of opportunity as well as publicly available observations from RXTE, INTEGRAL, the VLA, the Robotic Optical transient Search Experiment (ROTSE) and the Small and Moderate Aperture Research Telescope System111http://www.astro.yale.edu/smarts/(SMARTS. Below we provide details for each data set.
2.1 RXTE
RXTE’s campaign of pointed observations of the new outburst from GRO J1655–40 started on February 21, 2005 (MJD 53422) and provided data on almost a daily basis. Observations were taken under the following RXTE Proposals: 90058, 90428, 90404, 90704 and 91702. In addition to Standard PCA data modes, high time and energy resolution data were collected. For low and moderate count rates an Event mode with microsecond time resolution in 64 energy bins was collected. For high source fluxes the high resolution data were provided by two Single Bit Modes covering PCA channels 0-13 and 14-35 respectively, along with an Event mode for counts registered in channels above 36.
Data from the deep monitoring proposal 91702 were made publicly available and Homan et al. (2005) also posted energy and power spectra, as well as light curves. These observations began on March 7, 2005 (MJD 53436) shortly after the source started the transition from the LHS. We have used data from some of these observations to put the LHS and the IS in the context of the developing outburst. We reduced and analyzed them ourselves together with the previous data for a uniform treatment.
The data reduction and analysis was performed using FTOOLS 5.3 software. For spectral analysis we use the PCA Standard2 data mode and the Standard Archive HEXTE Mode. Standard dead time correction was applied to all spectra. Spectra were modeled using the XSPEC11.0 astrophysical fitting package. We used 3.0-30.0 keV and 18.0-300.0 keV energy intervals for PCA and HEXTE data correspondingly. We added 1% systematic error to the data during our spectral analysis. The uncertainties on spectral model parameters were calculated using 1 confidence intervals. For Fourier Analysis we use high time resolution PCA data modes, combining counts from different modes to get a signal from the entire PCA energy range. After rebinning the data to obtain the Nyquist frequency value of 1024 Hz we calculate individual power density spectra (PDS) for consecutive 128 second intervals and averaged them for each RXTE orbit. For timing analysis we utilize our own IDL Library routines.
2.2 INTEGRAL
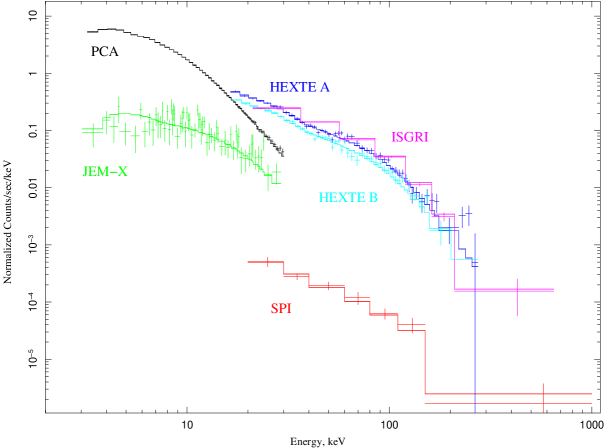
An INTEGRAL Target of Opportunity (ToO) observation of GRO J1655–40, previously approved as part of the General Program (see Winkler et al., 2003), was performed between MJD 53425.21 and MJD 53427.60. The observations consist of a series of dither pointings lasting between 58 and 146 minutes each. In our case a total of 49 pointings were included in the analysis. Data from the INTEGRAL hard X-ray instruments IBIS/ISGRI and SPI, as well as from the X-ray monitor JEM-X were used in our analysis. All three instruments use the coded mask imaging technique. Data reduction was performed using the standard OSA 5.0 analysis software package available from the INTEGRAL Science Data Centre (Courvoisier et al., 2003). Note that because of the nature of coded mask imaging, the whole sky image taken by the instrument has to be taken into account in the analysis, as all sources in the field of view contribute to the background (Caroli et al., 1987). The total exposure time of 178 ks is the ISGRI effective on-source time. This value is approximately the same for the spectrograph SPI (186 ks), but the JEM-X monitor (17.5 ks) covers a much smaller sky area. Thus in the case of dithering observations, the source is not always in the field of view of the monitor.
In order to achieve more complete time coverage, we added IBIS/ISGRI data of GRO J1655–40 provided by INTEGRAL’s Galactic Bulge monitoring program (PI E. Kuulkers). Within this program GRO J1655–40 was observed once every orbit (i.e. every three days) for 12.6 ks (Kuulkers et al., 2006).
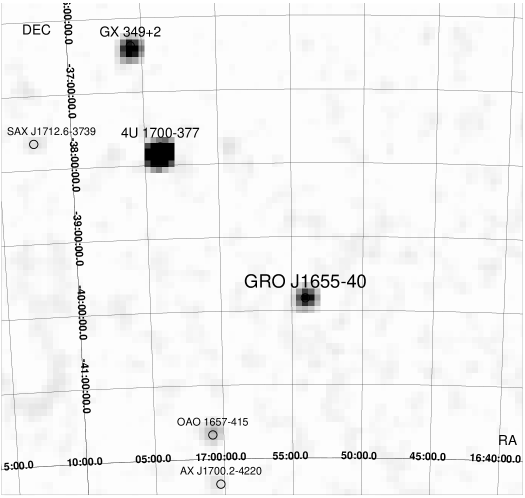
The analysis of the ISGRI data is based on a cross-correlation procedure between the recorded image on the detector plane and a decoding array derived from the mask pattern (Goldwurm et al., 2003). Imaging analysis led to a detection significance of , , and , for the ISGRI (20 – 200 keV), SPI (20 – 200 keV), and JEM-X (3 – 35 keV) data, respectively.The INTEGRAL IBIS/ISGRI 20 – 40 keV significance map is shown on Figure 1. No nearby point sources are detected closer than 1∘ (RXTE Collimator FWHM) and brighter than a mCrab above 20 keV.
2.3 VLA
The radio data are presented in Table 1. The data were taken with the VLA in its ‘B’ configuration, using standard continuum modes to obtain two 50 MHz IF pairs of right- and left-circular polarization, for a total bandwidth of 200 MHz. Flux densities were derived from 3C 286, which was also observed during most runs. Phases were calibrated using interleaved observations of strong nearby point sources. The data were reduced using the 31DEC04 version of the National Radio Astronomy Observatory’s (NRAO’s) AIPS package (e.g. Bridle & Greisen, 1994).
Observations were made at 1425, 4860, 8460 and 22460 MHz. No extension is seen in any of the images, for which the typical resolution was arc-seconds, oriented roughly north-south. Gaussian fits to each image showed no convincing elongations, with typical upper limits of 0.8 to 1 arc-seconds at 8.46 GHz. The 1-sigma flux uncertainties are listed in column 6 of Table 1. From these values it is seen that absolute flux calibration is accurate to typically 10-15%. Upper limits in the figures are the sum of the nominal flux density at the position of the source, plus three times the rms noise.
While the observed position of the source shifts significantly from epoch to epoch, this is probably simply due to variable atmospheric effects at the low elevations required at the VLA to observe such a southern source. Indeed, shifts of similar magnitude are seen between the different observing frequencies on a given day, and other sources in the field at 1.4 and 4.9 GHz also move around from epoch to epoch. Minimizing the effects of outliers, and removing two observations which were clearly unreliable, we obtain a mean (J2000) position in arcseconds of
where the error bars were derived after adding 0.5 arcsec in quadrature to the statistical errors found for each individual image, as required to give an average L1 deviation of from this mean. Within errors this position is consistent with the optical position that Bailyn et al. (1995) found in 1994. The measurements are not accurate enough to detect the proper motion of 5.2 mas yr-1 derived by Mirabel et al. (2002).
2.4 Optical Data
We use data from ROTSE (ROTSE, Akerlof et al, 2003) for the optical light-curve (Smith, 2005). ROTSE images are unfiltered, calibrated to the USNO A2.0 R band, and then converted to flux units via numerical integration of the CCD response function.
From SMARTS we use the data obtained by Buxton, Bailyn & Maitra (2005) in B, V, I, J and K bands with the ANDICAM instrument on the SMARTS 1.3m telescope at Cerro Tololo Inter-American Observatory on February 21 (MJD 53422.3-53422.4). Optical magnitudes at quiescence were taken from Green, Bailyn & Orosz (2001). The latter’s uncertainty in period would imply the photometric phase was within about 0.1 of 0.97.
3 Results
3.1 Multi-frequency Evolution
The radio, optical, and X-ray light curves are shown on Figure 2. In Figure 3 we plot several interesting properties of the source that we derived from the data. The rising stage of the outburst consists of three distinct phases. Specifically, after an initial 5 day rise from to mCrab (2–10 keV), the source dwelt for days in the LHS. On March 4 (MJD 53433) the flux started rising again, accompanied by a gradually softening spectrum indicating that the source entered the hard-to-soft transition phase. We follow the spectrum evolution for a month beginning from the start of RXTE pointed observations, when the source was in low-hard state (LHS), to the point where the source completes the transition to the high-soft state (HSS). We divided the period of interest into the three intervals, according to the source state. We also subdivide the IS into two substates according to the Homan & Belloni (2005) classification. On Figure 4 we show representative energy and power spectra for each interval.
3.1.1 Low-Hard State (MJD 53418 to 53435)
The LHS stage lasted from the detection on February 17 (MJD 53418) through March 6 (MJD 53435). After an initial 10 day rise with no detected spectral change, the source entered a rather stable period that lasted for approximately 5 days with roughly constant X-ray flux and hardness. The X-ray spectrum is well-fit by a power law of index 1.5, while less than 10 % of the emission is in a thermal component. The PDS is represented by a broken power law typical for the LHS (also known as band-limited noise). The lower frequency part is usually flat, while after a brake the slope is 1–1.5. The low frequency QPO shows above this continuum as a narrow peak (see Figure 4, panel A). The luminosity at this juncture was about 0.5% Eddington (for the distance of 3.2 kpc and the mass of 6.3). The flat spectrum radio source is roughly steady at . Buxton, Bailyn & Maitra (2005) and Torres et al. (2005) concluded the optical magnitudes were within the amplitude range of quiescent ellipsoidal variations, while the infrared (J and K) were linearly elevated but again roughly steady during this period. A high energy cut-off is observed (but sometimes with only marginal significance) in the X-ray energy spectrum. On March 3 (MJD 53432) the source entered a phase of exponential rise. However, the HIMS, designated by a start of softening (see Figure 3), only starts three days later.
We combined radio, optical and X-ray data to construct the multi-frequency energy spectrum of the LHS shown on Figure 5. The data are quasi-simultaneous in a sense that we combine radio and X-ray data closest in time to the optical observations and the time offset between observations in different wavelengths does not exceed 24 hours. The overall spectrum is similar to the broadband LHS spectra for four other BH sources presented by Gallo et al. (2003). The radio shows a rather flat spectrum such that if it were extrapolated to higher frequencies as a power law and the (unabsorbed) X-rays were extrapolated to lower frequencies as a power law, they would meet in the near infra-red range at eV. This is similar to the IR break for GX 339-4 (Nowak et al., 2005). The optical data have an approximately black-body shape with eV. On Figure 5 we plot the total observed optical fluxes, the average quiescent levels, and outburst fluxes calculated as the total minus the average quiescent flux. The low temperature of this component suggests that the outer accretion disk is its origin. Using the average quiescent fluxes should give an underestimate of the fluxes and an overestimate of kT, if the phase was indeed near the shallower V band minimum.
3.1.2 Intermediate State (MJD 53435 to 53442)
Hard Intermediate State
The period from MJD 53435 through MJD 53440 is marked by a roughly exponential rise in the X-ray flux, with the X-rays gradually softening. The 2–10 keV flux rises by over an order of magnitude during this interval. Also a rise in the optical flux was observed with ROTSE. Power law fits to the X-ray and optical data sets give characteristic rise times of 3–4 days, with the rise being slowest in the optical and hard X-rays. The rise of the 2–10 keV flux reflects the gradual softening of the source, seen also in the power law index (Figure 2) . The radio data are sparse, but they indicate a turn-over in the source flux and a steepening of the spectrum. There is no sign of the factor increase like that of the simple radio-to-X-ray scaling observed for some black hole transients rising to the HSS transition Gallo et al. (2003). For this outburst of GRO J1655–40, at least, the radio emission is quenched relatively early in the evolution.
The high energy cut-off in the X-ray spectrum during the IS becomes much more pronounced, before disappearing in the HSS. The same cut-off phenomenology (i.e. marginal in the LHS, strong in the IS, absent in the HSS) was also observed in 4U 1543–47 (Kalemci et al., 2005) and XTE J1550–564 (Tomsick et al., 2001). The timing properties rapidly evolve during this stage. The QPO frequency rises from 0.5 to 2 Hz. However, the overall shape of the PDS remains similar to that of the LHS, with increasing characteristic frequencies (Figure 4, panel B).
Soft Intermediate State
A remarkable quick change in the proprieties of the source emission occurred between MJD 53439 and MJD 53440 in all wavelengths. First, the radio emission disappears and the optical flux levels off. A sharp rise in X-ray luminosity, by a factor of 2 from 0.02 to 0.04, occurs (see also Figure 10), which is in agreement with the luminosity for a rise-phase hard-to-soft state transition in BH sources given by Meyer-Hofmeister et al. (2005). The spectrum abruptly softens from photon index 1.7 to 2.1. The total variability drops below 10%. A red-noise-like continuum feature appears above the broken power law (Figure 4, panel C). During the next RXTE observation on MJD 53441 the source flux recedes back to the level consistent with the exponential rise of the HIMS and we have the last detection of the low-frequency QPO, at an increased frequency of around 17 Hz. After that the flux starts to level off and the source enters the HSS.
3.1.3 High-Soft State (MJD 53442 and beyond)
The final stage in this early evolution is the HSS, from MJD through the end of the period considered here. This is characterized by the rapid and somewhat jittery softening of the X-ray spectrum, the disappearance of the radio emission and a relatively stable optical flux. The energy spectrum is dominated by a thermal disk component and no low-frequency QPO or band-limited noise component is detected (Figure 4, bottom panel).
Brocksopp et al. (2006) identified MJD 53440 (March 11) as an approximate date of the LHS-HSS transition. This conclusion is based on the behavior of the SWIFT/BAT light curve. Our data sampling and broad band energy coverage resolve distinct HIMS and SIMS states between the LHS and the HSS. The HIMS-SIMS transition transition occurs on 53440; our analysis is thus consistent with the Brocksopp et al. (2006) estimate.
3.2 Spectral Modeling of the X-ray data
3.2.1 LHS broadband X-ray spectrum
During the 2.4 days of our INTEGRAL observation, the spectrum did not change noticeably. There were RXTE observations at the beginning, midpoint, and end of this period. We have used the sum of these observations (RXTE observation IDs 90058-16-04-00, 90428-01-01-00, 90058-16-05-00, and 90428-01-01-01) to construct the composite spectrum shown on Fig. 6. The spectrum is approximately an absorbed power law, with photon index 1.4, typical of LHS spectra of accreting BHs ( for 344 degrees of freedom). But the fit is significantly improved with more complex models. The results for the continuum are presented in Table 2. We applied several different models that are often used to capture the properties of a thermal disk and a Comptonizing corona. Here we summarize the results for the composite spectrum, but we discuss the models further in the following section, in the context of the evolution of the spectrum as the outburst develops. In §4 we discuss the alternative of synchrotron and synchrotron self-Compton mechanisms for the emission in the LHS.
The fit is greatly improved with addition of a black body component, an emission line due to iron and a high energy exponential cutoff ( for 338 degrees of freedom). A narrow line at has equivalent width of 97 eV. Comptonization and reflection models both give fits of similar quality and the value is not grounds for favoring one over the other. The XSPEC BMC model, named “Bulk Motion Comptonization” for its applicability to the case of Comptonization of seed photons in plasma with high velocity bulk motion, employs a self consistent convolution of a Planck function with a Green’s function accounting for Compton scattering. This should best represent the physical situation when soft disk photons are up-scattered in a hot corona. We also fit the data with the model representing Comptonization in a thermal cloud (XSPEC’s COMPTT model). In this model the effective electron temperature is the fit parameter. The best-fit value of 37 keV is less than what one would expect from the cut-off, i.e. [this approximate relation follows from the comparison of the analytical model for unsaturated Comptonization (Sunyaev & Titarchuk, 1980) with the results of Monte-Carlo simulations (Titarchuk, 1994)]. However, the difference is qualitatively understandable considering the error bars on and the effects on the COMPTT spectrum of the optical depth. The model of reflection of a power law source from a cool disk (XSPEC’s PEXRAV implemented by Magdziarz & Zdziarski 1995) also provides an acceptable fit to the combined spectrum. During the fitting procedure we fixed the abundances of iron and heavy elements to cosmic values. We also used the inclination angle value determined by Orosz & Bailyn (1997). We assumed interstellar Galactic absorption column of cm-2 (Dickey & Lockman, 1990). In modeling the combined LHS spectrum we allowed cross-normalization constants for each instrument with respect to the RXTE PCA. The best fit cross-normalization values are given in Table 3.
3.2.2 RXTE/PCA spectral evolution
In the disk plus corona model, thermal radiation is presumably generated in the inner accretion disk. Some portion of these photons are Compton scattered in a hot, optically thin media (corona) situated above the disk. The photons escape diffusively, with electron scattering being the dominant source of opacity. The spectrum observed at infinity consists of a soft component coming from input photons that escaped after a few scatterings and of a power law that extends to high energies comprised of photons that underwent significant up-scattering. The spectrum emitted by a part of the accretion disk not covered by a corona is thermal and ideally should be represented by either a black body shape with keV or an integral over temperatures for the multicolor disk model (MCD, DISKBB in XSPEC), (Mitsuda et al., 1984). However, we found that real situation is more complicated especially in the HSS where we need two thermal components to fit the spectrum (see discussion below).
The BMC model in XSPEC was developed as a generic Comptonization model by (Titarchuk et al., 1997) to treat Compton upscattering of low-frequency photons in a converging flow of thermal plasma onto a black hole. It can describe the production of a steep power law component in the BHC HSS. Soft seed photons in the BMC model are assumed to have a pure black body energy distribution with temperature . A fraction of the input spectrum is Comptonized in the hot corona, while the other part leaves the system unchanged. However, in the lower , low-hard state configuration, reduced Compton cooling of ambient plasma leads to electron temperatures much higher than that of the converging inflow. The thermal source is then not seen, and scattering from the higher temperature plasma dominates the observed emission. The BMC model is applicable in the general case of Comptonization when the bulk and thermal electron motion are included. This model can be used provided the electron temperatures involved are higher than the mean photon energy. At higher photon energies, the spectrum exhibits a cutoff at 100-200 keV, indicating the photon energies are on the order of the electrons thermal energy, and the cutoff multiplying the BMC model represents the effect the electron energy distribution would have. This model is convenient for describing the evolution of a BHC through different states and is based on a theoretical picture.
The reflection model PEXRAV along with DISKBB can also describe the spectral changes of BHCs, although it does not itself provide an underlying rationale for the changes that occur. In principle, effects of reflection should be added to the BMC model. However, the models are too much alike in functional form for the fits to the data to separate the contributions to the continuum.
To examine the time evolution of the energy spectrum, we analyzed RXTE/PCA data from the beginning of the outburst until March 15, 2005 (MJD 53444), when the source has completed the LHS-to-HSS transition. Following the above discussion, we fit the data to BMC+GAUSSIAN and PEXRAV+DISKBB+GAUSSIAN models.
The results are given on Figures 7 and 8. for BMC and PEXRAV model application correspondingly. In fitting the PEXRAV model we let the photon index and reflection factor change freely and fixed the abundance of iron and heavy elements at 1.0. The spectral index given by fits to the BMC model rises from the value of 1.4 for the LHS to 1.8 during the state transition, and reaches 2.2 for the HSS, while the PEXRAV model results in power law spectral indices 0.2-0.4 higher. The disk component is insignificant during the LHS and the entire IS for the PEXRAV model. For both models a Gaussian with the centroid energy of keV was included to model an iron line. For the LHS the iron line is mostly narrow (sigma 1 keV). The equivalent width (EW) of the line is 200 eV for BMC and keV for PEXRAV, both within the range expected from the cold disk reflection. However, after the transition, the Gaussian derived in the fits becomes much broader, with sigma 1.5–2.0 keV and the EW of the feature grows by a factor of 3-5. Reflected iron lines have been calculated for a variety of conditions. Equivalent widths this high, and also very broadened lines features, can be obtained (e.g. Dabrowski & Lasenby, 2001; Martocchia, Karas, & Matt, 2000; Ballantyne, Fabian & Ross, 2002), but only for special extreme conditions of position of the source relative to a maximally rotating black hole or high over-abundance of iron. High iron line EWs were obtained in models of reprocessing in a wind from the central source (Laming & Titarchuk, 2004), but this model did not give large widths and is besides not thought to be applicable to the HSS. Alternatively, the high width of the Gaussian may indicate that the model component, initially intended to model a narrow spectral line, is trying instead to mimic some part of the broader underlying continuum not included in the model. Our analysis also shows that a pure BMC model (with additional GAUSSIAN fixed at 6.5 keV for an iron line) during the HSS is not statistically acceptable (2.0). We attribute this behavior to the fact that the accretion disk emission is not well described by a pure black body. We attempted to resolve the issue by replacing the unscattered black body component of the BMC component by a multi-color disk component (i.e. DISKBB). The quality of fit was slightly improved; however the behavior of the Gaussian remained the same, with very high widths and EWs required.
Secondly, we replaced the Gaussian in the BMC+GAUSSIAN model by a simple black body shape. The model fit was dramatically improved. We obtained the following properties of this alternative model. The temperature of the new soft thermal component is approximately half of the BMC’s seed photon temperature. The temperature of the seed photons, in turn, slightly increased, compensating for the line-like continuum residual. The narrow iron line is only needed for the LHS and the IS (see Figure 9). For the HSS, a good fit is achieved with BMC and soft black body only. Interestingly the narrow iron emission line, with an energy consistent with fluorescence increases in flux along with the increase in the non-thermal spectrum that might excite it from the disk material and disappears when the spectrum becomes steep and dominated by the thermal emission. A soft thermal component might be emission from larger radii of the accretion disk than the source of seed photons for the BMC. Its temperature is consistently lower than the temperature of incoming photons for the BMC component. In fact, the relation holds throughout the entire time period of interest. The soft black body component is barely significant for the LHS and its contribution grows towards the HSS. This fact is consistent with the conventional scenario, in which the size of the corona shrinks as the accretion rate increases and the source enters the state transition. The size of the uncovered disk increases, allowing for a greater contribution of the soft component. The temperature of this component grows with approach to the HSS, which is also in agreement with the implied picture as inner parts of the disk should supply the hotter photons. From the same reasoning it is clear why the multi-color disk does not work in this case. In the DISKBB model, the normalizations of the inner and outer parts of the disk are locked together by the integration over the radius with the temperature profile. In the real situation, a part of the radiation from the inner component is taken away by Comptonization. This imbalance is not accounted for the XSPEC DISKBB model.
Recently, several models were developed which take into account effects not handled correctly in the DISKBB model. The KERRBB model (Li et al., 2005) is the most inclusive. We tested this model on the observation during the HSS on MJD 53443 (March 14) (RXTE Observation ID: 91702-01-03-00). We fit the PCA spectrum with a model consisting of KERRBB+BMC with the thermal component of the BMC model suppressed (by fixing log(A) parameter at 7.0). For the KERRBB component we fixed the inclination angle at 70∘, the distance at kpc and the BH mass at 6.3 and fcol=1.65. We also fixed the parameter at zero, which corresponds to a standard Keplerian disk with zero torque at the inner boundary. The best fit gives . Addition of a Gaussian with the energy fixed at 6.5 keV results in an acceptable . The equivalent width of the feature is a reasonable 210 eV. The best fit value of the specific angular momentum of the black hole is , somewhat less than the 0.65-0.75 found by Shafee et al. (2006) with the same fcol for RXTE’s 1997 observations. More detailed modeling would be needed to determine whether the line width of 1.2 keV could be accommodated in terms of Doppler shifts and reddening. KERRBB can handle corrections to the basic disk picture that are known to be needed and these seem to be on the order of the discrepancy between the data and the simple disk approximations. It needs to be used in attempting to separate line emission, reflection, and possible structure of disks, as well as to determine the black hole’s angular momentum.
3.3 Intensity Dips
In the 1996/97 outbursts, when the source was in the HSS, a variety of dips were observed (Kuulkers et al. 2000 (K00 hereafter); Kuulkers et al. 1998; also see Tanaka, Ueda & Boller (2003), regarding dips during the 1994 outburst). In the case of our current campaign, the source remained for the most part in the LHS. Nonetheless, examination of the 16-s standard mode light-curve data also revealed dips. This is a little surprising, as the dips are widely believed to be associated with partial occultation of the central disk region by the accretion stream or by more complex geometrical accretion configurations. The LHS emission on the other hand, consists of Comptonized photons, presumably scattered from plasma ambient to the disk. There have been arguments that this scattering media is large compared to the inner disk region where the thermal X-radiation emanates (e.g. Hua, Kazanas & Cui, 1999) That would seem to make the mechanism which produces the HSS dips less effective for the LHS case. In any case, K00 find that for the case of the 1996/97 outburst, the HSS dips occupy a relatively narrow, approximately Gaussian distribution when plotted as a function of phase. Specifically, they find that the dips are approximately described by a Gaussian centered on phase 0.785 with a sigma of 0.046.
To study the dipping behavior in our data, we examined the entire 16-s standard-mode light curve, which of course has gaps; see Figure 11 for examples. For the ephemeris calculation we used the zero spectroscopic phase 2,449,839.07630.0055 JD of Orosz & Bailyn (1997) and the 2.621910.00020 day binary period of Green, Bailyn & Orosz (2001), which is calculated consistently with the Orosz & Bailyn (1997) data. We shifted by 0.75 phase to obtain an equivalent photometric phase zero of 2,449,841.04270.0055. The day uncertainty in the period, combined in quadrature with the uncertainty in the phase zero determination translates to an uncertainty of 0.11 phase in our data.
We identified instances where the intensity dropped by 50% or more, relative to the local average, in at least one bin, at a significance level of at least 5 sigma. We found 46 dips in total, 28 in the LHS, 10 in the IS, and 8 in the HSS. We then sorted the dips into orbital-phase bins using the ephemeris information as described. This resulted in the distribution shown in Figure 12. Note that while our dips are still relatively narrowly distributed in phase, they are centered on phase 0.5, with substantially more dispersion than K00 found for the 1996/97 case. But even with the 0.11 phase uncertainty the distribution appears shifted significantly (at about the 2 level) in phase relative to K00. Furthermore, we find no dips within the narrow phase-0.79 centered distribution of K00 at a 1.5- level of confidence.
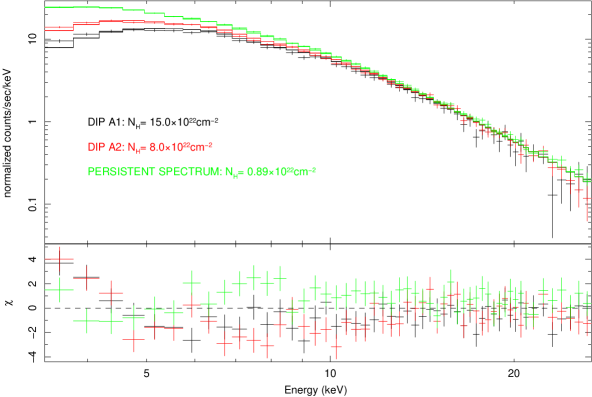
We do not have as large a statistical sample as K00 (46 versus 65). Nonetheless, it is interesting that K00 observed no intensity dips near phase 0.5-0.6, or any other phase significantly different from 0.8. This is at least suggestive of a different mechanism in the LHS configuration of the system. Another difference is that our spectral analysis finds that pure photoelectric absorption provides an adequate explanation (see Figure 13). In addition, we examined public data spanning approximately from MJD 53445–53460, i.e. after the onset of the high-soft-state transition. We find a dearth of dipping activity in that portion of the data.
We note that Tanaka et al. (2003) reported unusual dipping behavior during an ASCA observation of GRO J1655–40 in 1994. In that case, the dip profile was significantly broader, with a width of several hours, while ours are typically several 16 s bins wide. They reported that it occurred in the HSS when the secondary was on the far side of the black hole, and that their spectral analysis was consistent with a multi-layer partial covering. Most of the dips we observed are not in the HSS (though a few are) and our spectral analysis is consistent with pure photoelectric absorption by a single phase medium. Thus, we tentatively conclude that we are seeing events of a distinct nature from that observed in 1994. Speculatively, it could be that we are sampling the effects of narrowly collimated accretion stream(s) while Tanaka et al. (2003) observed effects associated with irregularities in the geometrical configuration of the outer disk.
4 Discussion and Conclusions
We have studied multi-frequency data spanning the early stage of the 2005 outburst of GRO J1655-40. The empirical behavior observed includes: spectral transition from the LHS through the HIMS and SIMS to the HSS, accompanied by the expected rise in the thermal component and a steepening of power law spectral index; QPO appearance and its frequency rise throughout the LHS and the intermediate states and its turnoff upon entering the HSS; a high-energy cut off in the LHS and IS; intensity dips during the LHS which are consistent with photo-electric absorption and correlated differently with orbital phase than the HSS dips observed by K00 for the 1996–1997 outburst.
We observe rising radio emission during the LHS, a declining radio flux in the HIMS and its turn off in the SIMS. The radio data from MJD 53433 are unique in showing a pronounced peak at 5 GHz. X-ray binaries in the LHS typically produce a very stable, flat-spectrum radio source, as seen here in the plateau stage. A 5 GHz peak is highly unusual, and suggests an expanding, optically-thick source, typical of the early stages of jet ejection. The radio coverage allows only poor limits on the ejection date (later than MJD 53429, earlier than 53433), but it is tempting to associate this ejection with the abrupt change from a steady to a sharply brightening X-ray corona. In this context it is also interesting that during the X-ray exponential rise, the radio flux was comparatively steady, with a marginal steepening of the spectrum. While the latter is not convincing on any given day, the radio spectrum is consistently flatter (harder) during the plateau stage, and steeper (softer) during the exponential rise. Taken together with the decoupling between the X-ray and the radio flux, it seems likely that the radio emission here has a different physical origin from that during the plateau. The plateau seems much like the standard LHS, in the ratio of X-ray to radio fluxes, and the flat radio spectrum, suggestive of a compact core. The radio emission during the HIMS may instead be a more extended jet, though it is far from obvious why that jet should be so stable (in flux density and spectrum).
Currently, there are two competing theories explaining the origin of the X-ray power law spectrum in BH sources. In the first, the “canonical” model, the power law slope is produced by Comptonization of the soft disk photons in the extended optically thin corona, located above the accretion disk. But Markoff et al. (2003, and references therein), argue that the power law component in the LHS can be attributed to a combination of the optically thin high energy tail of the synchrotron spectrum from the radio jet base and synchrotron self-Compton emission adding the highest energy component. In the framework of the model, the synchrotron jet base subsumes the role of the corona in Comptonization models (e.g. Nowak et al., 2005; Markoff, Nowak & Wilms, 2005). However, the lack of radio and X-ray correlation in our data make it difficult in the case of GRO J1655–40 to associate the base of a compact jet with the Compton-scattering corona which creates the power law X-ray emission. Gallo et al. (2003) found evidence for radio and X-ray correlation for several sources, though they also saw that in some cases the radio was quenched at some point in the X-ray rise. It is possible that the radio emitting region is larger than the X-ray corona, and not dominated by the X-ray emitting part. This would mean that the situation may be more complex. Recently the jet-base model has been subject to other observational challenges. Maccarone (2006) argued that if the LHS spectrum is due to the jet, which is radiatively inefficient in nature, the transition to the HSS should be accompanied by a sharp change in luminosity. While we observe a rather quick rise in the thermal component during the SIMS around MJD 53440 (see Figure 15), the corresponding power law flux does not drop, but jumps up together with black body component before it starts to decay smoothly. Overall, our analysis does not validate the jet-base model; however some presence of synchrotron and synchrotron self-Compton emission can not be ruled out.
It is apparent that the system is far from a steady state configuration during the LHS and the state transition. Most probably, the accretion disk, which is quiescent prior to the outburst, gradually gets involved in outburst activity by some instability propagating either from the innermost parts of the disk to the outside or from the outer disk to the inside(e.g. Cannizzo et al., 1995). Information from the QPO phenomena can give an important clue towards distinguishing between the two possible directions of the heat front propagation. For example, in the case of shock-wave or front propagation in the disk one could expect the X-ray flux to be modulated at the frequency of the disk Keplerian rotation at the radius of the shock location. If this process is indeed responsible for the observed flux oscillations, then the outward propagation scenario is not correct and the shock is propagating inward from larger radius, as advocated by Chakrabarti et al. (2005). However, there is evidence for a closer coupling of the QPO phenomena with the power law component than with the disk component, so that the accretion disk shock wave oscillation model for the oscillations is not compelling. QPO rms variability is found to to increase with energy (see van der Klis, 1995, and references therein). Vignarca et al. (2003) found a close correlation of power law spectral index with QPO centroid frequency for BH sources GRS 1915+105, GRO J1655–40, XTE J1550–564 and 4U 1630–47. For GRO J1655–40, Vignarca et al. used data from the 1996–1997 outburst. Figure 16 shows that in the 2005 outburst rise the spectral index was correlated with QPO frequency above about 0.8 Hz. Both the power law and the black body (seed photon source) fluxes were correlated with the frequency, while the radio flux is not (see Figure 14). In the BMC model, the power law flux and the black body are related. However, the spectral index is independent of QPO until a significant rise in flux has occurred. Qualitatively, these correlations are consistent with the BMC model and do not exhibit the same indications of a jet-base model shown in some other sources by Migliari (2005). There are other models that could relate this QPO frequency to the fluxes, such as that of the occultation of the power law component by a precessing disk ring (Schnittman, Homan & Miller, 2006). The dynamical consistency of such a ring and the connection to the spectrum of the disk component should be further investigated.
The location of dips has been discussed in terms of the impact of the accretion stream on the disk (e.g. Bisikalo et al., 2005). The location may be a function of the rate of accretion flow. The structure of the dips may put limits on the size of the emission region, as has been done for neutron star low mass binaries (e.g. Church, 2001). Detailed study of this is beyond the scope of this paper.
In summary, the 2005 outburst of GRO J1655–40 was observed intensely with X-ray instruments, with very interesting and diagnostic results. During the early phases there was good radio coverage, and less thorough, but nevertheless useful optical coverage. The X-ray data allow spectral fits to generic Comptonization and power law plus reflection models with a cutoff, multicolored disk and fluorescence. If the corona is really the base of a relativistic outflow, the radio flux does not exhibit the proportionality to the X-ray flux that is seen in some other BH sources, nor a simple anti-correlation of the flux between the power law and the disk components of the spectrum. Low frequency QPO seem to suggest that their origin, presumably at an interface between an optically thick and a coronal component, is moving inwards in radius, as the frequency is positively correlated with the luminosity in the power law, the luminosity in a disk component (and inversely with its inner radius), while the radio flux decreases as the QPO reaches its maximum. The spectra of the power law component are limited by a high energy cutoff, although we are unable to study this aspect in detail. While our study in this paper extends only to when the HSS began, the observations that followed will address many other points, including the degree of similarity of the decay of this transient to its rise.
We wish to thank J. Homan and collaborators for the use of the data from their proposal and E. Kuulkers and the ESA INTEGRAL Science Operation Center (ISOC) for providing the on-line Galactic Bulge Monitoring database.
References
- Akerlof et al (2003) Akerlof et al. 2003, PASP,15, 803, 132
- Bailyn et al. (1995) Bailyn, C. et al. 1995,Nature, 374,701
- Ballantyne, Fabian & Ross (2002) Ballantyne, D. R., Fabian, A. C., & Ross, R. R. 2002, MNRAS, 329, L67
- Belloni (2005) Belloni, T. 2005, astro-ph/0507556
- Belloni et al. (2006) Belloni, T. et al. 2006, 367, 1113
- Bisikalo et al. (2005) Bisikalo, D. V., Boyarchuk, A. A., Kuznetsov, O. A. 2005,Astronomy Reports, 49, 701
- Bridle & Greisen (1994) Bridle, A.H. & Greisen, E.W. 1994, AIPS Memo 87: The NRAO AIPS Project Summary
- Brocksopp et al. (2002) Brocksopp, C., et al. 2002, MNRAS, 331, 765
- Brocksopp et al. (2006) Brocksopp, C., et al. 2006, MNRAS, 335, 1203
- Buxton, Bailyn & Maitra (2005) Buxton,M., Bailyn,C.,& Maitra, D. 2005, The Astronomer’s Telegram, 418,1
- Caroli et al. (1987) Caroli, E., Stephen, J. B., Di Cocco, G., Natalucci, L., Spizzichino, A. 1987, Space Sci. Rev., 45, 349
- Cannizzo et al. (1995) Cannizzo, J. K., Chen, W., Livio, M. 1995, ApJ, 454, 880
- Chakrabarti et al. (2005) Chakrabarti, S., et al. 2005, astro-ph/0508024
- Chen, Shrader & Livio (1997) Chen, W., Shrader, C.R., & Livio, M. 1997, ApJ, 491, 312
- Church (2001) Church, M. J. 2001, Advances in Space Research, 28, 323
- Courvoisier et al. (2003) Courvoisier, T.J.-L., et al. 2003, A&A, 411, L53
- Dabrowski & Lasenby (2001) Dabrowski, Y., & Lasenby, A. N. 2001, MNRAS, 321, 605
- Dickey & Lockman (1990) Dickey, J.M., & Lockman, F.J. 1990, ARAA, 28, 215
- Gallo et al. (2003) Gallo, E., Fender, R. P., & Pooley, G. G. 2003, MNRAS, 344, 60
- Green, Bailyn & Orosz (2001) Greene, J., Bailyn, C. D., & Orosz, J. A. 2001, ApJ, 554, 2, 1290
- Goldwurm et al. (2003) Goldwurm, A., et al. 2003, A&A, 411, L223
- Harmon et al. (1995) Harmon, B. A. et al. 1995, Nature, V.374, 703
- Hjellming & Rupen (1995) Hjellming, R.M.,& Rupen, M.P. 1995, Nature, 375,464
- Homan & Belloni (2005) Homan, J., & Belloni, T. 2005, in From X-ray Binaries to Quasars: Black Hole Accretion on All Mass Scales, edited by Maccarone, T.J.,Fender, R.P., & Ho, L.C., Kluwer, in press
- Homan et al. (2005a) Homan, J., Miller, J. M., Wijnands, R., & Lewin, W. H. G.2005, The Astronomer’s Telegram, 487, 1
- Homan et al. (2005b) Homan, J., Miller, J. M., Wijnands, R., & Lewin, W. H. G. 2005, The Astonomer’s Telegram, 607, 1
- Homan et al. (2005c) Homan, J., Kong, A., Tomsick, J., Miller, J. M., Campana, S., Wijnands, R., Belloni, T., & Lewin, W. 2005, The Astonomer’s Telegram, 644, 1
- Hua, Kazanas & Cui (1999) Hua, X.-M.,Kazanas, D., & Cui, W. 1999, ApJ, 512, 793
- Kalemci et al. (2005) Kalemci, E., Tomsick, J. A., Buxton, M. M., Rothschild, R. E., Pottschmidt, K., Corbel, S., Brocksopp, C., Kaaret, P. 2005,ApJ, 622, 508
- Kuulkers et al. (1998) Kuulkers, E., Wijnands, R., Belloni, T., Mendez, M., van der Klis, M., van Paradijs, J. 1998, ApJ, 494, 753
- Kuulkers et al. (2000) Kuulkers, E. et al. 2000, A&A, 358, 993 (K00)
- Kuulkers et al. (2006) Kuulkers, E., et al. 2006, AIP Conference Proceedings, astro-ph/0603130
- Laming & Titarchuk (2004) Laming, J.M., Titarchuk, L. 2004, ApJ, 615, L121
- Li et al. (2005) Li, L.-X., Zimmerman, E. R., Narayan, R., McClintock, J E., 2005, ApJS, 157, 2, 335
- Maccarone (2006) Maccarone, T. 2006, MNRAS, in press (astro-ph/0503689)
- Markoff et al. (2003) Markoff, S., Nowak, M., Corbel, S., Fender, R., Falcke, H. 2003,A&A, 397,645
- Markoff, Nowak & Wilms (2005) Markoff, S., Nowak, M. & Wilms, J. 2005, ApJ, 635, 1203
- Markwardt & Swank (2005) Markwardt, C.B., & Swank J. H. 2005, The Astronomer’s Telegram, 414, 1
- Magdziarz & Zdziarski (1995) Magdziarz, P., Zdziarski, A. A. 1995, MNRAS, 273, 837
- Martocchia, Karas, & Matt (2000) Martocchia, A., Karas, V. & Matt, G. 2000,MNRAS, 312, 817
- McClintock & Remillard (2006) McClintock, J. & Remillard, R. 2006, to appear in Compact Stellar X-ray Sources, eds. W. H. G. Lewin & M. van der Klis (Cambridge: Cambridge Univ. press), astro-ph/0306213
- Meyer-Hofmeister et al. (2005) Meyer-Hofmeister, E., Liu, B. F., Meyer, F. 2005, A&A, 432, 1,181
- Migliari (2005) Migliari, S., Fender, R. P., van der Klis, M. 2005, MNRAS, 363, 1, 112
- Mirabel et al. (2002) Mirabel, I.F. , Mignani, R., Rodrigues, I., Combi, J. A., Rodrigues, L. F., Guglielmetti, F. 2002, A&A, 395, 595
- Mitsuda et al. (1984) Mitsuda et al. 1984, PASJ, 36, 741
- Nowak et al. (2005) Nowak, M. A., Wilms, J., Heinz, S., Pooley, G., Pottschmidt, K., Corbel, S. 2005, ApJ, 626, 1006
- Orosz & Bailyn (1997) Orosz, J. A., Bailyn, C. D. 1997, ApJ,482, 1086
- Remillard et al. (1996) Remillard, R., Bradt, H., Cui, W., Levine, A., Morgan, E., Shirey, B., Smith, D. 1996, IAUC 6393
- Rupen, Dhawan, & Mioduszewski (2005) Rupen, M. P., Dhawan, V., & Mioduszewski, A. J. 2005, Astronomer’s Telegram, 419, 1
- Schnittman, Homan & Miller (2006) Schnittman, J.D., Homan, J. & Miller, J. M. 2006,ApJ, 642, 420
- Shafee et al. (2006) Shafee, R., McClintock, J. E., Narayan, R., Davis, S. W., Li, L-X., Remillard, R. A. 2006, ApJ, 636, 2, L113
- Smith (2005) Smith, D. A. 2005, The Astronomer’s Telegram, 445,1
- Sunyaev & Titarchuk (1980) Sunyaev, R.A. & Titarchuk, L.G. 1980, A&A, 86, 121 (ST80)
- Tanaka, Ueda & Boller (2003) Tanaka, Y., Ueda, Y., Boller, Th. 2003, MNRAS, 338, 1, L1
- Tavani et al. (1996) Tavani, M.,Fruchter, A., Zhang, S. N., Harmon, B. A., Hjellming, R. N., Rupen, M. P., Bailyn, C., Livio, M. 1996, ApJ, 473, L103
- Tingay et al. (1995) Tingay, S.J., et al. 1995, Nature, 374, 141
- Titarchuk (1994) Titarchuk, L.G. 1994, ApJ, 434, 570
- Titarchuk et al. (1997) Titarchuk, L., Mastichiadis, A., & Kulafis, N.D. 1997,ApJ, 487, 834
- Tomsick et al. (2001) Tomsick, J.A., Corbel, S.,& Kaaret, P. 2001
- Torres et al. (2005) Torres M.A.P.,Steeghs, D.,Jonker, P.& Martini P. 2005, Astronomer’s Telegram, 417, 1
- van der Klis (1995) van der Klis, M. 1995, in X-ray binaries, ed. W.H.G. Lewin, J.,van Paradijs, & E.P.J. van der Heuvel (Cambridge Univ. Press, Cambridge), p. 252
- Vignarca et al. (2003) Vignarca, F., Migliari, S., Belloni, T., Psaltis, D., & van der Klis, M. 2003, A&A, 397, 729
- Winkler et al. (2003) Winkler, C., et al. 2003, A&A, 411, L1
- Zhang et al. (1994) Zhang, S. N., Harmon, B. A., Paciesas, W. S., Wilson, C. A., Fishman, G. J. 1994, IAUC 6106


| ccMean observing frequency. This is the arithmetic mean of two independently-tuned 50 MHz bands, observed simultaneously in both circular polarizations. | ddPeak flux density. Unbracketed numbers represent the observed peak, after removing a planar background fit to the surrounding pixels; see text. Bracketed numbers represent non-detections, and give the value at the known position of the source. | eeIntegrated flux density (for detections only), after removing a planar background fit to the neighboring pixels, as described in the text. This represents the sum of the believable emission from the source. Any difference between this and the peak flux density reflects uncertainties in the images. | ffRoot-mean-square (rms) noise in the image, as determined from a Gaussian fit to the distribution of flux densities in a region without any (known) emission. This represents a lower limit on the uncertainty in the flux density, and a comparison of the peak flux density to this rms noise gives a reasonable signal-to-noise ratio for judging the statistical reliability of a detection. | ggTime on-source, before flagging. Unless noted otherwise, this is a continuous observation, centered on the listed MJD, apart from interruptions for phase calibration. | ||
|---|---|---|---|---|---|---|
| DateaaUT date at mid-point of observations, before flagging | MJDbbModified Julian Day at mid-point of observations (before flagging): . | [MHz] | [mJy/beam] | [mJy] | [mJy/beam] | [min] |
| 2005 Feb 23hhThere were no contemporaneous observations of 3C 286 during this run. Instead, the flux density scale was set by linearly interpolating the flux density of the phase calibrator from surrounding observations. This additional error thus introduced is not significant for the data reported here. | 53424.5786 | 1425.0 | 0.11 | 21.3 | ||
| 2005 Feb 27iiObservations at 1425, 4860, and 8460 MHz on 2005 Feb 27 were made up of two sets of scans, separated by about an hour. The values reported here result from co-adding all of these data; the two sets of scans in all cases agree within with the averages reported here. | 53428.5184 | 1425.0 | 0.17 | 8.9 | ||
| 2005 Mar 4 | 53433.5088 | 1425.0 | 0.22 | 4.5 | ||
| 2005 Mar 6 | 53435.5149 | 1425.0 | 0.20 | 7.7 | ||
| 2005 Mar 9 | 53438.5695 | 1425.0 | 0.19 | 7.7 | ||
| 2005 Mar 10 | 53439.4845 | 1425.0 | 0.18 | 7.7 | ||
| 2005 Jan 4jjfootnotemark: | 53374.6404 | 4860.1 | [] | 0.13 | 8.4 | |
| 2005 Feb 20 | 53421.5750 | 4860.1 | 0.12 | 5.7 | ||
| 2005 Feb 23 | 53424.5891 | 4860.1 | 0.07 | 18.5 | ||
| 2005 Feb 24hhThere were no contemporaneous observations of 3C 286 during this run. Instead, the flux density scale was set by linearly interpolating the flux density of the phase calibrator from surrounding observations. This additional error thus introduced is not significant for the data reported here. | 53425.5089 | 4860.1 | 0.11 | 10.9 | ||
| 2005 Feb 27iiObservations at 1425, 4860, and 8460 MHz on 2005 Feb 27 were made up of two sets of scans, separated by about an hour. The values reported here result from co-adding all of these data; the two sets of scans in all cases agree within with the averages reported here. | 53428.5294 | 4860.1 | 0.06 | 17.7 | ||
| 2005 Mar 4 | 53433.5149 | 4860.1 | 0.10 | 6.6 | ||
| 2005 Mar 6 | 53435.5242 | 4860.1 | 0.11 | 7.6 | ||
| 2005 Mar 9 | 53438.5786 | 4860.1 | 0.10 | 7.9 | ||
| 2005 Mar 10 | 53439.4845 | 4860.1 | 0.11 | 7.7 | ||
| 2005 Mar 16 | 53445.5854 | 4860.1 | 0.07 | 25.2 | ||
| 2005 Feb 20 | 53421.5813 | 8460.1 | 0.15 | 5.6 | ||
| 2005 Feb 23 | 53424.5933 | 8460.1 | 0.08 | 11.5 | ||
| 2005 Feb 27iiObservations at 1425, 4860, and 8460 MHz on 2005 Feb 27 were made up of two sets of scans, separated by about an hour. The values reported here result from co-adding all of these data; the two sets of scans in all cases agree within with the averages reported here. | 53428.5402 | 8460.1 | 0.05 | 15.8 | ||
| 2005 Mar 4 | 53433.5241 | 8460.1 | 0.09 | 6.3 | ||
| 2005 Mar 6 | 53435.5341 | 8460.1 | 0.13 | 6.7 | ||
| 2005 Mar 9 | 53438.5886 | 8460.1 | 0.10 | 6.7 | ||
| 2005 Mar 10 | 53439.5019 | 8460.1 | 0.09 | 6.1 | ||
| 2005 Mar 14hhThere were no contemporaneous observations of 3C 286 during this run. Instead, the flux density scale was set by linearly interpolating the flux density of the phase calibrator from surrounding observations. This additional error thus introduced is not significant for the data reported here. | 53443.5210 | 8460.1 | [0.15] | 0.13 | 5.6 | |
| 2005 Feb 27 | 53428.5294 | 22460.1 | [0.27] | 0.30 | 8.5 | |
| 2005 Mar 9 | 53438.5971 | 22460.1 | [0.56] | 0.48 | 3.9 | |
| 2005 Mar 10 | 53439.5109 | 22460.1 | [] | 0.30 | 3.9 | |
| 2005 Mar 16 | 53445.5871 | 22460.1 | 3.2 |
Note. — Radio flux densities of GRO J165540, as observed with the Very Large Array. All observations represent continuous scans, and were taken in the VLA’s B configuration, unless otherwise noted. Fast switching was employed throughout. Phase calibrators were 1626298 at 1425.0 MHz; 1607335 at 4860.1 MHz and 8460.1 MHz; and 1650297 at 22460.1 MHz. The flux density scale was set by contemporaneous observations of 3C 286, unless otherwise noted.
| (POWER LAW + BLACK BODY)CUTOFFbbFor CUTOFF, the XSPEC multiplicative model HIGHECUT was used with fixed Ecut=0. |
|---|
| , |
| , keV |
| , keV |
| 1.16 (338) |
| BMCCUTOFF |
| , |
| , keV |
| , keV |
| 1.16 (338) |
| COMPTT + BLACK BODY |
| , keV |
| , keV |
| 1.23 (338) |
| (PEXRAV+DISKBB)CUTOFF |
| , |
| , |
| , keV |
| , keV |
| 1.15 (337) |
| Detector | |
|---|---|
| INTEGRAL | |
| ISGRI | |
| SPI | |
| JEM-X | |
| RXTE | |
| HEXTE A | |
| HEXTE B | |