Spitzer measurements of atomic and molecular abundances in the Type IIP SN 2005af
Abstract
We present results based on Spitzer Space Telescope mid-infrared (3.6-30 m) observations of the nearby IIP supernova 2005af. We report the first ever detection of the SiO molecule in a Type IIP supernova. Together with the detection of the CO fundamental, this is an exciting finding as it may signal the onset of dust condensation in the ejecta. From a wealth of fine-structure lines we provide abundance estimates for stable Ni, Ar, and Ne which, via spectral synthesis, may be used to constrain nucleosynthesis models.
Subject headings:
supernovae: general — supernovae: individual(SN 2005af (catalog ), SN 1987A (catalog ), SN 2004dj (catalog ))1. Introduction
Mid-infrared (mid-IR) studies of supernovae (SNe) have been hampered by a combination of several factors: their intrinsic faintness at epochs of interest, the high background at mid-IR wavelengths, and strong terrestrial atmospheric absorption. With the sole exception of the extremely nearby (50 kpc) SN 1987A (Roche et al., 1993; Wooden et al., 1993), this wavelength region has remained out of reach for SN studies. Yet, access to the mid-IR region is important for at least two reasons. First, a large number of fine-structure lines that are sensitive to the details of the explosion physics lie in the 5–40 m region. These provide robust measurements of element abundances permitting direct comparisons with explosion models. Second, core-collapse SNe (CCSNe) have been proposed to be major sources of dust at high redshifts (e.g., Todini & Ferrara, 2001), but even in the local Universe, this hypothesis rests on little direct observational evidence. By monitoring the mid-IR evolution, where warm dust emits most strongly, we have a powerful means by which we can ascertain the epoch of dust condensation, and estimate the amount of fresh dust produced in the ejecta. Alternatively, via mid-IR measurements, we can study the development of an IR echo arising in the pre-existing dusty circumstellar medium, thereby constraining the pre-supernova evolution of the progenitor (e.g., Meikle et al., 2006).
The improvements in terms of sensitivity and spatial resolution afforded by the Spitzer Space Telescope (Spitzer) finally allow us to probe SN behaviour using mid-IR diagnostics. To this end, we are pursuing a multi-epoch spectroscopic and photometric campaign of a significant sample of SNe of all types, within the framework of the Mid-IR Supernova Consortium (MISC). Fortuitously, since the launch of Spitzer, at least half a dozen CCSNe have exploded within 10 Mpc. Recently, we presented a first mid-IR study of the nearest (3.13 Mpc) of these, SN 2004dj (Kotak et al., 2005). Here, we describe results for the Type IIP SN 2005af that highlight the diversity of this subgroup.
SN 2005af was discovered in the nearby edge-on spiral galaxy, NGC 4945, on 2005 Feb. 8.22 (UT) at V by Jacques & Pimentel (2005). On the basis of a spectrum obtained four days later, Filippenko & Foley (2005) classified it as a Type IIP (plateau) supernova, at an epoch of about one month post-explosion. In what follows, we assume that the supernova exploded on 2005 Jan. 9, but note that the explosion epoch is probably uncertain by up to a few weeks. NGC 4945 is associated with the Centaurus group of galaxies, and estimates of its distance have ranged from 3.9 (de Vaucouleurs et al., 1981) to 8.1 Mpc (Baan, 1985). In recent years, these values have tended to converge near the lower end of this range. Following the reasoning in Bergman et al. (1992, and references therein), we adopt a distance of 3.9 Mpc.
2. Observations
We first observed SN 2005af with Spitzer during Cycle 1 using the Infrared Spectrograph (IRS) and IRS Peak-up Imaging (PUI) under Director’s Discretionary Time Program 237. We subsequently observed it during Cycle 2 as part of our GO Program 20256, using the Infrared Array Camera (IRAC), IRS, and IRS-PUI.
2.1. Photometry
3.6–8.0 m imaging with IRAC was obtained on 2005 Jul. 22 (194 d) and 2006 Feb. 12 (399 d). A frame time of 30 s and 5 (medium-sized) dither positions in mapping mode for each pair of channels were used. Our measurements from aperture photometry, carried out on the post-Basic Calibrated Data, vS14.0.0 image mosaics using GAIA, are shown in Table LABEL:tab:phot. At 67 d, SN 2005af is very bright in all four IRAC channels, The flux is particularly bright in channel 2 (4.5 m). Nevertheless, examination of individual BCD frames showed that saturation had not occurred i.e. the measurements are robust.
Our first epoch of PUI-16 m imaging was obtained in Peak-Up mode only, i.e., before dithering capabilities were offered with IRS. The two subsequent epochs of PUI observations were carried out using 31.46 s ramps and 20 small-scale dither positions. The SN was clearly detected at all three epochs (Table LABEL:tab:phot).
2.2. Spectroscopy
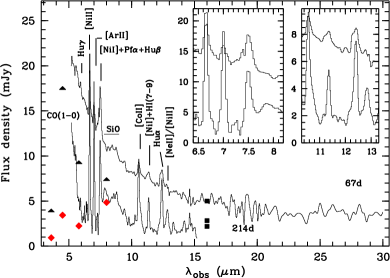
Spectra were obtained on 2005 Mar. 17 (67 d) and 2005 Aug. 11 (214 d) with the Short-Low (SL, m; R = 64-128) module of the IRS in staring mode. A Long-Low (LL, m; R = 64-128) spectrum was also acquired at 67 d. For the SL mode, the total time-on-source at the two epochs was 1219 s and 1828.5 s respectively, and 629 s for the LL mode.
The first and second epoch data were preprocessed using versions S12.3.0 and S12.4.0, respectively, of the Spitzer data processing pipeline. We began the reduction of the BCD data by differencing the two nod positions to remove the background emission. All subsequent steps, i.e., straightening, extraction, wavelength and flux calibration were carried out using SPICE v1.1-beta15 with standard settings The spectra are shown in Fig. 1. We also extracted the spectra using post-BCD S13.2.0 products and found that they were virtually identical.
3. Analysis
The high IRAC flux at 4.5 m for the first epoch compared to other channels is almost certainly due to CO fundamental band emission. This is corroborated by the steep rise towards 5 m in both spectra, which we identify with the red wing of the CO fundamental (see Fig. 1). Between 194 d and 399 d, the sharpest decline in IRAC flux is seen at 4.5 m. These observations suggest that CO formed in the ejecta less than 2 months after explosion, persisting to at least 7 months, but had faded substantially by about 1 year. The relative increase in the IRAC channel 4 (8 m) flux by 399 d is probably due to the emergence of spectral features in the 6.43–9.40 m region spanned by this channel. This is discussed below.
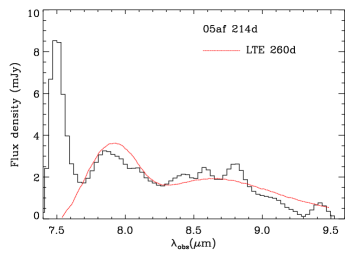
By day 214, a pedestal-like feature appears spanning 7.6-9 m, which we identify with molecular emission due to the SiO fundamental band (Figs. 1, 3). This is the first time that SiO has been detected in the ejecta of a SN IIP – the most common subtype of all CCSNe at low redshifts. The only other detection of SiO in SN ejecta was in the peculiar Type II SN 1987A (Roche et al., 1991; Wooden et al., 1993). That molecules are detected at all, provides a diagnostic of the prevalent conditions in the ejecta. As both CO and SiO are powerful coolants, they are regarded as precursors to dust condensation in the ejecta (e.g. Nozawa et al., 2003).
In Fig. 2 we compare an LTE model SiO spectrum for SN 1987A at 260 days (Liu & Dalgarno, 1994) with the day 214 SL spectrum of SN 2005af. The model, attenuated by a factor of 2.5, produces a convincing reproduction of the observed behaviour. Scaling from the model, the match to our spectrum suggests a SiO mass of 2 M⊙. Liu & Dalgarno (1994, 1996) argue that such a mass can only form if there is no mixing of helium into the oxygen-silicon region of the ejecta.
Apart from molecular emission, several conspicuous lines are visible in both spectra (Fig. 1) which were identified by analogy with SN 1987A (Wooden et al., 1993). At both epochs, the spectrum is dominated by forbidden lines of Ni, Co, and Ar, of which the [NiII] 6.64 m, [ArII] 6.99 m, and [CoII] 10.52 m are the most prominent.
Between 67 d and 214 d the lines show appreciable increases in intensity (see Table 2, Fig. 1), In addition, in spite of the low spectral resolution (R=64-128), we observe in a number of lines (e.g., [NiII] 6.64 m, [CoII] 10.52 m) an extended red wing at 67 d which fades by 214 d. The broad blend with an extended red wing near 11.3 m at 67 d is probably due to a combination of [NiI] and HI (7-9), but by 214 d, it is symmetric. Extended red wings were also detected in several lines in SN 1987A (e.g., Witterborn et al., 1989) accompanied by small redshifts of the line centroid. A plausible explanation is provided by electron scattering in the expanding hydrogen envelope (Fransson & Chevalier, 1989). This may also apply to SN 2005af, although we do not detect any obvious redshifting of line centroids.
We now estimate the abundances from the stronger lines at the later epoch when the ejecta has a lower optical depth. Following McCray (1990), we estimate the electron density of the ejecta as cm cm-3 at day 214. We derived critical densities for Ni+ and Ar+ using collision strengths from Bautista & Pradhan (1996) and Osterbrock & Ferland (2006), respectively, and found these to be 1-3 orders of magnitude smaller than . On this basis, we deem an LTE treatment to be valid. Using the line intensities in Table 2, we derive masses using the upper excited state populations of the ions and find 3.7, 1, and 2.2 for stable (Ni0,Ni+), Ar+, and Ne+ respectively, for an electron temperature of 4000 K. Note that the result is insensitive to temperature: a 1000 K change in temperature, changes the mass estimates by 15%. The partition functions are from Halenka et al. (2001) for Ni, and Irwin (1981) for Ar and Ne. Assuming a uniform distribution of stable Ni, we find that the Sobolev optical depths of all detected Ni lines are less than 0.06. Strong transitions of [NiIII] 11.002 m and [NiIV] 8.405 m lie within the wavelength region covered, but these lines are not detected at either epoch. We conclude that the Ni is predominantly in the neutral and singly-ionised state. Thus, assuming insignificant clumping, the value we derive above is probably close to the total stable Ni mass.
The predicted mass of stable Ni is sensitive to the progenitor mass, although this relation is not monotonic, and depends sensitively on the explosion mechanism, multi-dimensional effects and, in spherical models, on the mass cut, which is a free parameter. Thielemann et al. (1996) predict stable Ni masses in the range 0.01–0.014 for progenitors in the range 13-20, and a much lower value of 0.002 for a 25 star. Other authors (e.g. Chieffi & Limongi, 2004; Woosley & Weaver, 1995; Nomoto et al., 2006) derive comparable values, though detailed intercomparisons are difficult due to different parametrizations of physical processes.
Chieffi & Limongi (2004) provide explosive yields as a function of metallicity based on parameters which have been calibrated to fit observed properties of massive stars. The value for the stable Ni mass that we derive is closest to their progenitor models of 13-15 with metallicities of a third to a twentieth of the solar value. Although we can definitively rule out higher mass progenitors at even lower metallicities, we current cannot exclude a 35 progenitor at solar metallicity. Further, planned, late-time spectroscopy should provide tighter constraints.
Given the high energy required to ionise neutral Ne (21.6eV) and Ar (15.8eV) we conclude that, given the low ionisation conditions indicated by Ni, the bulk of the Ne and Ar lies in the neutral state. However, no strong transitions of [NeI] or [ArI] lie in our wavelength range. Consequently, the masses derived here for the first ionisation state represent lower limits only.
For SN 1987A at 260 days, using the [CoII] 10.52 m line, Roche et al. (1993) derive a value for of . Using our day 214 intensity for this line in SN 2005af we obtain = . Allowing for the different epochs for the two SNe, this implies that a 56Ni mass of 0.027 was ejected by SN 2005af. This estimate falls in the expected range for normal Type II SNe (e.g., Hamuy, 2003).
Although we have a clear detection of the SN 2005af spectrum between 16-30 m (Fig. 1) – the first, for any SN at this early epoch – we do not see any significant spectral features. This is not surprising, given its youth. In SN 1987A, lines of [FeII] in this spectral region were only detected after 400 d (Haas, 1990).
3.1. Comparison with other Type II SNe
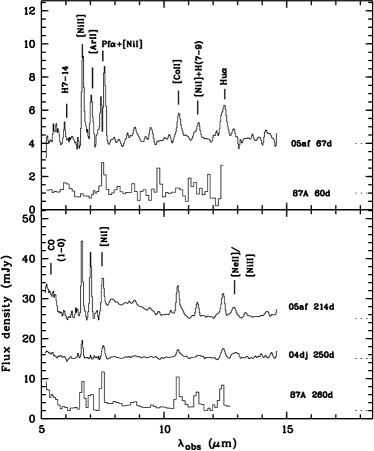
In Fig. 3 we compare roughly coeval mid-IR spectra of SN 2005af with that of SN 1987A (IIpec) at 60 d, and with those of SN 1987A and SN 2004dj (IIP) at 250 d. The 60 d mid-IR spectrum of SN 1987A is dominated by HI lines (see Fig. 3 or Roche et al., 1993; Wooden et al., 1993). In contrast, strong lines of [NiII] and [ArII] are present in SN 2005af. This suggests either that our first-epoch SN 2005af observations were taken on the radioactive tail of the lightcurve and that the length of the plateau phase must have been 60 d, or that the estimated explosion date, based on the classification spectrum is too late by 1 month.
At the later epoch all three SNe exhibit prominent lines of nickel and cobalt. Wooden et al. (1993) emphasize that the ratio of [NiI] 7.5 m to [NiII] 6.64 m lines provides a sensitive measure of the ionization fraction of Ni (). Using their Fig. 9, and assuming LTE, we find and 0.85 for SN 2004dj, SN 2005af, and SN 1987A, respectively, at 250 d.
SN 2005af shows much stronger [ArII] than SN 1987A. Moreover, SN 2004dj is found to be a factor of 20 weaker than SN 2005af in this line. Even if we normalise to the strengths of the adjacent [NiII]6.63 m, [NiI]7.50 m lines, the [ArII] line is still over 5 stronger in SN 2005af. This is intriguing given that SNe 2004dj and 2005af are both of Type IIP. One possibility, indirectly implied by above, is that the conditions required to ionize Ar are not attained in SN 2004dj, while Ni+, with its lower ionization potential (7.6eV), is easier to produce.
Another hint may come from the spherically symmetric Thielemann et al. (1996) models, where the bulk of the stable Ar (mostly 36Ar) is formed in a shell just above the stable Ni region. Thus, one might expect that a higher mass cut (below which the core collapses to a neutron star or black hole) within the Ni zone would produce a lower absolute Ni mass, but a higher Ar/Ni mass ratio. However, this seems to be contrary to what we observe, i.e., SN 2004dj has an apparently smaller Ni mass but an even smaller Ar/Ni mass ratio than SN 2005af. We suspect that to account for this behaviour, a certain degree of asymmetry or clumpiness, as well as mixing in the ejecta has to be invoked. Interestingly, Pereyra et al. (2006) infer an overall asphericity of 20% for SN 2005af from optical polarimetry.
References
- Baan (1985) Baan, W.A., 1985, Nature, 315, 26
- Bautista & Pradhan (1996) Bautista, M.A. & Pradhan, A. K., 1996, A&AS, 115, 551
- Bergman et al. (1992) Bergman, P., et al., 1992, A&A, 265, 403
- Chieffi & Limongi (2004) Chieffi, A., & Limongi, M., ApJ, 2004, 608, 405
- de Vaucouleurs et al. (1981) de Vaucouleurs, G., et al., 1981, ApJ248, 408
- Fransson & Chevalier (1989) Fransson, C. & Chevalier, R. A., 1989, ApJ 343, 323
- Filippenko & Foley (2005) Filippenko, A.V., & Foley, R.J., IAU Circ. 8484
- Halenka et al. (2001) Halenka, J., Madej, J., et al., 2001, Acta Astr., 51, 347
- Hamuy (2003) Hamuy, M., 2003, ApJ, 582, 905
- Haas (1990) Haas, M.R., et al., 1990, ApJ 360, 257
- Irwin (1981) Irwin, A.W., 1981, ApJS, 45, 621
- Jacques & Pimentel (2005) Jacques, C. & Pimentel, E., 2005, IAU Circ. 8482
- Liu & Dalgarno (1994) Liu, W., & Dalgarno, A., 1994, ApJ 428, L769
- Liu & Dalgarno (1996) Liu, W., & Dalgarno, A., 1996, ApJ 471, L480
- Kotak et al. (2005) Kotak, R., et al., 2005, ApJ, 628, L123
- Meikle et al. (2006) Meikle, W.P.S. et al., 2006, ApJ (accepted) astro-ph/0605584
- McCray (1990) McCray, R., 1990, Molecular Astrophysics, Cambridge Uni. Press
- Nomoto et al. (2006) Nomoto, K. et al., 2006, astro-ph/0605725
- Nozawa et al. (2003) Nozawa, T. et al., 2003, ApJ, 598, 785
- Osterbrock & Ferland (2006) Osterbrock, D.E., & Ferland, G., 2006, Astrophysics of Gaseous Nebulae and Active Galactic Nuclei, (University Science Books)
- Pereyra et al. (2006) Pereyra, A. et al., 2006, A&A, 454, 827
- Roche et al. (1991) Roche, P., Aitken, D., & Smith, C., 1991, MNRAS, 252, 39P
- Roche et al. (1993) Roche, P., Aitken, D., & Smith, C., 1993, MNRAS, 261, 522
- Thielemann et al. (1996) Thielemann, F.-K., et al. 1996 ApJ, 460, 408
- Todini & Ferrara (2001) Todini, P., & Ferrara, A., 2001, MNRAS, 325, 726
- Witterborn et al. (1989) Witteborn, F.C. et al., 1989, ApJ 338, L9
- Wooden et al. (1993) Wooden, D. et al., 1993, ApJ 88, 477
- Woosley & Weaver (1995) Woosley, S.E. & Weaver, T.A., 1995, ApJS101, 181
| Flux (mJy) | |||||||
| Epoch | texp | IRAC | PUI | ||||
| Date | (d) | (s) | 3.6 m | 4.5m | 5.8 m | 8.0 m | 16 m |
| 2005 Mar. 17 | 67 | 1219 | 5.00.3 | ||||
| 2005 Jul. 22 | 194 | 524 | 3.960.02 | 17.540.04 | 9.310.05 | 7.430.06 | [3.10] |
| 2005 Aug. 08 | 211 | 629 | 2.830.03 | ||||
| 2006 Feb. 12 | 399 | 524 | 0.930.02 | 3.430.02 | 2.240.02 | 4.840.07 | [2.63] |
| 2006 Mar. 18 | 433 | 629 | 2.190.03 | ||||
| 67 d | 214 d | ||||||
|---|---|---|---|---|---|---|---|
| Ion | Inst.Res. | I | FWHM | I | FWHM | ||
| (m) | () | () | () | ||||
| 6.636 | [NiII] | 2700 | 3.18 | 4000 | 9.42 | 3600 | |
| 6.985 | [ArII] | 2600 | 1.61 | 3800 | 6.16 | 3000 | |
| 7.507 | [NiI] | 2400 | 4.48 | 4000 | |||
| 10.521† | [CoII] | 3400 | 0.78 | 4500 | 1.99 | 3000 | |
| 11.308‡ | [NiI] | 3200 | 0.25 | 2400 | 0.78 | 2900 | |
| 12.813⋆ | [NeII] | 2800 | 0.56 | 3300 | |||