∎
Tel.: +49-331-7499232
Fax: +49-331-7499429
22email: ASchwope at aip.de 33institutetext: F. Haberl & V. Hambaryan 44institutetext: Max-Plank Institute für Extraterrestrische Physik, Giessenbachstr., 85748 Garching, Germany 55institutetext: Christian Motch 66institutetext: Observatoire Astronomique, CNRS UMR 7550, 11 rue de l’Université, 67000 Strasbourg, France
The complex X-ray spectrum of the isolated neutron star RBS1223††thanks: This work was supported in part by the German DLR under grant 50 OR 0404. Based on observations obtained with XMM-Newton, an ESA science mission, with instruments and contributions directly funded by ESA Member States and NASA
Abstract
We present a first analysis of a deep X-ray spectrum of the isolated neutron star RBS1223 obtained with XMM-Newton. Spectral data from four new monitoring observations in 2005/2006 were combined with archival observations obtained in 2003 and 2004 to form a spin-phase averaged spectrum containing 290000 EPIC-pn photons. This spectrum shows higher complexity than its predecessors, and can be parameterised with two Gaussian absorption lines superimposed on a blackbody. The line centers, , could be regarded as supporting the cyclotron interpretation of the absorption features in a field G. The flux ratio of those lines does not support this interpretation. Hence, either feature might be of truly atomic origin.
Keywords:
Stars: individual (RBS1223) stars: neutron stars: magnetic fields X-rays: individuals (RBS1223)pacs:
97.60.Jd 97.10.Ld1 Introduction
RBS1223 is one out of three XDINs (X-ray dim isolated neutron stars) found in the ROSAT Bright Survey (RBS), an optical identification program of the more than 2000 X-ray sources detected in the RASS with a count rate s-1 at high galactic latitude r1 . The initial discovery r2 was based on the soft X-ray spectrum and the steep SED, . Follow-up Chandra observations revealed a periodically modulated signal r3 , and HST-observations uncovered a candidate optical counterpart at mag r4 . Initial observations with XMM-Newton showed deviations from a Planckian energy distribution at energies below 500 eV which could be described with a Gaussian absorption line and interpreted as a cyclotron absorption line in a field of G fwh03 . The large number of photons collected with XMM-Newton also uncovered the true spin period of 10.31 s. In asea05 the light curves in different energy bands were modeled in terms of a photospheric cap model. The temperature structure was found to be roughly compatible with the crustal field models of urm04 . The implied field structure deviates from a simple centered dipole model. Spin-period changes appeared likely at that time thus stimulating monitoring observations with Chandra and XMM-Newton. The spin history could be unequivocally fixed by a series of Chandra pointings kap05 and revealed a spin-down of the star at a rate s s-1. Under the assumption that this is due to magnetic dipole torques, a characteristic age of 1.5 Myr and a magnetic field strength of G were inferred. Here we describe initial results of recent monitoring observations with XMM-Newton which, due to the large number of accumulated photons, besides accurate timing also allows spectroscopy with unprecedented accuracy.
| Rev. | AO | Day | Exp. | Mode | Countrate |
|---|---|---|---|---|---|
| [ks] | [s-1] | ||||
| 377 | 1 | 2001 Dec 31 | 18.6 | SW | 2.49a |
| 561 | 2 | 2003 Jan 1 | 27.0 | FF | 2.53 |
| 743 | 3 | 2003 Dec 30 | 30.2 | FF | 2.57 |
| 1015 | 4 | 2005 Jun 25 | 14.9 | FF | 2.56 |
| 1016 | 4 | 2005 Jun 26 | 12.9 | FF | 2.57 |
| 1025 | 4 | 2005 Jul 15 | 12.9 | FF | 2.56 |
| 1115 | 4 | 2006 Jan 10 | 14.9 | FF | 2.56 |
– Exposure time is given for EPIC-pn.
– Mean countrates are given for the whole XMM-Newton energy range (0.15 –
10 keV)
– a countrate from fwh03
2 XMM-Newton observations of RBS1223
XMM-Newton observed RBS1223 several times between 2001 and 2006. The relevant pointings for this contribution are listed in Tab. 1. All but the first, which was put in small window mode (SW), were obtained in full frame mode through the thin filter. All observations were reduced in a homogeneous manner with a recent version of the SAS (V6.5). The monitoring observations set constraints on the evolution of different parameters of the star. The overall brightness did not change between 2001 and 2006 and at all occasions the star displayed its double-humped light curves discussed in detail by asea05 . Also the amplitude of the light curve remained unchanged. Hence, the only property which was shown to evolve so far is the spin period kap05 .
| # | red. | #d.o.f | ||||||||
|---|---|---|---|---|---|---|---|---|---|---|
| cm -2 | eV | keV | keV | keV cm-2 s-1 | keV | keV | keV cm-2 s-1 | |||
| 1 | 3.3 | 100 | — | — | — | — | — | — | 3.96 | 1250 |
| 2 | 3.7 | 93 | 0.39 | 0.06 | — | — | — | 2.05 | 1247 | |
| 3 | 1.8 | 102 | 0.23 | 0.15 | 0.46 | 0.26 | 1.11 | 1244 | ||
| 4 | 2.0 | 104 | 0.28 | 0.13 | 0.24 | 1.12 | 1245 | |||
| 5 | 1.2 | 100 | 0.20 | 0.17 | 0.73 | 1.11 | 1245 | |||
| 6 | 1.8 | 102 | 0.28 | 0.15 | 0.26 | 1.11 | 1245 |
3 Spectral analysis of RBS1223
The constancy of the star allows a joint spectral analysis of all available observations. In order to minimise possible remaining calibration uncertainties for different camera modes we used only those observations with identical camera settings (six observations between revolutions 561 – 1115). This selection left us with an effective exposure time of 113 ks with almost 290000 photons for spectral analysis. Here we concentrate on the mean spectrum of all observations. Phase-resolved spectroscopy is underway and will be presented elsewhere.
An initial attempt to analyse the spectrum was made with a spectrum extracted from a merged photon event table of the six observations and with common response and effective area files. Such an approach does not take into account possible time-dependencies of the detector files. We therefore extracted a spectrum and computed the response matrix and effective area file for each observation separately. Spectral modeling was performed with XSPEC V12 following two different approaches. Firstly, the spectral parameters were determined for each spectrum individually but forcing the column density of cold interstellar absorbing matter, , to be the same for all the observations (six data groups). This experiment revealed the spectral parameters of all observations to be the same within the errors. We then followed the second approach fitting all six spectra jointly with one common model which reveals one set of spectral parameters instead of six. The results of those latter experiments are listed in Tab. 2.
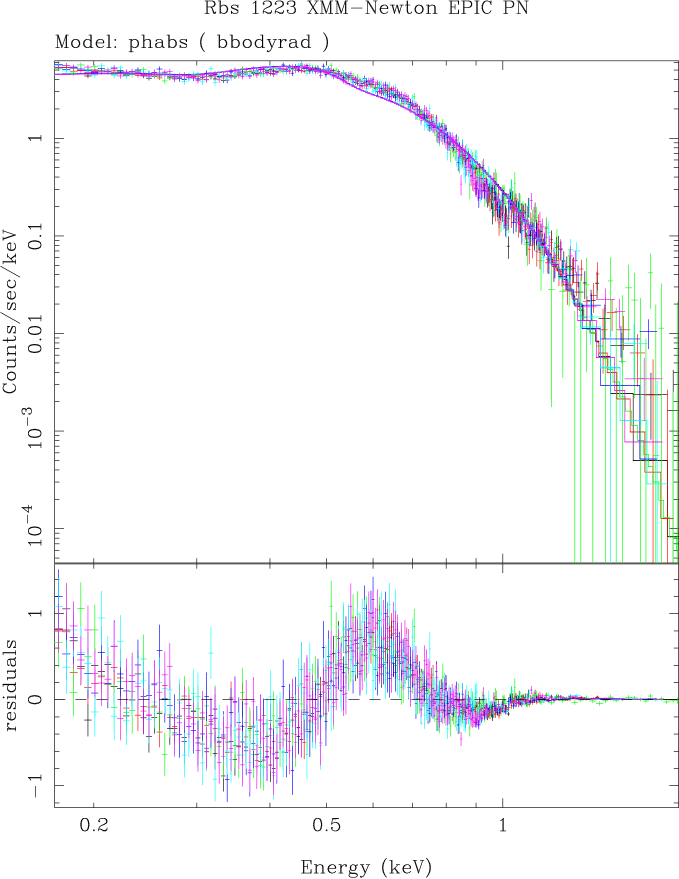
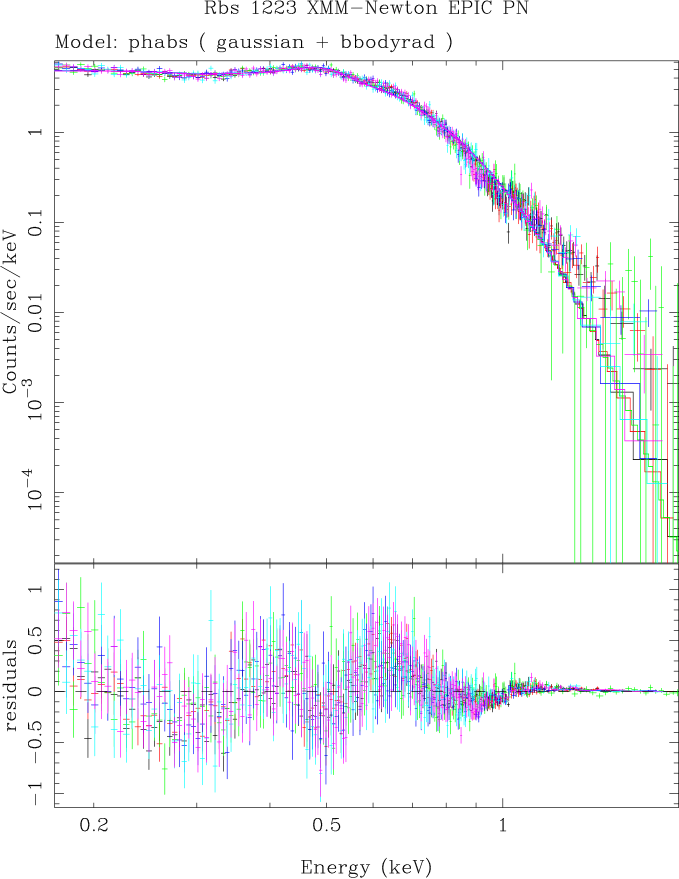
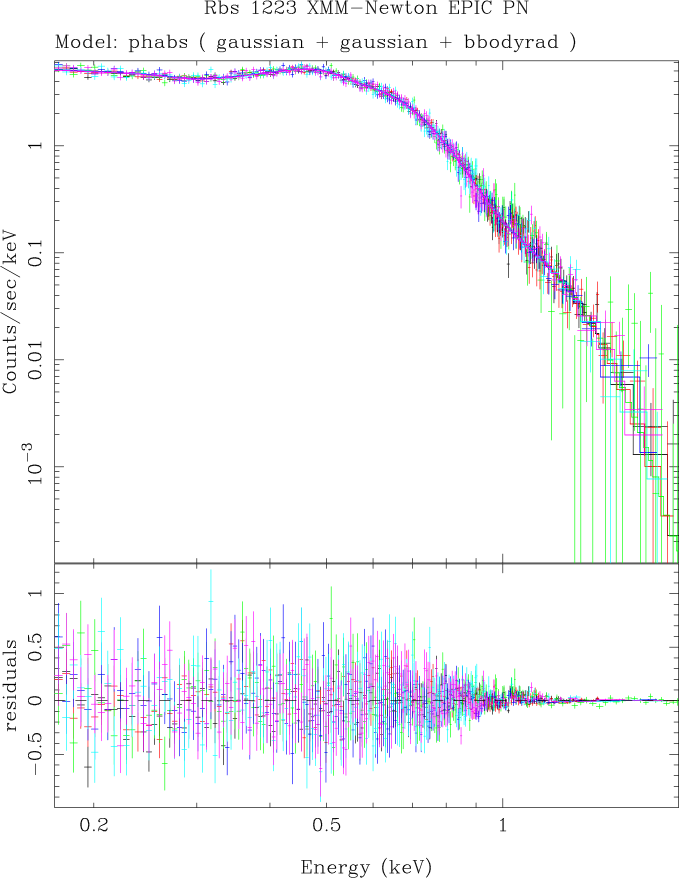
Spectral models were chosen with increasing complexity until a satisfactory fit was achieved. The fit assuming only a blackbody emission spectrum absorbed by neutral interstellar matter which gives (for 1247 d.o.f.) can be ruled out completely (model 1 in Tab. 2, Fig. 1a). This mismatch was found already by fwh03 when fitting data from revolutions 377 & 561. They successfully applied a model with a Gaussian absorption line superposed on the absorbed blackbody. With such a model the current fit is improved but it does no longer adequately represent the shape of the combined spectrum (model 2 in Tab. 2, Fig. 1b). Compared to fwh03 the fit with the single Gaussian gives a higher line energy, eV vs. 300 eV, and smaller line width, eV vs. 100 eV. Part of this change is due to the improved signal/noise of the spectrum which allows a free fit of instead of fixing it at 100 eV as in fwh03 . The updated calibration of the detector might also helpful. After inclusion of a second Gaussian a successful fit showing no systematic residuals was achieved ( for 1244 degrees of freedom, model 3, Fig. 1c).
Since the second Gaussian could be the higher harmonic of a fundamental at lower energies (fwh03 proposed an interpretation as proton cyclotron line in a field of G) we made some attempts to fit the two Gaussians with related parameters. In our model 3, both Gaussians were fitted independently, they were centered at line energies . Hence, if the parameters are forced to obey this relation, the achieved fit becomes equally good and the other parameters are found almost unchanged (model 4). The picture changes slightly if the width of the two lines is pre-set to the same, adjustable value (model 5). This broadens the width of the principal first line slightly from 0.15 keV to 0.17 keV and shifts the line energy of the second Gaussian from 0.46 keV to 0.73 keV at the same quality of the fit (). Nevertheless the flux in the second Gaussian is reduced by 50% in this fit. The last model listed in Tab. 2 (number 6) uses a different relation between the line energies, , and was similarly successful with almost unchanged parameters compared to the free fit.
For models 1 and 2 no formal parameter errors were determined because those models did not adequately describe the spectrum. The formal errors of the parameters of fit 3 are: cm-2, eV, keV, keV, keV cm-2 s-1, keV, keV, and keV cm-2 s-1. The above experiments have shown cross-talk between the parameters, hence the true uncertainties are larger than the mentioned statistical ones. For example, models 3 – 6 are indistinguishable on statistical grounds but some of their parameters are rather different. The main problem consists in a proper location of the continuum. The primary Gaussian is so broad, that the low-energy end of the spectrum is still affected by this feature. This allows the flux in this features to be traded against the amount of interstellar absorption and the temperature of the blackbody. At the high-energy end of the spectrum photons are detected up to 2 keV which in principle gives a better leverage for constraining the blackbody temperature. Our fitted model assumes that these photons belong to the Wien tail of the blackbody. Consequently, the newly determined blackbody temperature is higher than found before from a spectrum which missed those high-energy photons and was affected by the structure which is now described by a second Gaussian in its presumed Wien-tail.
4 Results and discussion
The joint analysis of six observations of RBS1223 with XMM-Newton has led to a slight revision of the spectral parameters. The spectrum can be described with a blackbody and two Gaussian absorption lines superimposed. The blackbody temperature is significantly higher than previously found thanks to the detection of X-ray photons up to 2 keV. Also the parameters of the primary Gaussian absorption line are changed: it appears significantly narrower and more blueshifted than before. Whether we have seen the true continuum at any energy remains an open question.
Similarly unclear is the nature of the features which were parameterised with two Gaussian absorption lines. They have a flux ratio of about 5:1, their equivalent widths of EW eV (for keV) and EW eV (for keV) are rather large. Their relative line energy and the rather large width of the lines are supportive of the proton cyclotron interpretation in a field of few times G (the line center of the primary and hence the derived magnetic field strength is not well contrained, in model 5 the best fit is achieved for keV, i.e. it converges to the lower bound of the pre-set parameter range), consistent with the observed spin down rate of the star. The rather high flux ratio of the two lines, nevertheless, makes an interpretation of the two lines as being harmonics of each other unlikely, since the oscillator strength of the first harmonic is smaller than that of the fundamental by a factor , which becomes very small for proton masses pav80 . An alternative could be to associate the two lines with different fields from e.g. the two polar caps. Since the field was shown to be somehow non-dipolar or off-centered at least asea05 , different field strength could be encountered at the two caps. It is difficult to test this hypothesis on the basis of the current data and it needs to be seen if the results of the phase-resolved spectroscopy reveal any helpful indication in this respect. However, if the two lines would be the fundamentals of two different cyclotron systems from two different regions, the infered field strengths would be G and G according to and assumed (see asea05 ), keV and keV. Hence, one field would be slightly below and one above the critical quantum field, where vacuum polarization becomes important in shaping the lines (see laiho03 laiho04 , and the discussion in vkea04 ). Since the second Gaussian line (higher field) is rather broader than the primary Gaussian, this scenario seems to be unlikely.
A possibility which needs to be explored in detail is a blend of magnetically shifted atomic transitions with proton cyclotron resonances. As the model computations of laiho04 indicate, the amount of ionisation in the assumed hydrogen atmosphere will play a crucial role. An as accurate as possible temperature determination is thus very important for further progress. Due to its photometric stability on the one hand and the pronounced spin variability on the other hand, RBS1223 is a very promising target to gain further insight from even deeper X-ray spectroscopy.
References
- (1) Schwope, A.D., Hasinger, G., Lehmann, I., et al.: The ROSAT Bright Survey: II. Catalogue of all high-galactic latitude RASS sources with PSPC countrate CR s-1. AN 321, 1–52 (2000)
- (2) Schwope, A.D., Hasinger, G., Schwarz, R., Haberl, F.W., Schmidt, M.: The isolated neutron star candidate RBS1223 (1RXS J130848.6+212708). A&A 341, L51 (1999)
- (3) Hambaryan, V., Hasinger, G., Schwope, A.D., Schulz, N.S.: Discovery of 5.16 S pulsations from the isolated neutron star RBS 1223. A&A 381, 98 (2002)
- (4) Kaplan, D.L., Kulkarni, S.R., van Kerkwijk, M.H.: A Probable Optical Counterpart to the Isolated Neutron Star RX J1308.6+2127. ApJ 579, L29 (2002)
- (5) Haberl, F., Schwope, A.D., Hambaryan, V., Hasinger, G., Motch, C.: A broad absorption feature in the X-ray spectrum of the isolated neutron star RBS1223 (1RXS J130848.6+212708). A&A 403, L19 (2003)
- (6) Geppert, U.R.M.E., Küker, M., Page, D.: Temperature distribution in magnetized neutron star crusts. A&A 426, 267 (2004)
- (7) Schwope, A.D., Hambaryan, V., Haberl, F., Motch, C.: The pulsed X-ray light curves of the isolated neutron star RBS1223. A&A 441, 597 (2005)
- (8) Kaplan, D. L., van Kerkwijk, M. H.: A Coherent Timing Solution for the Nearby Isolated Neutron Star RX J1308.6+2127/RBS 1223. ApJ 635, L65 (2005)
- (9) Pavlov, G. G., Shibanov, Iu. A., Iakovlev, D. G.: Quantum effects in cyclotron plasma absorption. Astr. Sp. Sci., 73, 33 (1980)
- (10) van Kerkwijk, M. H., Kaplan, D. L., Durant, M., Kulkarni, S. R., Paerels, F.: A strong, broad absorption feature in the X-ray spectrum of the nearby neutron star RX J1605.3+3249. ApJ 608, 432 (2004)
- (11) Lai, D., Ho, W. C. G.: Transfer of polarized radiation in strongly magnetized plasmas and thermal emission from magnetars: effect of vacuum polarization. ApJ 588, 962 (2003)
- (12) Lai, D., Ho, W. C. G.: Spectral features in the thermal emission from isolated neutron stars: dependence on magnetic field strengths. ApJ 607, 420 (2004)