Complexity on Small Scales II:
Metallicities and Ages in the Leo II
Dwarf Spheroidal Galaxy
Abstract
We present metallicities and ages for 52 red giants in the remote Galactic dwarf spheroidal (dSph) galaxy Leo II. These stars cover the entire surface area of Leo II and are radial velocity members. We obtained medium-resolution multi-fiber spectroscopy with the FLAMES multi-object spectrograph as part of a Large Programme with the Very Large Telescope at the European Southern Observatory, Chile. The metallicities were determined based on the well-established near-infrared Ca II triplet technique. This allowed us to achieve a mean random error of 0.16 dex on the metallicities, while other systematic effects, such as unknown variations in the dSph’s [Ca/Fe]-ratio, may introduce a further source of uncertainty of the order of 0.1 dex. The resulting metallicity distribution is asymmetric and peaks at [Fe/H] dex on the Carretta & Gratton scale. The full range in metallicities extends from to dex. As in other dSph galaxies, no extremely metal-poor red giants were found. We compare Leo II’s observed metallicity distribution with model predictions for several other Galactic dSphs from the literature. Leo II clearly exhibits a lack of more metal poor stars, in analogy to the classical G-dwarf problem, which may indicate a comparable “K-giant problem”. Moreover, its evolution appears to have been affected by galactic winds. We use our inferred metallicities as an input parameter for isochrone fits to Sloan Digital Sky Survey photometry of our target stars and derive approximate ages. The resulting age-metallicity distribution covers the full age range from 2 to about 15 Gyr on our adopted isochrone scale. During the first Gyr relative to the oldest stars the metallicity of Leo II appears to have remained almost constant, centering on the mean metallicity of this galaxy. The almost constant metallicity at higher ages and a slight drop by about 0.3 dex thereafter may be indicative of rejuvenation by low metallicity gas. Overall, the age-metallicity relation appears to support the formation of Leo II from pre-enriched gas. Evidence for enrichment is seen during the recent 2 to 4 Gyr. Our findings support earlier derived photometric findings of Leo II as a galaxy with a prominent old population and dominant intermediate-age populations. We do not see a significant indication of a radial metallicity gradient nor age gradient in our current data.
1 Introduction
The majority of the galaxies in the Local Group are dwarf spheroidal (dSph) galaxies, the least massive, least luminous type of galaxies known. They are mainly found within less than 300 kpc of massive galaxies like the Milky Way or M31 (see, e.g., Grebel, Gallagher, & Harbeck 2003; van den Bergh 1999a). The origin and nature of these seemingly dark-matter-dominated dwarf galaxies is still poorly understood and is the subject of intense research. DSphs are possibly the most dark-matter-dominated objects in the Universe and may share a common halo mass scale of M⊙ (e.g., Gallagher & Wyse 1994; Mateo et al. 1998; Odenkirchen et al. 2001; Kleyna et al. 2001; Klessen, Grebel, & Harbeck 2003; Wilkinson et al. 2004, 2006a). This makes it particularly interesting to understand their evolutionary histories.
The dSph census in the Local Group remains incomplete owing to the intrinsically low surface brightnesses of these gas-deficient galaxies. The last three years alone saw the discovery of 13 new Local Group dSph candidates (Zucker et al. 2004, Zucker et al. 2006a, 2006b, 2006c; Willman et al. 2005; Belokurov et al. 2006a, 2006b, Martin et al. 2006), seven of which are new Milky Way companions. This increases the number of known Galactic dSph satellites to 15, omitting accreted companions and additional objects whose nature remains yet to be confirmed (Grebel, Gallagher, & Harbeck 2006). More than 75% of all Milky Way companions are found within 150 kpc; only three additional dSphs believed to be Galactic satellites are found at larger distances. Leo II, the dSph studied in the current paper, is one of the latter.
Leo II was discovered by Harrington & Wilson (1950). A number of mainly photometric studies were conducted in the subsequent decades. Earlier studies based on resolved color-magnitude diagrams (CMDs) placed Leo II at a distance of kpc (e.g., Demers & Harris 1983; Bellazzini, Gennari, & Ferraro 2005), kpc (Demers & Irwin 1993; Lee 1995), and kpc (Mighell & Rich 1996). These studies used different values for the (low) amount of Galactic foreground reddening, different mean metallicities, and different methods to derive the distance of Leo II, e.g., the apparent luminosity of the horizontal branch or of the tip of the red giant branch (TRGB). In the current study, we adopt the TRGB distance of kpc obtained by Bellazzini et al. (2005), which excludes the contribution of luminous asymptotic giant branch (AGB) stars and also shows consistency with the horizontal branch (HB) locus. If this distance is representative of Leo II’s distance from the Milky Way during most of its existence, it should have been little affected by tidal stripping and other environmental effects exerted by the Galaxy.
Leo II is a dSph galaxy with prominent old and intermediate-age populations. The presence of old populations was first established by Swope (1967), who reported the detection of a red HB and of RR Lyrae variables. Deeper CCD exposures by Demers & Irwin (1993) revealed the existence of a less well populated blue HB. The most comprehensive variability study is that of Siegel & Majewski (2000), which presents 148 RR Lyrae stars and four anomalous Cepheids. The RR Lyrae stars indicate a dominant metallicity of dex with a metal-poor tail out to dex. The presence of intermediate-age populations was first inferred from the detection of luminous carbon stars in Leo II (Aaronson, Olszewski, & Hodge 1983; Aaronson & Mould 1985, Azzopardi et al. 1985). Five out of the seven C stars and C star candidates probably belong to an intermediate-age population judging from their position above the TRGB, although the colors and luminosities of these stars suggest that they may be 3–4 Gyr older than the C stars detected in Leo I (see Lee 1995 for details). Moreover, a number of luminous AGB stars and a red clump were detected in Leo II, which demonstrate the presence of an intermediate-age population beyond any doubt (Lee 1995; Mighell & Rich 1996). Hence the stellar age tracers show that Leo II experienced an extended star formation (SF) history.
The SF history of Leo II was quantified using deep Hubble Space Telescope (HST) imaging extending below the old main-sequence turnoff of this galaxy and theoretical isochrones. Mighell & Rich (1996) found a mean age of Gyr with SF lasting for more than 7 Gyr. They conclude that about half of the stars in Leo II formed between 8 and 12 Gyr ago. The oldest stars in Leo II are as old as the oldest Galactic globular clusters, a common feature for all Galactic dSphs and other nearby galaxies (Grebel & Gallagher 2004). Hernandez, Gilmore, & Valls-Gabaud (2000) suggest that the peak SF activity occurred Gyr ago and that SF ended Gyr ago. They excised the HB populations from their CMD analysis, and their SF history does not reproduce the old populations of Leo II. Dolphin’s (2002) CMD-fitting algorithm reveals an extended SF history starting some 15 Gyr ago and extending until 2 to 4 Gyr ago, although very little activity occurred within that age bin. The main SF activity takes place in the 8 to 15 Gyr bin according to Dolphin (2002). All three photometric analyses agree in finding an extended SF history for Leo II that lasted many Gyr, and that the main SF activity occurred at relatively high ages of 8 Gyr or more.
In a recent, shallower ground-based study Bellazzini et al. (2005) discuss the detection of red giant branch bumps in Leo II. The luminosity of the main bump indicates that the majority of the stars in Leo II is Gyr younger than regular Galactic globular clusters of comparable low metallicity to the dominant stellar population in Leo II. They also demonstrate that the red HB and red clump stars in Leo II are more centrally concentrated than the ancient HB population, akin to the population gradients found in many dSphs (e.g., Stetson, Hesser, & Smecker-Hane 1998; Hurley-Keller, Mateo, & Grebel 1999; Da Costa et al. 2000; Harbeck et al. 2001).
Interestingly, in all three deep HST CMD studies the isochrone fits require a relatively high metallicity of dex or even dex. Indeed, when comparing isochrones for old populations to globular clusters with metallicity determinations on the traditionally used Zinn & West (1984) scale, the isochrones favor too high a metallicity for metal-poor populations (Grebel 1997, 1999). As discussed by Dolphin (2002), this can be in part circumvented by using the Carretta & Gratton (1997) scale for globular clusters instead (see also discussion in Bellazzini et al. 2005). Nevertheless, the age-metallicity degeneracy that plagues purely photometric derivations of SF histories from resolved stellar populations remains.
The age-metallicity degeneracy can be resolved through spectroscopic metallicities. The first spectroscopic metallicity determination for Leo II was carried out by Suntzeff et al. (1986), who measured three red giants in this galaxy and found [Fe/H] dex. Their metallicity scale corresponds to the Zinn & West (1984) scale. More recently, Bosler et al. (2004) spectrometered 41 red giants in Leo II and found a mean metallicity of dex with a spread ranging from [Fe/H] on the Carretta & Gratton (1997) scale.
In our current paper, we present spectroscopic metallicity measurements for 52 red giants. §2 introduces the data and briefly describes the reduction strategy. In §3 the calibrations of the measured CaT equivalent widths (EWs) onto a reference metallicity scale are presented and compared to existing data sets. The resulting metallicity distribution function (MDF) is analyzed in §4 and §5 discusses this MDF in the context of simple models of chemical evolution. In §6 we turn to the derivation of stellar ages and to the age-metallicity relation of Leo II. Finally, in §7 we summarize our findings.
2 Observations and reduction
Our observations of Leo II were taken as part of the European Southern Observatory (ESO) Large Programme 171.B-0520(A) (principal investigator: G.F. Gilmore; see Koch et al. 2006a, 2006b; Wyse et al. 2006; Wilkinson et al. 2006b for more information), which aims at elucidating the kinematic and chemical characteristics of Galactic dSphs. Five fields in Leo II were observed with the FLAMES spectrograph (Pasquini et al. 2002) at ESO’s Very Large Telescope (VLT). FLAMES was used with the GIRAFFE multi-object spectrograph in low-resolution mode (). The GIRAFFE spectrograph was fed by the MEDUSA fiber system, which provides up to 132 fibers per exposure. In the same Large Programme, we also analyzed the metallicities of the Carina dSph, which is described in detail in Koch et al. (2006a, hereafter Paper I). We refer the reader to Paper I for details on observing strategy, data reduction, and calibration techniques, which will be briefly summarized in the following. Both for Carina and for Leo II the L8 grating was used, centered on the near-infrared Ca II triplet (CaT) and covering a wavelength range of 820.6 nm to 940 nm.
2.1 Target selection and acquisition
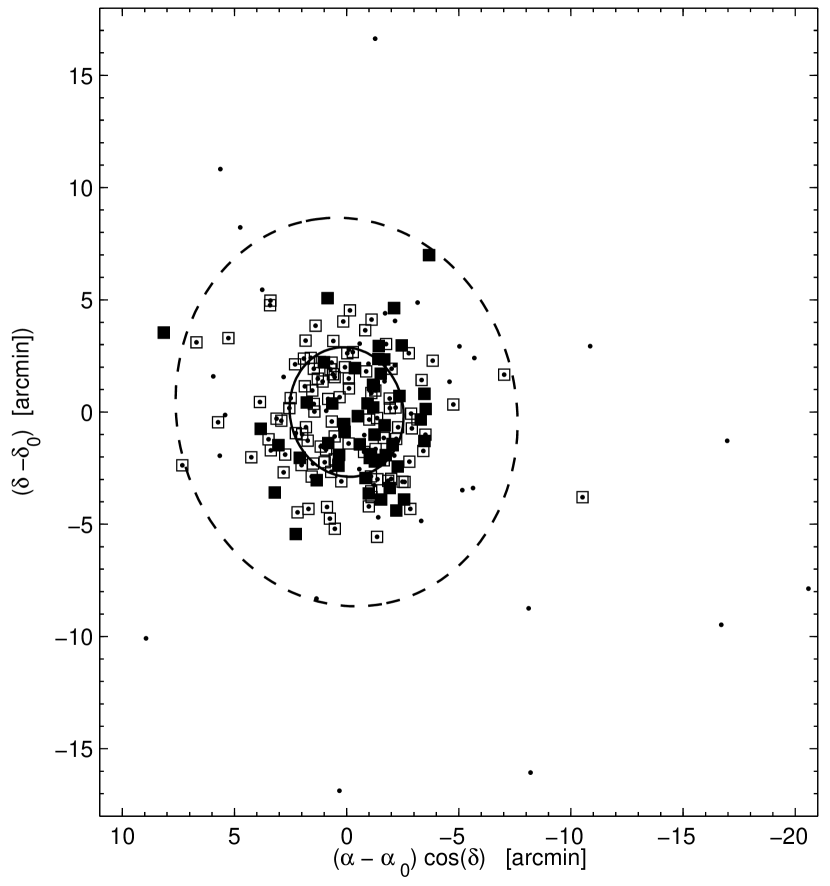
The wide field of view of the FLAMES instrument has a diameter of 25. In principle, this enables one to cover stars in the entire projected area of the Leo II dSph with one single pointing, since its nominal tidal radius is 87 (Irwin & Hatzidimitriou 1995). However, in order to account for crowding, varying stellar density, and fiber collisions, and also in order to optimize the sampling out to large radii near and beyond the tidal radius, we observed five different (overlapping) fields in several fiber configurations (see Tables 1 and 2).
Our target stars were selected using photometry and astrometry obtained by the Cambridge Astronomical Survey Unit (CASU; Irwin & Lewis 2001; McMahon et al. 2001) at the 2.5 m Isaac Newton Telescope (INT) on La Palma, Spain. From these data we selected red giant candidates covering the luminosity range from the TRGB region () down to 2.5 mag below the TRGB (). As the CMD in Fig. 1 shows we furthermore aimed at covering the full width of the red giant branch (RGB) to ensure that also potential extremely metal-poor and metal-rich red giants were included and in order to minimize any bias with regard to age or metallicity. In total, we selected and observed 195 red giant candidates.
For the purpose of accurate metallicity determinations based on the CaT, we targeted four Galactic globular clusters, which will serve as a reference scale for our measurements later on (Rutledge et al. 1997b; Paper I). Red giants in these clusters were selected from the standard fields of Stetson (2000), which provide and -band magnitudes in the Johnson-Cousins system as defined by Landolt’s (1992) standard stars. In contrast, the CASU -photometry was obtained using filters mimicking the SDSS system (Fukugita et al. 1996). Since our targeted region on the sky is partially covered by a standard star field in Leo II (Stetson 2000), we can directly compare both sets of photometry and place both the calibration clusters and the Leo II targets for the FLAMES run on Stetson’s homogeneous photometric standard system. This avoids any photometric offset, which may ultimately result in a incorrect calibration of the CaT scale as this scale is defined for -band photometry (Armandroff & Da Costa 1991). Via a linear transformation we obtained
| (1) | |||||
| . |
For the purpose of age determinations once metallicities have been measured, it is desirable to obtain as accurate a set of photometry as possible in a suitable set of filters. Since the INT filter system used in the CASU111see http://www.ast.cam.ac.uk/$∼$wfcsur/. parallels the SDSS system (Karaali et al. 2005; Jordi, Grebel, & Ammon 2006) and since Leo II is also covered by the fifth data release (DR5) of the Sloan Digital Sky Survey222 The data from the SDSS DR5 are publically available under http://www.sdss.org/dr5/. (SDSS; e.g., Stoughton et al. 2002; Adelman-McCarthy et al. 2006), we matched the CASU photometry of our targets with the (less deep) SDSS photometry. SDSS photometry is obtained by driftscan techniques, is very well calibrated, and offers a highly homogeneous data set. Moreover, the theoretical isochrones of the Padova group have been transformed into the SDSS photometric system (Girardi et al. 2004), facilitating age estimates via isochrone fitting. We determined the following transformation relations for the conversion of CASU to SDSS photometry:
| (2) | |||||
| (3) | |||||
| . |
Here the standard SDSS photometric system is denoted by and , as is the usual notation, while the CASU magnitudes are given by the primed , and .
As mentioned already, the spectroscopic observations were carried out using the same strategy and instrumental setups as described in Paper I. The location of our fields and the dates of observation are listed in Tables 1 and 2. Although we aimed at exposing each configuration for 6 hrs to reach nominal signal-to-noise (S/N) ratios of at least 20, which would enable us to derive highly accurate EWs at our spectral resolution of , a large fraction of our nights was hampered by sky conditions with a seeing as bad as 2. Therefore, the median S/N actually achieved after processing the spectra was only 15 pixel-1. Altogether 197 targets were observed, whose individual positions are shown in Fig. 2.
2.2 Data reduction
Details of the reduction process are given in Paper I. In essence, we used version 1.09 of the FLAMES data reduction system, girbldrs, and the associated pipeline version 1.05 (Blecha et al. 2000). After standard bias correction and flatfielding, the spectra were extracted by summing the pixels along a slit of 1 pixel width. The final rebinning to the linear wavelength regime was done using Th-Ar calibration spectra taken during daytime.
Sky subtraction was facilitated by the allocation of about 20 fibers configuration to blank sky. By subtracting the average sky spectrum from the science exposures using IRAF’s333IRAF is distributed by the National Optical Astronomy Observatories, which are operated by the Association of Universities for Research in Astronomy, Inc., under cooperative agreement with the National Science Foundation. skytweak, we obtained an accuracy of the final sky-subtracted spectra of the order of 2%, taken as the 1-dispersion of the medians of the sky-subtracted spectra in any exposure divided by the median sky.
Our data set was then completed by co-adding the dispersion-corrected and sky-subtracted science frames, weighted by the exposures’ individual S/N, and subsequent rectification of the continuum. Fig. 3 shows representative spectra across our magnitude range for which reliable EWs could be determined.
2.3 Membership estimates
In order to separate Leo II’s RGB stars from Galactic foreground stars, we determined the individual radial velocities of each target star by means of cross-correlation of the three calcium triplet lines against synthetic template spectra using IRAF’s FXCOR task. The template was synthesized adopting representative equivalent widths of the CaT in red giants. The typical median velocity error achieved in this way lies at 2.4 km s-1. This method will be laid out in detail in a forthcoming paper focusing on the dynamical aspects of Leo II (Kleyna et al. 2006, in prep.).
At a systemic velocity of (76 1.3) km s-1 (Vogt et al. 1995), Leo II’s velocity distribution will inevitably contain a number of Galactic foreground stars along the galaxy’s line of sight. However, owing to our selection of target stars whose colors and luminosities are consistent with membership in Leo II and due to the much lower Galactic field star density, Leo II’s velocity peak clearly stands out against the Galactic contribution (see the histogram in Fig. 4). By application of the Besançon synthetic Galaxy model (Robin et all. 2003) we find a Galactic distribution with a mean and dispersion of 15 km s-1 and 57 km s-1. From this distribution we estimate that the number of Galactic interlopers, subject to our color-magnitude criteria, within 3 (5) of an initial fit of a Gaussian velocity peak to the Leo II data with mean and dispersion of 79.8 km s-1 and 7.3 km s-1, amounts to 2 (4) and thus should not give rise to any concern in our analysis of Leo II’s stellar populations.
Rejecting 23 apparent radial velocity non-members that deviate more than 5 from this initial fit, we approach the mean heliocentric velocity and line-of-sight velocity dispersion by performing an iterative error-weighted maximum-likelihood fit assuming a Gaussian velocity distribution.
The resulting mean of (79.20.6) km s-1 and velocity dispersion of (6.80.7) km s-1 are in very good agreement with Vogt et al. (1995). These authors found a a central velocity dispersion of (6.71.1) km s-1 based on 31 high-resolution spectra of stars within the core radius. Depending on the criteria for defining membership we end up with 166 radial velocity members if we adopt a -cut in the velocity distribution, whereas a more conservative cut at leaves 155 apparent member stars. Given the low likelihood of interlopers in our sample, we will apply the -cut in the following.
3 Metallicity calibration
The infrared lines of the singly ionized calcium ion at 8498, 8542, and 8662 Å are among the strongest absorption features in the spectra of RGB stars. Their EWs can thus be accurately determined and reach values of typically a few Ångströms. As was nicely demonstrated in the pioneering works of Armandroff & Zinn (1988); Armandroff & Da Costa (1991) and Rutledge et al. (1997a,b), the CaT can be employed to measure the metallicity of red giants in old and metal-poor populations. Subsequently, the CaT method was extended to and calibrated for the entire range of metallicities of [Fe/H] and for ages covering age [Gyr] by Cole et al. (2004). This fundamental work permits us to apply the CaT method to populations that also contain stars of intermediate ages, such as Carina or Leo II.
The EWs of the CaT lines were measured using a modified version of Da Costa’s EWPROG code kindly made available by A. A. Cole (see also Cole et al. 2004). Each of the lines was fit by a Gaussian plus a Lorentzian component in the line bandpasses (and associated continuum) as defined in Armandroff & Zinn (1988). The final EW was then obtained by summing up the flux in the theoretical profile across the bandpass. The corresponding uncertainties were determined from the residuals of the fit.
In order to obtain a self-consistent analysis of the Leo II data, we rederived the relation between line strengths and metallicity. We follow the original prescription of Rutledge et al. (1997a, hereafter R97a) in defining the Ca line strength as the weighted sum of the three CaT lines:
| (4) |
This definition differs from that employed throughout Paper I, where we made no use of the first of the Ca lines (). Owing to the generally low S/N of our Leo II spectra, we were able to measure EWs of all the three CaT lines for only 20 radial velocity members (down to a S/N of approximately 10), while we could reliably fit the two stronger lines at 8542, 8662 in a further 32 stars (down to S/N 6). In order to place the linestrengths derived from these spectra on the same scale as the ones with better data quality, we established a linear relationship between the linestrength and the strength using only the two stronger lines from the 72 high S/N spectra (with S/N ratios of about 60–80) of our calibration clusters, NGC 3201, NGC 4147, NGC 4590 and NGC 5904 (for details on these calibration clusters, we refer to Paper I.) We find the linear relation
| (5) |
with associated uncertainties of 0.02 on each of its coefficients and a r.m.s. scatter of 0.05Å.
The power of the CaT calibration lies in the introduction of a reduced width, , which reduces the strong effects of stellar gravity on the Ca line strengths to first order (and the far lesser influence of effective temperature). This relation applies within a given cluster, for which VHB is the apparent magnitude of the horizontal branch. The reduced width is defined in the high-S/N work of R97a as
| (6) |
where denotes the stellar magnitude. Based on our observed high S/N spectra of the four calibration clusters, we find the slope in this relation to be Å mag-1, which is somewhat shallower than the canonical value of . The quoted error on is obtained from the formal uncertainty from the fit, multiplied with the median error of unit weight (m.e.1), which is defined by summing over all stars in the four clusters as m.e.1 = . Here denotes the deviation of each star’s from the fit, is the measured uncertainty in the EWs, and is the number of stars in the fit, minus the number of calibration clusters plus one (see also R97a). From our data we find a m.e.1 of 2.56.
For the HB level of Leo II, we adopted the value of 22.170.14 mag (Siegel & Majewski 2000), which refers to the HB locus based on the analysis of a sample of RR Lyrae stars.
3.1 Uncertainties affecting the metallicity measurements
There are various metallicity scales to be found in the literature (e.g., ZW, CG, Kraft & Ivans 2003). The CG scale and the Kraft & Ivans scale are based on high resolution data, but there is no physical reason to give preference to any of them. Traditionally the ZW has been the most widely used scale, but more recent calibrations of the CaT method have mainly used the reference metallicity scale of CG as introduced by Rutledge et al. (1997b). In our current study, we adopt this scale as well. The final calibration of the reduced width onto metallicity is then obtained via the linear relation
| (7) |
with an r.m.s scatter of 0.02 dex (and m.e.1 = 0.67), as established from our four calibration clusters. We note that the coefficients in eq. 7 differ slightly from the calibration established in Paper I, which can be attributed to different definitions of the CaT linestrength . Nevertheless, reassuringly both calibrations agree to within their uncertainties. Fig. 5 shows the distribution of our target stars in the vs. plane, together with some isometallicity lines according to eqs. 6,7 to guide the eye. This diagram already indicates that there is a wide range of metallicities present in Leo II, where the majority of stars lies at a [Fe/H] of about dex.
The mean random error introduced by measurement errors in the EWs and our photometric uncertainties amounts to 0.06 dex, while the full mean error on our metallicities, accounting for all calibrations (eqs. 5–7), is found to be 0.16 dex.
However, there are numerous additional potential sources of uncertainty, which may affect the accuracy of our calibration of Ca onto iron. Among these are the [Ca/Fe] ratios for the stars in dSphs, which, for the sake of the method, have to be assumed to be comparable to the abundance ratios in Galactic globular clusters. On the other hand, high-resolution spectroscopic data of red giants in dSphs and dwarf irregulars found generally lower [/Fe] ratios than in Galactic populations of the same [Fe/H] (e.g., Hill et al. 2000; Shetrone, Côté, & Sargent 2001; Fulbright 2002; Shetrone et al. 2003; Tolstoy et al. 2003; Geisler et al. 2005; Pritzl et al. 2005). However, our own high-dispersion analysis of stars in the Carina dSph galaxy (Koch 2006) and the comparison with CaT measurements of the same stars from Paper I shows generally good agreement in the derived metallicities albeit with some scatter.
In this context it is worth noting that the recent high-dispersion analyses by Bosler et al. (2006; hereafter B06) have allowed these authors to establish a calibration of CaT line strength directly onto [Ca/H], yielding a median [Ca/H] ratio of dex with stars covering the regime of to dex. Under the simplifying assumption that all these stars share an average metal content of [Fe/H] dex, B06 tentatively estimate Leo II’s global [Ca/Fe] ratio to be of the order of dex, similar to the old Galactic globular clusters and field stars. This apparently indicates that the calibration of the CaT onto metallicity, which assumes a [Ca/Fe] as in Galactic globular clusters, can safely be applied to the Leo II dSph without introducing any significant bias due to a strongly deviant Ca abundance ratio.
Other potential error sources also include the a priori unknown variations of the HB level with both age and metallicity, which may introduce uncertainties of the order of dex (Da Costa & Hatzidimitriou 1998; Cole et al. 2004), which is below the precision of the abundance measurements themselves. These effects are discussed in detail in Paper I.
Hence, in the light of the comparatively low S/N of our spectra, we conclude that the measurement errors on the CaT EWs are the major contributors to the quoted uncertainty, rather than the systematic effects such as variations in the HB or the [Ca/Fe]-ratios mentioned above, so that the former will effectively lead to a broadening of the derived MDF.
3.2 Comparison with other spectroscopic measurements for individual stars
Of the 74 red giants from the study of B06, which were observed with the Low-Resolution Spectrograph (LRIS) at the Keck 10-meter telescope, 32 coincide with our targets. Fifteen of these had sufficient S/N in our data to allow us to determine metallicities444Note that both spectrographs achieve comparable resolutions (FWHM) – 1.55Å in the case of LRIS and 1.31Å for our GIRAFFE data.. These common CaT measurements can be employed for a cross check of the accuracy of the method and to validate the respective measurements. Fig. 6 shows the comparison of the linestrengths W (left panel) and the reduced widths (right panel) from both data sets. A linear error-weighted least-squares fit to the samples yields the relations
| (8) | |||||
| (9) |
The fact that these are not one-to-one relations is to be expected, since B06 measured EWs of the CaT lines by fitting a single Gaussian, whereas we used an additional Lorentzian to yield a better fit in the line wings (see also Cole et al. 2004). Moreover, B06 relied on the definition of in terms of a slope from the literature (R97a), whereas we obtained different estimates of by using our own internal calibration, which finally reflects in the differences seen in either W and W’. We note, however, that, with a median value of 23, B06 achieved S/N ratios slightly higher than ours. Generally, our analysis yields reduced widths that are larger by Å.
4 Leo II’s metallicity distribution function and chemical evolution models
4.1 The metallicity distribution function
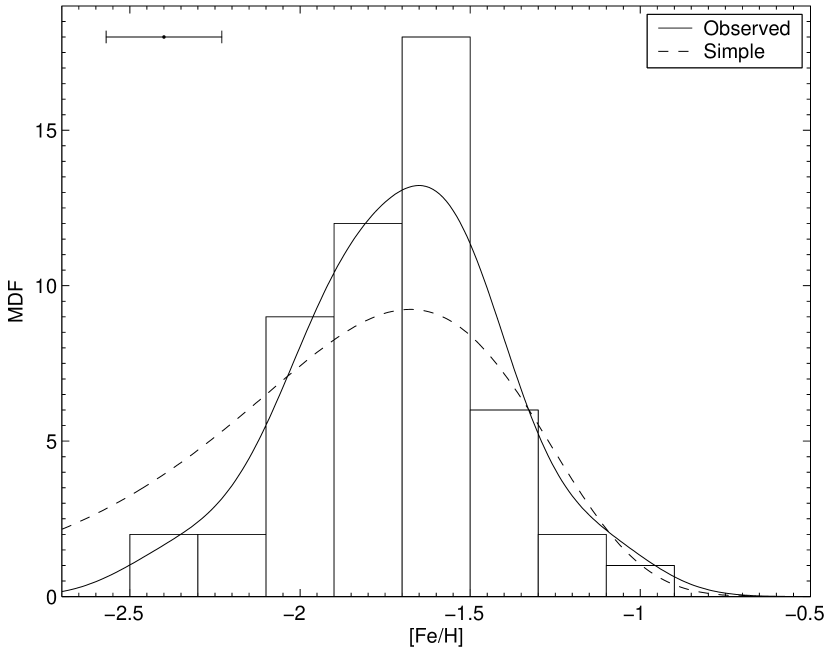
Fig. 7 shows our final metallicity distribution (MDF) for 52 Leo II red giants on the scale of CG. This MDF is peaked at an error-weighted mean metallicity of dex and exhibits a full range in [Fe/H] of 2.4 to dex. Note the apparent lack of more metal-poor stars. The observed dispersion of the MDF amounts to 0.29 dex, but accounting for the measurement uncertainties by subtracting these in quadrature, Leo II’s internal metallicity dispersion is estimated to be 0.23 dex. These values are in reasonable agreement with the estimates of Bosler et al. (2004), who derived a mean metallicity of 1.57 dex on the CG scale based on CaT spectra of 41 red giants.
All in all, our spectroscopic metallicities span about 1.3 dex in [Fe/H]. As Fig. 8 implies, there is no apparent trend of metallicity and location in the CMD seen in our data: both metal-rich and metal-poor giants are found at the same location on the RGB. This indicates that there is a comparably broad range of ages present in Leo II. In fact, Bosler et al. (2004) have demonstrated that Leo II’s RGB stars may span ages between 2 and 13 Gyrs. We will address the question of an age-metallicity relation in our data in Section 5. The range of metallicities and the mean metallicity measured by us are also in excellent agreement with fiducial-based photometric metallicity estimates on the CG scale by Bellazzini et al. (2005). These authors find a mean metallicity of with a dispersion of 0.3 dex. The full range of metallicities that they derive from globular cluster fiducials is [Fe/H] , also on the CG scale. This also agrees well with the estimates from Mighell & Rich’s (1996) HST photometry (mean metallicity ).
The overall shape of the MDF is highly asymmetric: At the metal-rich end it shows a smooth, but rapid, fall-off. A sharp drop-off of an MDF towards higher metallicities is generally attributed to a sudden cessation of SF, possibly caused by a strong mass loss (e.g., through winds). Although we see a metal-rich fall-off in our MDF, it is not as distinct in our data as, e.g., in the MDF of Bosler et al. (2004). Towards the metal-poor end, the MDF shows a noticeable number of metal-poor stars, but it exhibits a sharp drop below 2 dex. While we find seven stars with [Fe/H], simple models of chemical evolution (e.g., Pagel 1997, p. 218) generally predict an excess of stars in this regime and at lower metallicities (see the model curve for G-dwarfs in Fig. 7). This is in analogy to the “G-dwarf problem” in the solar neighbourhood (e.g., Nordström et al. 2004). Since these quantitative models are based on the prescriptions for long-lived stars, they cannot be immediately applied to our data that are based on K-giants of finite, negligible lifetimes. However, under the assumption of a standard initial mass function, zero initial metallicity, and accounting for the loss of metals from the galaxy, in the simple model of chemical evolution one would qualitatively also expect an excess of the oldest and most metal-poor (K-) giants, so that we are here in fact faced with a “K-giant”-problem. Assuming a constant SF rate, the oldest population should then contribute the largest fraction of K giants.
4.2 Comparison with chemical evolution models for other dSphs
We now turn to the question whether more information can be extracted from the observed MDF when comparing it to sophisticated models, which preferably incorporate the effects of outflows and infalling gas. A number of such models were calculated for dSph galaxies (e.g., Ikuta & Arimoto 2002; Lanfranchi & Matteucci 2003, 2004; Hensler et al. 2004; Font et al. 2006). Carigi, Hernandez, & Gilmore (2002) are the only group, who calculated chemical evolution models of Leo II, based on the SF history derived by Hernandez et al. (2000). However, these models do not account for the old population in this galaxy (see also Dolphin 2002). Furthermore, Carigi et al. (2002) do not provide model predictions for Leo II’s stellar MDF in the literature, yet for our current work, we need theoretical MDFs to compare to.
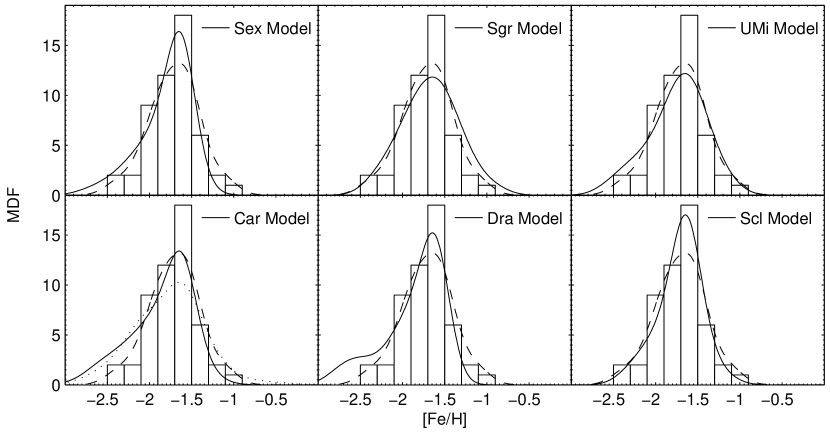
For convenience, we therefore chose to overplot the models by Lanfranchi & Matteucci (2004, hereafter LM04) on our data. Although these authors did not model the evolution of Leo II itself, we can derive some basic properties of this galaxy by comparing our observed MDF with the published theoretical MDFs for other dSphs. The modelled MDFs comprise the dSphs Carina, Draco, Sagittarius, Sextans, Sculptor and Ursa Minor (Fig. 9). Each of the dSphs is characterized by its SF rate and a wind efficiency, the latter being the proportionality constant between gas mass and SF rate. These parameters were optimized by LM04 to fit extant observational data such as the [/Fe] ratios from red giants, their total mass, and total gas mass. As discussed above, it is not a priori self evident that the model prescriptions based on long-lived stars can be immediately applied to observed K-giant MDFs. However, a comparison of the K-giant sample of the solar neighbourhood (McWilliam 1990) to the local G-dwarf MDF from Nordström et al. (2004) does not show any evidence for a significant difference, as both of them appear as a narrow distribution, peaked slightly below solar (see also Cole et al. 2005). Thus we continue by following the long-standing practice of comparing G-dwarf models and MDFs of K-giant as unbiased tracers of low-mass stars.
As Fig. 9 implies, all the shown MDFs are rather similar, with the exception of Sgr. This is particularly interesting considering the wide range of absolute magnitudes covered by these galaxies (Mateo 1998). In this context, the mean abundances are comparatively similar and individual differences are basically reflected in the distributions’ details, as we will discuss below. In terms of the location of its peak metallicity Leo II’s observed MDF resembles the model MDFs of the dSphs Car, Scl, and UMi. However, the probabilities for the same underlying population derived from a Kolmogorov-Smirnov (K-S) test are 13% for UMi and Leo II, 29% for Car and Leo II, and zero for all other dwarfs shown in Fig. 9. In this simplified sense, Leo II and Car are the two most similar dSphs of the entire set.
In contrast to Leo II, which shows an extended SF history from early times on that seems to have peaked around 9 Gyr (e.g., Mighell & Rich 1996; Dolphin 2002; Bosler et al. 2004), the dSph UMi is essentially a purely old galaxy (Carrera et al. 2002; Wyse et al. 2002) and hence not a good comparison object for Leo II, even though the ancient SF lasted several Gyr (see Ikuta & Arimoto 2002; Grebel & Gallagher 2004). The Car dSph, on the other hand, has experienced ancient and intermediate-age SF, but in contrast to Leo II this activity occurred in well-separated episodes (e.g., Smecker-Hane et al. 1994 and references in Paper I). In fact, it is the only dSph known to exhibit such clearly episodic SF. The bulk of the stars in Car seems to have formed some 7 Gyr ago (Hurley-Keller et al. 1998). In terms of the age range covered by the SF in Car and Leo II, these two dSphs are similar. However, they show considerable differences in the details of their evolutionary histories (see, e.g., Grebel 1999, 2000; van den Bergh 1999b, 2000).
The overall low mean metallicities of dSphs (Grebel et al. 2003, Table 1) are most easily explained by a low SF rate according to the models of LM04, which would then leave a reservoir of gas at the final epoch of SF. The fact that there is an observed termination of the SF is then indicative of an efficient gas removal, e.g., via stripping by the Galaxy (Ikuta & Arimoto 2002). It nonetheless remains difficult to explain the present-day gas deficiency in dSphs (e.g., Gallagher et al. 2003), which cannot be caused by pure ram pressure stripping in a smooth intergalactic medium (Grebel et al. 2003).
In order to gain insight in the processes governing the shape of the MDF and the related evolutionary parameters, we shifted all LM04 models to the same peak metallicity as measured in Leo II (Fig. 10). Thus one assumes the identical effective nucleosynthetic yield and similar SF efficiencies for all the modeled systems. The majority of the models, except for the predictions for Sgr and UMi, tend to produce a steep decline of the MDFs towards the metal-rich tail. This is caused by an intense wind, which effectively drives out the metals and thus prevents any further substantial enrichment or subsequent SF. For the cases of Scl, Sgr, and UMi, the drop in the MDF is not that sudden and approximates the observations of Leo II fairly well. The respective galactic wind efficiencies are 13 (times the SF rate) for Scl, 9 for Sgr, and 10 for UMi. The LM04 models tend to overestimate the number of metal-poor stars, leading to the already mentioned G-dwarf problem (Sect. 4.1). This is most pronounced in the comparison of the models for Car and Dra with Leo II’s MDF (Fig. 10), while the Scl and Sgr model MDFs resemble Leo II’s metal-poor tail more closely. The latter coincidence is remarkable, as LM04 did not include any pre-enrichment in their models. In the context of the intense galactic winds it is worth noticing that the gas masses of these galaxies predicted by the LM04-models (of the order of 310Mtot) are lower than the upper limits placed by observations (Mateo 1998; Grebel et al. 2003), but still well consistent with the overall gas deficiency in dSph galaxies.
Overall, as one might expect none of the dSphs models gives a perfect representation of Leo II’s MDF since LM04’s models were not made to fit its MDF. The K-S probabilities are below the 5% level with the exception of Scl (45%), UMi (34%), and Sgr(25%). Scl is a predominantly old galaxy with subpopulations distinct in metallicity and possibly in age and kinematics (Grebel, Roberts, & van de Rydt 1994; Grebel 1996; Hurley-Keller et al. 1999; Majewski et al. 1999; Harbeck et al. 2001; Tolstoy et al. 2004). Likewise, UMi is an ancient galaxy, but in spite of its extended early SF it does not seem to show metallicity gradients (e.g., Carrera et al. 2002). Sgr formed stars over a very long period of time. Intermediate-age populations dominate (mean age of 81.5 Gyr; Bellazzini et al. 2006), but low-level SF may still have occurred until 0.5 to 1 Gyr ago (Bellazzini, Ferraro, & Buonanno 1999). In fact, SF may have occurred with a variable rate leading to multiple peaks (Layden & Sarajedini 2000). The massive Sgr is an exceptional case among the dSphs considered here since its evolution has been strongly affected by its continuing disruption by the Milky Way (Ibata et al. 1994; Majewski et al. 2003). No two dSphs share the same SF history or enrichment history, and in addition external effects such as ram pressure or tidal stripping or the early Galactic UV radiation field may have affected their evolution (van den Bergh 1994; Grebel 1997). Hence it may not be surprising that Leo II’s MDF is not well matched by models calculated for other dSphs. If Leo II’s distance of 230 kpc is representative of the distance that it had during most of its existence, then external effects may have played less of a role than for the closer dSphs. For instance, Siegel & Majewski (2005) report on only a marginal stellar component beyond the King (1962) tidal radius, which cannot be distinguished from statistical fluctuations. It is clear that the detailed understanding of Leo II’s MDF and evolution will require detailed modeling adapted to the special properties of this galaxy. However, based on the comparison with the LM04 models, we may speculate that also Leo II has been affected by winds, albeit at a modest level.
5 Stellar Ages
5.1 Obtaining age estimates
In order to gain a deeper insight into the detailed SF history of Leo II we need to couple our spectroscopic abundances with age estimates. We can derive ages for all stars with metallicity estimates through isochrone fitting. For each of these stars we fit its location in the CMD using (, )-isochrones of that star’s individual metallicity. For this purpose, we employed a set of Padova isochrones (Girardi et al. 2004) in the SDSS photometric system. These were interpolated to yield an estimate of each red giant’s age.
A few of our targets lie outside of the applicable isochrone grid. On the one hand this may be due to problems arising from the color transformations of theoretical isochrone models to the observational plane and the resulting failure to simultaneously and perfectly reproduce all features of a stellar system and in particular the RGB (e.g., Vandenberg et al. 2000; Gallart, Zoccali & Aparicio 2005). In the case of our data, this happens when our targets either turn out to be brighter than the respective theoretical tip of the RGB, or when they lie redwards of the oldest available isochrone (cf. Tolstoy et al. 2003). The latter may be caused by statistical fluctuations of the metallicity estimates, where the respective measurement error associates the RGB star with an isochrone not necessarily corresponding to its true metallicity. In these cases, the isochrone fit can only yield a lower limit for the “true” stellar age. Hence, we were able to derive ages for 33 targets and lower limits for 18 stars. For one star, T_21, no reliable age could be established, since its red color places it far outside the applicable isochrone grid. In 14 cases, the location of the targets above the theoretical tip RGB coupled with their CaT metallicity makes them likely bright AGB star candidates. As Suntzeff et al. (1993) argue, their spectroscopic metallicities are not expected to be underestimated by more than 0.05 dex so that we did not account for their presence in our metallicity determinations. Seven of these stars could also be re-identified in the infrared point source catalog of 2MASS (Cutri et al. 2003). All of the 2MASS stars have metallicities consistent with the peak value of our MDF. Three of these stars are apparently younger than 5 Gyr.
The uncertainty of each stellar age was then obtained by means of Monte Carlo simulations, in which each target was varied around its uncertainty in metallicity and its photometric error. The latter amounts to 0.02 mag on average for both and , and we also accounted for the r.m.s. scatter about the filter transformation (see eqs. 2,3), potential uncertainties in the reddening (0.02 mag) and distance. Using these new parameters, the target was re-fit by the appropriate isochrones. The resulting variation of the thus derived new ages around the original value was then taken as a representative number of our random measurement uncertainty. If we were to assume an accurately determined distance and perfectly measured metallicities, our photometry would allow us to infer ages with about 40% accuracy on average. It turns out that our metallicity uncertainties and the variation in the distance modulus (0.13 mag; Bellazzini et al. 2005) contribute roughly in equal parts to the error budget and thus allow us to obtain individual ages with final typical random errors ranging from 25% to 100% (corresponding to 0.2–0.4 dex in log ).
Another potential source of uncertainty in the age derivation is the a priori unknown [/Fe]-ratio in the target stars. Since dSphs are known to have experienced different chemical evolution histories than the Galaxy (e.g., Matteucci 2003), the scaled-Solar abundance ratios employed in our isochrone grids need not necessarily to apply to our stars (see discussions in Tolstoy et al. 2003; Cole et al. 2005). We approach this effect by representing such deviations from the standard abundance mixture via the empirical relation between the overall heavy element abundance [/H] to be used for the isochrones and the -element abundance from Salaris et al. (1993): [/H] [Fe/H] + log (0.638 10[α/Fe] + 0.362). Recent high-resolution spectroscopic data indicate that the [/Fe]-ratio in dSphs is enhanced by 0.1 dex (Shetrone et al. 2001, 2003; Venn et al. 2004; Koch 2006). These data can be approximated by a linear relation of the kind [/Fe] [Fe/H] in the metallicity range covered by our Leo II targets. This slight -enhancement leads to only a small shift towards younger ages w.r.t. those obtained with the scaled-Solar isochrones. All in all, the neglect of any -enhancement leads to a systematic uncertainty of 4% in our derived ages.
Finally, we note that the evolutionary status of a star cannot be unambiguously known from the CMD so that we have to identify all our targets with first-ascent RGB stars, unless this is excluded by the isochrone grid (as shown by the different symbols in Fig. 11). However, Bellazzini et al. (2005) report the detection of a secondary bump in the RGB luminosity function at 0.5 mag ( 20.4 mag), which may be attributed to the AGB clump (Gallart 1998; Lee et al. 2003), from which it is indistinguishable in practice. Although this feature occurs at fainter magnitudes than our target stars (cf. Fig. 1), its presence indicates that our RGB sample may contain a non-negligible admixture of stars belonging to the AGB. If we simply adopt an RGB isochrone for deriving an age for a star, which was in fact on the AGB, we find from our isochrone grids that its age will be underestimated by 18% on average (see also Cole et al. 2005).
Our final ages and their estimated uncertainties are listed in Table 3.
5.2 Age-metallicity relation
Fig. 11 shows a plot of the age-metallicity relation (AMR) obtained from our CaT metallicities and successive isochrone fits. The first thing to note is that our data cover a wide range in ages, ranging from 2 to 15 Gyr. The AMR is essentially flat for ages above Gyr. For the majority of our stars we find ages between 5 and 11.5 Gyr with an indication of a peak around (9 2) Gyr. A small number of stars is older than this limit (note, however, that the limits of the applied isochrone grids extend beyond the ages of the oldest globular clusters and of the current WMAP estimate of the age of the Universe). Given the small sample and the uncertainties of our data, the inferred distribution of the ages of the stellar populations of Leo II is in good agreement with the SF histories derived from deep CMDs (Mighell & Rich 1996) and underscore this galaxy’s extended SF history already from early epochs on.
The majority of the most metal-rich stars above dex is identified with a number of objects younger than 5 Gyr. Such a seemingly sudden jump in the AMR caused by this populous group of young stars had not been detected in Leo II before (see, e.g., Bosler et al. 2004). Provided the ages of this component are real and not an artifact caused by an overestimate of their metallicity, by Galactic interlopers, or by problems with the isochrones and the photometry, this points to the presence of a younger population in Leo II. As summarized in the Introduction, earlier photometric studies suggested that the main star formation occurred longer ago, peaking at 8 or 9 Gyr (e.g., Mighell & Rich 1998; Dolphin 2002). Our age estimates for the metal-rich population are consistent with the youngest photometric ages proposed by Dolphin (2002). If star formation in Leo II did indeed last until about 2 Gyr ago, then this dSph resembles other distant dSph companions of the Milky Way, in particular Leo I, the most remote Galactic dSph satellite (Gallart et al. 1999; Held et al. 2000; Bosler et al. 2004). Furthermore, we note that stars more metal-poor than dex are practically found across the full age range from 5 to 15 Gyr, although the age estimates for these objects provide mostly a lower boundary.
It is clear that age derivations in Leo II have to be taken with care. Taking our AMR at face value, our ages indicate that Leo II experienced star formation continuously until about 2 Gyr ago. It would also appear that Leo II did not undergo significant enrichment during the first seven or so Gyr after it was rapidly enriched to reach dex immediately after the Big Bang. If this was indeed the case, it would indicate that either freshly synthesized metals must have been lost (e.g., through galactic winds) or that Leo II was constantly rejuvenated by infall of low-metallicity gas.In this vein, a constant mean metallicity can be retained if metal-poor gas flows in at a same rate as the SF rate (e.g., Larson 1972; Lynden-Bell 1975). It is nevertheless unclear whether Leo II started at zero metallicity before experiencing any enrichment, or if the galaxy formed its stars from pre-enriched external material. From 7 to approximately 4 Gyr ago, the metallicity may have been slightly lower than the mean metallicity in this galaxy. These stars then seem to have formed from more metal-poor material than the bulk of Leo II’s population. If the more metal-rich stars are indeed younger than 5 Gyr, then this appears to have been a period in which either metals were retained more efficiently and used in subsequent star formation, or in which gas accretion did not play a major role. The lack of extremely metal-poor stars, which has also been observed in all the other dSphs with available CaT spectroscopy so far, is very noticeable in Leo II as well. More data are needed to define the AMR more completely.
5.3 Radial or spatial trends
Many of the Local Group dSphs exhibit radial population gradients (e.g., Harbeck et al. 2001), which broadly resemble each other in the sense that the more metal-poor (and/or older) stellar populations are more extended compared to the more metal-rich and younger populations, which tend to be more centrally concentrated. This general trend has also been detected in Leo II, where Bellazzini et al. (2005) have shown that the predominant red clump stars are in fact significantly more concentrated than the old blue HB and RR Lyrae stars. The numerous red clump stars can be associated with the dominant intermediate-age population of an age of 9 Gyr as opposed to the older (10 Gyr) HB population (Mighell & Rich 1996). Hence, Bellazzini et al. (2005) concluded that the radial population gradient is primarily a reflection of an age gradient.
In Fig. 12 (top panel) we plot our CaT based metallicities versus elliptical radius, adopting an ellipticity of 0.13 (Irwin & Hatzidimitriou 1995). In this representation, there is only a weak gradient recognizable. An error-weighted least-squares fit yields a slope of (0.0420.010) dex arcmin-1 (1.50.4) dex kpc-1), corresponding to a change of 0.2 dex across the face of the galaxy, which is of the order of the measurement uncertainties. The cumulative number distributions in Fig. 12 do not exhibit a distinct spatial separation of the metal-rich and metal-poor populations when subdividing the data at the median value of dex. Although there is a weak indication of an excess of metal-rich stars at about 4–5, we cannot exclude the possibility that both populations have the same spatial distribution. A K-S test shows a probability of 76% (1.2) for this possibility. This result underscores the suggestion by Bellazzini et al. (2005) that, despite the presence of metallicity variations, the main driver of a population gradient in Leo II seems to be the age.
On the other hand, in terms of an age gradient, stars younger and older than 10 Gyr exhibit the same spatial distribution with a K-S probability of 98%. Also when confining the data to only those stars of the age peak around 9 Gyr, the probability of a same radial distribution is comparably high, but may be hampered by the sparse sampling of older stars. In fact we cannot exclude the hypothesis that the populations of different ages are equally distributed at the 2-level. Considering the uncertainties associated with RGB age dating and with the small number statistics of our study, a better way of investigating the presence of any age gradients is by using stars that are secure age tracers such as HB stars, red clump stars, and stars along the vertical red clump (see, e.g., Grebel 1997; Stetson et al. 1998; Harbeck et al. 2001).
6 Summary and Discussion
After Leo I, Leo II is the most remote dSph companion of the Milky Way. Its prevailing intermediate-age stellar population as well as its significant population of old stars make it an ideal testbench to study star formation that extended over many billions of years. Existing photometric and spectroscopic data as well as our own results suggest that SF activity may have ceased only 2 Gyr ago (Dolphin 2002; Bosler et al. 2004). In the framework of a VLT Large Programme tailored to investigate kinematical and chemical evolutionary aspects of Galactic dSphs we have determined CaT metallicities for 52 red giants in this system, thereby doubling the largest previously published data sets (Bosler et al. 2004; B06). Our targets cover the entire area of the galaxy, thus allowing us to efficiently trace potential spatial metallicity variations.
By employing the well-established CaT technique we showed that Leo II’s MDF peaks at 1.74 dex (CG scale), in agreement with previous spectroscopic and photometric estimates (e.g., Bellazzini et al. 2005 and references therein). We infer a range of metallicities of dex. We emphasize that Leo II does not contain any extremely metal-poor stars of comparably low metallicities as found in the Galactic halo field stars. The lowest metallicities inferred in our study are similar to those of metal-poor Galactic globular clusters. In the compilation of Venn et al. (2004), 7% of the (kinematically selected) halo stars lie in the regime of [Fe/H] and only 1% lie below dex. If these numbers were to be considered also representative of the dSphs’ MDFs, we would expect to find about three to four stars more metal poor than dex in Leo II. A similar lack of extremely metal-poor stars has also been observed in other Galactic dSphs (e.g., Shetrone et al. 2001; Pont et al. 2004; Bosler et al. 2004; Tolstoy et al. 2004; Koch et al. 2006a,b). While these studies all tried to cover the full color range of the RGB to ensure that stars of very low or very high metallicities, if present, would not be missed, the aforementioned deficiency might still be blamed on small number statistics.
For want of adequately sophisticated chemical evolution models of the Leo II dSph itself, we compared the observed MDF to the model predictions for other Galactic dSphs from LM04. These models include the effects of supernovae of type Ia and II and galactic winds. None of these models really fits Leo II’s MDF well, which may not be surprising given that each Galactic dSph has experienced its own unique evolutionary history (e.g., Grebel 1997, 1999). LM04’s model for the Carina dSph approximates the MDF of Leo II best, and although Car experienced strongly episodic star formation its age range is comparable to that of Leo II.
The range in [Fe/H] covered by our MDF, combined with the fact that there is no obvious trend of metallicity with the color of the red giants indicate that there is a broad range of ages present in Leo II, a fact already known from earlier photometric CMD analyses. By means of isochrone fitting using our spectroscopic metallicities as an additional constraint, we could show that the ages span the full range from 2 to 15 Gyr. There is a considerable fraction of “younger” and more metal-rich stars with ages of a few Gyr in our data, but one cannot exclude the possibility that these may in fact be AGB contaminants.
Our AMR suggests constant star formation across our entire age range, although we note that our measurement accuracy and the age resolution would not allow us to detect any potential gaps in Leo II’s SF history. The metallicity remained fairly constant for most of the active periods of Leo II, indicating early star formation from pre-enriched gas and possibly continued rejuvenation by little-enriched gas until some 5 Gyr ago. However, we caution that this qualitative interpretation is subject to the many uncertainties affecting the derivation of ages.
There appears to be no radial population gradient from the spectroscopic point of view, at least not in metallicity and at best weakly indicated in our inferred age distribution. Bellazzini et al. (2005) show that Leo II follows the common trend of containing more centrally concentrated intermediate-age populations as compared to the old component. In the case of Leo II the main driver of the population gradient appears to be age, since we have demonstrated that the AMR shows little evidence for metallicity variations (i.e., enrichment) across most of the age range.
References
- Aaronson et al. (1983) Aaronson, M., Olszewski, E. W., & Hodge, P. W. 1983, ApJ, 267, 271
- Aaronson & Mould (1985) Aaronson, M., & Mould, J. 1985, ApJ, 290, 191
- Adelman-McCarthy et al. (2006) Adelman-McCarthy, J. K., et al. 2006, ApJS, 162, 38
- Armandroff & Zinn (1988) Armandroff, T. E., & Zinn, R. 1988, AJ, 96, 92
- Armandroff & Da Costa (1991) Armandroff, T. E., & Da Costa, G. S. 1991, AJ, 101, 1329
- Azzopardi et al. (1985) Azzopardi, M., Lequeux, J., & Westerlund, B. E. 1985, A&A, 144, 388
- Bellazzini et al. (1999) Bellazzini, M., Ferraro, F. R., & Buonanno, R. 1999, MNRAS, 307, 619
- Bellazzini et al. (2005) Bellazzini, M., Gennari, N., & Ferraro, F. R. 2005, MNRAS, 360, 185
- Bellazzini et al. (2006) Bellazzini, M., Correnti, M., Ferraro, F. R., Monaco, L., & Montegriffo, P. 2006, A&A, 446, L1
- Belokurov et al. (2006a) Belokurov, V., et al. 2006a, ApJ, 647, L111
- Belokurov et al. (2006b) Belokurov, V., et al. 2006b, ApJ, submitted (astro-ph/0608448)
- (12) Blecha, A., Cayatte, V., North, P., Royer, F., & Simond, G. 2000, Data-reduction software for GIRAFFE, the VLT medium-resolution multi-object fiber-fed spectrograph, in Optical and IR Telescope Instrumentation and Detectors, ed. I. Masanori, & A. F. Moorwood, SPIE, 4008, 467
- (13) Bosler, T. L., Smecker-Hane, T.‘A., & McWilliam, A. 2004, in ASP Conf. Ser. 274, Observed HR Diagrams and Stellar Evolution, ed. T. Lejeune, & J. Fernandes (San Francisco: ASP), 252
- (14) Bosler, T. L., Smecker-Hane, T. A., & Stetson, P. B. 2006, MNRAS, submitted (astro-ph/0608197) (B06)
- Carigi et al. (2002) Carigi, L., Hernandez, X., & Gilmore, G. 2002, MNRAS, 334, 117
- Carrera et al. (2002) Carrera, R., Aparicio, A., Martínez-Delgado, D., & Alonso-García, J. 2002, AJ, 123, 3199
- Carretta & Gratton (1997) Carretta, E., & Gratton, R. G. 1997, A&AS, 121, 95 (CG)
- Cole et al. (2004) Cole, A. A., Smecker-Hane, T. A., Tolstoy, E., Bosler, T. L., & Gallagher, J. S. 2004, MNRAS, 347, 367
-
Cole et al. (2005)
Cole, A., Tolstoy, E., Gallagher, J.S., & Smecker-Hane, T.A. 2005, AJ, 129, 1465
- (20) Cutri, R. M. 2003, Explanatory Supplement to the 2MASS All-Sky Data Release, http://www.ipac/caltech.edu/2mass/releases/allsky/doc/explsup.html
- (21) Da Costa, G. .S., & Hatzidimitriou, D. 1998, AJ, 115, 1934
- Da Costa et al. (2000) Da Costa, G. S., Armandroff, T. E., Caldwell, N., & Seitzer, P. 2000, AJ, 119, 705
- Demers & Harris (1983) Demers, S., & Harris, W. E. 1983, AJ, 88, 329
- Demers & Irwin (1993) Demers, S., & Irwin, M. J. 1993, MNRAS, 261, 657
- Dolphin (2002) Dolphin, A. E. 2002, MNRAS, 332, 91
- Font et al. (2006) Font, A. S., Johnston, K. V., Bullock, J. S., & Robertson, B. E. 2006, ApJ, 638, 585
- Fukugita et al. (1996) Fukugita, M., Ichikawa, T., Gunn, J. E., Doi, M., Shimasaku, K., & Schneider, D. P. 1996, AJ, 111, 1748
- Fulbright (2002) Fulbright, J. P. 2002, AJ, 123, 404
- Gallagher & Wyse (1994) Gallagher, J. S., III, & Wyse, R. F. G. 1994, PASP, 106, 1225
- Gallagher et al. (2003) Gallagher, J. S., Madsen, G. J., Reynolds, R. J., Grebel, E. K., & Smecker-Hane, T. A. 2003, ApJ, 588, 326
- (31) Gallart, C. 1998, ApJ, 495, L43
- (32) Gallart, C., Freedman, W. L., Aparicio, A., Bertelli, G., & Chiosi, C. 1999, AJ, 118, 2245
- (33) Gallart, C., Zoccali, M., & Aparicio, A. 2005, ARA&A, 43, 387
- Geisler et al. (2005) Geisler, D., Smith, V. V., Wallerstein, G., Gonzalez, G., & Charbonnel, C. 2005, AJ, 129, 1428
- Girardi et al. (2004) Girardi, L., Grebel, E. K., Odenkirchen, M., & Chiosi, C. 2004, A&A, 422, 205
- Grebel et al. (1994) Grebel, E. K., Roberts, W. J., & van de Rydt, F. 1994, in ESO Conference and Workshop Proceedings, The Local Group: Comparative and Global Properties, ed. A. Layden, R. C. Smith, & J. Storm (Garching: ESO), 148
- Grebel (1996) Grebel, E. K. 1996, PASP, 108, 1141
- Grebel (1997) Grebel, E. K. 1997, Reviews of Modern Astronomy, 10, 29
- Grebel (1999) Grebel, E. K. 1999, in IAU Symp. 192, The Stellar Content of the Local Group, ed. P. Whitelock & R. Cannon (San Francisco: ASP), 17
- Grebel (2000) Grebel, E. K. 2000, in 33rd ESLAB Symposium, ESA-SP 445, Star formation from the small to the large scale, ed. F. Favata, A. A. Kaas, & A. Wilson (Noordwijk: ESA), 87
- Grebel et al. (2003) Grebel, E. K., Gallagher, J. S., III, & Harbeck, D. 2003, AJ, 125, 1926
- Grebel & Gallagher (2004) Grebel, E. K., & Gallagher, J. S., III 2004, ApJ, 610, L89
- Grebel et al. (2006) Grebel, E. K., Gallagher, J. S., III, & Harbeck, D. 2006, AJ, submitted
- Harbeck et al. (2001) Harbeck, D., et al. 2001, AJ, 122, 3092
- Harrington & Wilson (1950) Harrington, R. G., & Wilson, A. G. 1950, PASP, 62, 118
- Hartwick (1976) Hartwick, F. D. A. 1976, ApJ, 209, 418
- (47) Held, E. V., Saviane, I., Momany, Y., & Carraro, G. 2000, ApJ, 530, L85
- Hensler et al. (2004) Hensler, G., Theis, C., & Gallagher, J. S., III. 2004, A&A, 426, 25
- Hernandez et al. (2000) Hernandez, X., Gilmore, G., & Valls-Gabaud, D. 2000, MNRAS, 317, 831
- Hill et al. (2000) Hill, V., François, P., Spite, M., Primas, F., & Spite, F. 2000, A&A, 364, L19
- Hurley-Keller et al. (1998) Hurley-Keller, D., Mateo, M., & Nemec, J. 1998, AJ, 115, 1840
- Hurley-Keller et al. (1999) Hurley-Keller, D., Mateo, M., & Grebel, E. K. 1999, ApJ, 523, L25
- Ibata et al. (1994) Ibata, R. A., Gilmore, G., & Irwin, M. J. 1994, Nature, 370, 194
- Ikuta & Arimoto (2002) Ikuta, C., & Arimoto, N. 2002, A&A, 391, 55
- (55) Irwin, M., & Hatzidimitriou, D. 1995, MNRAS, 277, 1354
- (56) Irwin, M., & Lewis, J. 2001, New Ast. Rev., 45, 105
- Jordi et al. (2006) Jordi, K., Grebel, E. K., Ammon, K. 2006, A&A, in press (astro-ph/0609121)
- King (1962) King, I. R 1962, .AJ, 67, 471
- Karaali et al. (2005) Karaali, S., Bilir, S., & Tunçel, S. 2005, PASA, 22, 24
- Klessen et al. (2003) Klessen, R. S., Grebel, E. K., & Harbeck, D. 2003, ApJ, 589, 798
- Kleyna et al. (2001) Kleyna, J. T., Wilkinson, M. I., Evans, N. W., & Gilmore, G. 2001, ApJ, 563, L115
- Koch (2006) Koch, A. 2006, Ph.D. Thesis, University of Basel
- Koch et al. (2006a) Koch, A., Grebel, E. K., Wyse, R. F. G., Kleyna, J. T., Wilkinson, M. I., Harbeck, D. R., Gilmore, G. F., & Evans, N. W. 2006a, AJ, 131, 895 (Paper I)
- Koch et al. (2006b) Koch, A., Grebel, E. K., Wyse, R. F. G., Kleyna, J. T., Wilkinson, M. I., Harbeck, D. R., Gilmore, G. F., & Evans, N. W. 2006b, The ESO Messenger, 123, 38
- Kraft & Ivans (2003) Kraft, R. P., & Ivans, I. I. 2003, PASP, 115, 143
- Landolt (1992) Landolt, A. U. 1992, AJ, 104, 340
- Lanfranchi & Matteucci (2003) Lanfranchi, G. A., & Matteucci, F. 2003, MNRAS, 345, 71
- Lanfranchi & Matteucci (2004) Lanfranchi, G. A., & Matteucci, F. 2004, MNRAS, 351, 1338 (LM04)
- (69) Larson, R. B. 1972, Nat. Phys. Sci., 236, 7
- Layden & Sarajedini (2000) Layden, A. C., & Sarajedini, A. 2000, AJ, 119, 1760
- Lee (1995) Lee, M. G. 1995, AJ, 110, 1155
- (72) Lee, M. G., et al. 2003, AJ, 126, 284
- Lynden-bell (1975) Lynden-Bell, D. 1975, Vistas Astron., 19, 299
- Majewski et al. (1999) Majewski, S. R., Siegel, M. H., Patterson, R. J., & Rood, R. T. 1999, ApJ, 520, L33
- Majewski et al. (2003) Majewski, S. R., Skrutskie, M. F., Weinberg, M. D., & Ostheimer, J. C. 2003, ApJ, 599, 1082
- Martin et al. (2006) Martin, N. F., Ibata, R. A., Irwin, M. J., Chapman, S.,. Lewis, G. F., Ferguson, A. M. N., Tanvir, N., & McConnachie, A. W. 2006, MNRAS, in press (astro-ph/0607472)
- Matteucci (2003) Matteucci, F. 2003, Ap&SS, 284, 539
- Mateoetal (1998) Mateo, M., Olszewski, E. W., Vogt, S. S., & Keane, M. J. 1998, AJ, 116, 2315
- Mateo (1998) Mateo, M. 1998, ARA&A, 36, 425
- McMahon et al. (2001) McMahon, R. G., Walton, N. A., Irwin, M. J., Lewis, J. R., Bunclark, P. S., Jones, D. H. 2001, New Ast. Rev., 45, 97
- McWilliam (1990) McWilliam, A. 1990, ApJS, 74, 1075
- Mighell & Rich (1996) Mighell, K. J., & Rich, R. M. 1996, AJ, 111, 777
- Nordström et al. (2004) Nordström, B., et al. 2004, A&A, 418, 989
- Odenkirchen et al. (2001) Odenkirchen, M., et al. 2001, AJ, 122, 2538
- (85) Pagel, B. E. J. 1997, Nucleosynthesis and chemical evolution of galaxies (Cambridge: Cambridge University Press)
- Pasquini et al. (2002) Pasquini, L., et al. 2002, The ESO Messenger, 110, 1
- Pont et al. (2004) Pont, F., Zinn, R., Gallart, C., Hardy, E., & Winnick, R. 2004, AJ, 127, 840
- Pritzl et al. (2005) Pritzl, B. J., Venn, K. A., & Irwin, M. 2005, AJ, 130, 2140
- (89) Robin, A. C., Reylé, S., Derrière, S., & Picaud, S. 2003, A&A, 409, 523
- Rutledge et al. (1997a) Rutledge, G. A., Hesser, J. E., Stetson, P. B., Mateo, M., Simard, L., Bolte, M., Friel, E. D., & Copin, Y. 1997a, PASP, 109, 883 (R97a)
- Rutledge et al. (1997b) Rutledge, G. A., Hesser, J. E., & Stetson, P. B. 1997b, PASP, 109, 907
- Salaris et al. (1993) Salaris, M., Chieffi, A., & Straniero, O. 1993, ApJ, 414, 580
- Schaye (2005) Schaye, J., & Aguirre, A. 2005, in IAU Symp. 228, From Lithium to Uranium: Elemental Tracers of Early Cosmic Evolution, ed. V.Hill, P. François, & F. Primas, 557
- Shetrone et al. (2001) Shetrone, M. D., Côté, P., & Sargent, W. L. W. 2001, ApJ, 548, 592
- Shetrone et al. (2003) Shetrone, M. D., Venn, K. A., Tolstoy, E., Primas, E., Hill, V., & Kaufer, A. 2003, AJ, 125, 684
- Siegel & Majewski (2000) Siegel, M. H., & Majewski, S. R. 2000, AJ, 120, 284
- Siegel & Majewski (2005) Siegel, M. H., & Majewski, S. R. 2005, AAS, 207, 18814
- Stetson (2000) Stetson, P. B. 2000, PASP, 112, 925
- Stetson et al. (1998) Stetson, P. B., Hesser, J. E., & Smecker-Hane, T. A. 1998, PASP, 110, 533
- Stoughton et al. (2002) Stoughton, C., et al. 2002, AJ, 123, 485
- Suntzeff et al. (1993) Suntzeff, N. B., Mateo, M., Terndrup, D. M., Olszewski, E. W., Geisler, D., & Weller, W. 1993, ApJ, 418, 208
- Swope (1967) Swope, H. H. 1967, PASP, 79, 439
- Tinsley (1975) Tinsley, B. M. 1975, ApJ, 197, 159
- (104) Truran, J., Cameron, 1971, Ap&SS, 14, 179
- Tolstoy et al. (2003) Tolstoy, E., Venn, K. A., Shetrone, M. D., Primas, F., Hill, V., Kaufer, A., & Szeifert, T. 2003, AJ, 125, 707
- Tolstoy et al. (2004) Tolstoy, E., et al. 2004, ApJ, 617, L119
- van den Bergh (1994) van den Bergh, S. 1994, ApJ, 428, 617
- van den Bergh (1999a) van den Bergh, S. 1999a, AJ, 117, 2211
- van den Bergh (1999b) van den Bergh, S. 1999b, A&A Rev., 9, 273
- van den Bergh (2000) van den Bergh, S. 2000, The galaxies of the Local Group, Cambridge Astrophysics Series no. 35, Cambridge University Press
- Vandenberg (2000) Vandenberg, D. A., Swenson, F. J., Rogers, F. K., Iglesias, C. A., & Alexander, D. R. 2000, ApJ, 532, 430
- Venn et al. (2004) Venn, K. A., Irwin, M. I., Shetrone, M. D., Tout, C. A., Hill, V., & Tolstoy, E. 2004, AJ, 128, 1177
- Vogt et al. (1995) Vogt, S. S., Mateo, M., Olszewski, E. W., & Keane, M. J. 1995, AJ, 109, 151
- Wilkinson et al. (2004) Wilkinson, M. I., Kleyna, J. T., Evans, N. W., Gilmore, G. F., Irwin, M. J., & Grebel, E. K. 2004, ApJ, 611, L21
- Wilkinson et al. (2006a) Wilkinson, M. I., Kleyna, J. T., Evans, N. W., Gilmore, G. F., Read, J. I., Koch, A., Grebel, E. K., & Irwin, M. J. 2006a, in EAS Publications Series 20, Mass Profiles and Shapes of Cosmological Structures, ed. G.A. Mamon, F. Combes, C. Deffayet, & B. Fort (Paris: EDP Sciences), 105
- Wilkinson et al. (2006b) Wilkinson, M. I., Kleyna, J. T., Gilmore, G. F., Evans, N. W., Koch, A., Grebel, E. K., Wyse, R. F. G., & Harbeck, D. 2006b, The ESO Messenger, 124, 25
- Willman et al. (2005) Willman, B., et al. 2005, ApJ, 626, L85
- Wyse et al. (2002) Wyse, R. F. G., Gilmore, G., Houdashelt, M. L., Feltzing, S., Hebb, L., Gallagher, J. S., III, & Smecker-Hane, T. A. 2002, NewA, 7, 395
- Wyse et al. (2006) Wyse, R. F. G., Gilmore, G., Norris, J. E., Wilkinson, M. I., Kleyna, J. T., Koch, A., Evans, N. W., & Grebel, E. K. 2006, ApJ, 639, L13
- Zinn & West (1984) Zinn, R., & West, M. J. 1984, ApJS, 55, 45
- Zucker et al. (2004) Zucker, D. B., et al. 2004, ApJ, 612, L121
- Zucker et al. (2006a) Zucker, D. B., et al. 2006a, ApJ, 643, L103
- Zucker et al. (2006b) Zucker, D. B., et al. 2006b, ApJ, submitted (astro-ph/0601599)
- Zucker et al. (2006c) Zucker, D. B., et al. 2006c, ApJ, submitted (astro-ph/0606633)


| Total Exposure Time | ||
|---|---|---|
| Date | Field (Configuration) | [s] |
| 2003 Feb 21 | Center | 1436 |
| 2003 Feb 22 | Center | 18000 |
| 2003 Mar 04 | Center_2 | 18000 |
| 2003 Mar 05 | Offset | 14400 |
| 2004 Feb 21 | 2 (a) | 10800 |
| 2004 Feb 22 | 2 (a) | 3600 |
| 2004 Feb 23 | 2 (a) | 10800 |
| 2004 Feb 24 | 2 (b) | 10020 |
| 2004 Feb 26 | 4 (a) | 18300 |
| 2004 Feb 27 | 4 (b) | 15166 |
| 2004 Feb 28 | 4 (b) | 14700 |
| Field | (J2000.0) | (J2000.0) |
|---|---|---|
| Center | 11 13 23.9 | 22 14 33 |
| Center_2 | 11 13 32.8 | 22 06 30 |
| Offset | 11 12 42.6 | 22 02 21 |
| 2 | 11 13 36.2 | 22 11 08 |
| 4 | 11 12 45.9 | 21 58 35 |
| Star | (J2000) | (J2000) | r [] | V | g | g | g | W’ [Å] | [Fe/H]CG | Age [Gyr] |
|---|---|---|---|---|---|---|---|---|---|---|
| T_11 | 11 13 12.2 | 22 16 09 | 8.83 | 20.72 | 21.17 | 0.75 | 1.11 | 1.42 0.18 | 2.25 0.12 | 15.8 |
| T_13 | 11 13 35.8 | 22 09 35 | 1.84 | 18.69 | 19.43 | 1.22 | 1.74 | 2.69 0.32 | 1.71 0.18 | 6.3 |
| T_16 | 11 13 13.9 | 22 08 50 | 3.32 | 19.06 | 19.72 | 1.09 | 1.57 | 1.97 0.30 | 2.01 0.16 | 8.0 |
| T_19 | 11 13 23.0 | 22 09 23 | 1.21 | 19.08 | 19.76 | 1.12 | 1.55 | 2.99 0.30 | 1.58 0.17 | 8.5 |
| T_21 | 11 13 22.7 | 22 08 09 | 1.71 | 19.19 | 19.90 | 1.17 | 1.64 | 2.19 0.28 | 1.92 0.16 | … |
Note. — This Table is published in its entirety in the electronic edition of the Astronomical Journal. A portion is shown here for guidance regarding its form and content. and W’ denote the elliptical radius and the reduced CaT width. Colors are given in the photometric system of the SDSS. [Fe/H] and the respective uncertainty are given following eq. 7.