Deep XMM-Newton and Chandra observations of ClJ1226.93332: A detailed X-ray mass analysis of a galaxy cluster.
Abstract
Deep XMM-Newton and Chandra observations of ClJ1226.93332 at have enabled the most detailed X-ray mass analysis of any such high-redshift galaxy cluster. The XMM-Newton temperature profile of the system shows no sign of central cooling, with a hot core and a radially declining profile. A temperature map shows asymmetry with a hot region that appears to be associated with a subclump of galaxies at the cluster redshift, but is not visible in the X-ray surface brightness. This is likely to be result of a merger event in the cluster, but does not appear to significantly affect the overall temperature profile. The XMM-Newton temperature profile, and combined Chandra and XMM-Newton emissivity profile allowed precise measurements of the global properties of ClJ1226.93332; we find , , and . We obtain profiles of the metallicity, entropy, cooling time and gas fraction, and find a high concentration parameter for the total density profile of the system. The global properties are compared with the local and relations, and we are able to make the first observational test of the predicted evolution of the relation. We find that departures from these scaling relations are most likely caused by an underestimate of the total mass by in the X-ray hydrostatic mass analysis due to the apparent recent or ongoing merger activity.
Subject headings:
cosmology: observations – galaxies: clusters: individual: (ClJ1226.93332) – galaxies: clusters: general – galaxies: high-redshift galaxies: clusters – intergalactic medium – X-rays: galaxies1. Introduction
Clusters of galaxies are an important tool for testing and improving cosmological models. High-redshift clusters, in particular, provide the strongest constraints. Measurements of the total and baryonic mass functions, and baryon fractions of distant clusters have been used to measure cosmological parameters (e.g. Vikhlinin et al., 2003; Henry, 2004; Allen et al., 2004). Even with the precise measurements of cosmological parameters provided by cosmic microwave background and supernova observations (e.g. Spergel et al., 2003; Tonry et al., 2003), clusters play an important role by providing independent constraints with different parameter degeneracies (Allen et al., 2004). Large samples of distant clusters detected in planned X-ray and Sunyaev-Zel’dovich effect (SZE) surveys will be able to place strong constraints on the dark energy density and equation of state, but the most powerful constraints require mass estimates for many clusters (Majumdar & Mohr, 2003).
The most reliable X-ray mass estimates require radial temperature and density profiles of the intra-cluster gas to allow the solution of the equation of hydrostatic equilibrium. However, the low X-ray fluxes of typical high-redshift clusters make the observing time needed to meet these requirements prohibitive. Sufficiently deep observations for clusters at are very rare (e.g. Jeltema et al., 2001; Arnaud et al., 2002; Donahue et al., 2003; Maughan et al., 2004); for most clusters at high redshifts, masses must be estimated from observed global properties such as X-ray luminosity and temperature. The scaling relations between cluster properties at high redshifts are then of key importance, and their uncertainty is a dominant contributor to the error budget of derived cosmological parameters (Henry, 2004). Furthermore, studies of the evolution of the cluster scaling relations can be used to probe cluster formation and the history of non-gravitational heating (e.g. Ettori et al., 2003; Maughan et al., 2006).
At , galaxy cluster ClJ1226.93332 is the hottest, most luminous known at .111Comparisons here are made with all clusters listed in the BAX database (http://bax.ast.obs-mip.fr), a compilation of published X-ray properties of galaxy clusters The only comparable system is MS1054.50321 at , an actively merging system which is somewhat cooler and less luminous than ClJ1226.93332 (Jee et al., 2005). Unlike that very disturbed system, ClJ1226.93332 has a relaxed morphology, making it a promising candidate for a reliable hydrostatic mass estimate. ClJ1226.93332 was detected in the Wide Angle ROSAT Pointed Survey (WARPS Scharf et al., 1997; Ebeling et al., 2001) and an analysis of a AO1 XMM-Newton observation confirmed its temperature at with a bolometric luminosity of and a relaxed morphology (Maughan et al., 2004). An early, short Chandra observation of ClJ1226.93332 was presented by Cagnoni et al. (2001), who also pointed out that the VLA FIRST catalogue shows a faint point-like radio source at the cluster centre, consistent with a low-luminosity radio-loud AGN. ClJ1226.93332 has also been detected in the SZE (Joy et al., 2001) and the properties of the member galaxies have been investigated (Ellis & Jones, 2004; Ellis et al., 2006).
In this paper we present new XMM-Newton and Chandra observations of ClJ1226.93332. In the following sections we describe the data reduction and background subtraction techniques, and present the results of the imaging and spectral analysis. The radial profiles of the clusters properties such as mass, temperature and entropy are then investigated and the global properties of the system are compared with those of other clusters. In the appendix we present a novel method for defining contour levels in smoothed X-ray images. Numerical subscripts are used on cluster properties to indicate the overdensity with respect to the critical density at the radius at which (or within which) the property was measured. The critical density at the cluster’s redshift is used in this definition. We assume a flat CDM cosmology with and throughout, and uncertainties are quoted at the level.
2. Data Reduction
The XMM-Newton data (ObsID 0200340101) were reduced and analysed with the Science Analysis Software (SAS) version 6.5, and the most recent calibration products available as of 15 November 3005. A lightcurve of the field of view was produced in the band for each of the three EPIC cameras. The lightcurves were filtered to reject periods of high background, and approximately of data were rejected. The cleaned lightcurves exhibited stable mean count rates and the clean exposure times were and for the PN and MOS detectors respectively. A local background region, and the Read & Ponman (2003) blank-sky background datasets were used for background estimates where appropriate, as discussed below.
The Chandra data consisted of two ACIS-I observations (ObsID 3180 and 5014) which were were reduced and analysed consistently. The level 1 events files were reprocessed with the latest calibration (as of November 2005), applying the charge-transfer inefficiency and time-dependent gain corrections. Background flare filtering was performed with lc_clean in the band excluding the target CCD, and all sources detected by the pipeline processing. The good time remaining for each observation was . The period D blank-sky background files (Markevitch, 2001) were appropriate for both observations, and these were reprojected onto the sky coordinates of each observation. Both observations were taken in VFAINT telemetry mode, so the additional VFAINT cleaning procedure was applied to the source and background datasets222http://asc.harvard.edu/ciao/threads/aciscleanvf.
3. Background Considerations
In periods free of background flaring, the background is dominated by X-rays at low energies () and particles at high energies (). The X-ray component includes a significant contribution from Galactic emission which varies with position on the sky. The blank-sky background datasets are compiled from multiple pointings with different Galactic X-ray fluxes, so may not agree well with the soft X-ray background in the source dataset. However, the blank-sky datasets enable background estimates to be made at the same detector position as the source, eliminating instrumental effects, and furthermore, many extended sources fill the field of view of Chandra or XMM-Newton prohibiting the measurement of the background in the source dataset. Due to its high redshift, ClJ1226.93332 occupies a small area on the detectors, leaving large source-free regions in which the background emission can be measured. This local background was compared with the blank-sky files to determine the optimal choice of background for imaging and spectral analyses.
Images were created in the band for each detector, along with exposure maps to correct for chip gaps, bad pixels, and telescope vignetting. The three XMM-Newton PN and MOS images and the two Chandra ACIS-I images were combined to give separate XMM-Newton and Chandra images, and these were exposure corrected. Background images and exposure maps were created in the same way from the blank-sky datasets for each detector. Sources in these images were then detected with the wavelet detection algorithm of Vikhlinin et al. (1998). The detected point and extended sources were then excluded from the analysis of ClJ1226.93332.
Due to the possible difference in the soft Galactic X-ray flux between the source and background datasets, the blank-sky images were normalised to match the flux in the source-free regions in the target images. For both the XMM-Newton and Chandra images, radial profiles of the source and background images and their exposure maps were created and used to determine the detection radius () of the cluster emission. Emission within was then excluded and the background images were normalised to the remaining emission. The detection radius was the recomputed and the process was repeated until converged. This procedure provides a reliable measurement of both the cluster extent and the normalisation of the blank-sky images in the imaging band.
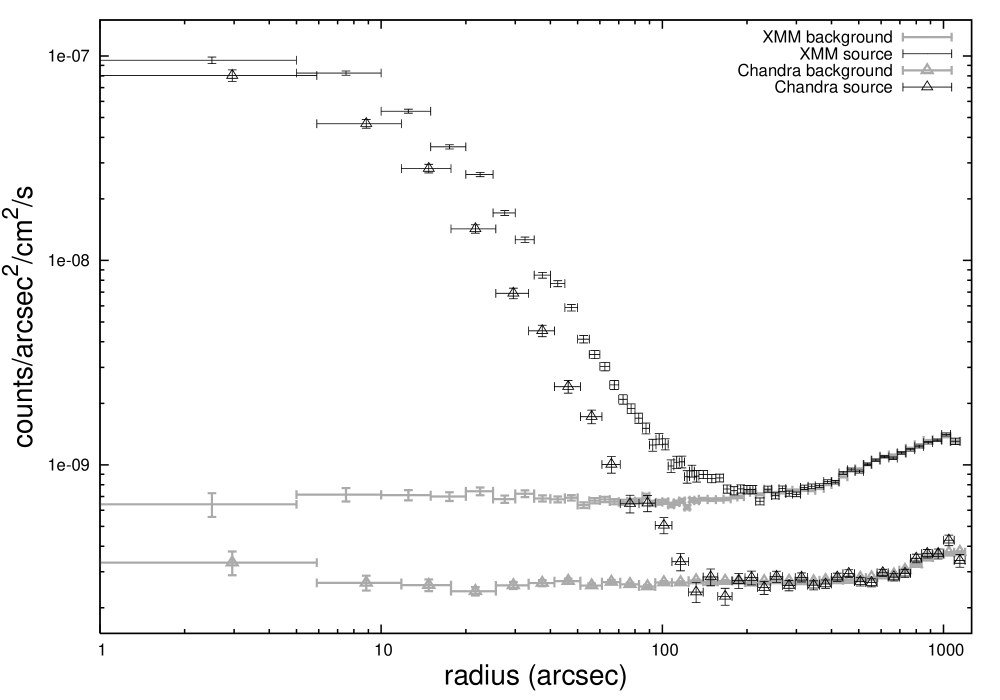
Fig. 1 shows the source and background profiles for the XMM-Newton and Chandra images. The good agreement of the source and background profiles at indicates that the source exclusion and background normalisation were successful. Note that the increasing background with radius (most noticeable in the XMM-Newton data) is due to the fact that the particle background component is not vignetted, so the exposure correction incorrectly boosts this background component. In this imaging analysis, the effect is the same in the source and background images and cancels out. However, this effect is a cause for concern if an off-axis region is used to extract a local background spectrum. These normalised blank-sky background images were thus used for all of the imaging analysis for all datasets, while the background subtraction for the spectral analysis is discussed in more detail below. The consistency of the XMM-Newton and Chandra surface brightness profiles of ClJ1226.93332 is demonstrated in section §6.1.
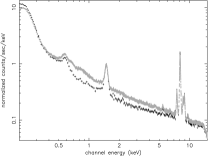
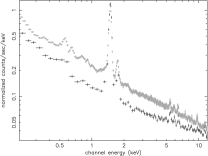
A prime motivation in defining was to fully exclude any significant cluster emission to enable to measurement of the background in the target observations. To this end was conservatively defined as the radius beyond which no further radial bins had a detection of above the background. The detection radius for XMM-Newton was and for Chandra was . For each detector, spectra were extracted from the target datasets after excluding all sources, and the cluster emission out to , to give a local background spectrum. Blank sky background spectra were extracted for each detector with the same spatial regions excluded, and the local and blank sky background spectra are plotted in Fig. 2.
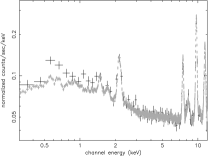
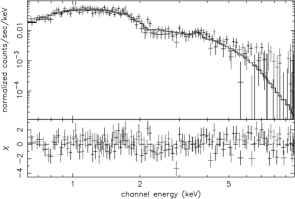
The Chandra blank-sky background spectra were normalised to match the count rates in the target datasets. At these high energies, the background is dominated by particle events. The left panel of Fig. 2 shows the background spectra for the Chandra ObsID 3180 observation (ObsID 5014 is consistent). The good agreement between the spectra above indicates that relative contributions of the particle and X-ray background components is the same in the target and blank-sky datasets. The excess in the local background at the soft end is due to Galactic X-ray emission. These soft residuals are accounted for in our spectral analysis of the Chandra data by including a model for this soft thermal component (see §5). We conclude that the blank-sky background files provide a reliable background measurement for the Chandra datasets.
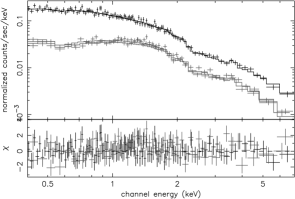
The XMM-Newton blank-sky background spectra were normalised by the ratio of the count rates of events detected outside the field of view of the XMM-Newton telescopes. These events are due solely to the particle background. It is clear in the centre and right panels of Fig. 2 that the flux in the particle-induced fluorescent lines agrees well in the target and blank-sky spectra, but the flux elsewhere is significantly lower in the local background spectra. This suggests that the relative contribution of the particle background component is significantly greater in the target dataset. A similar effect has been found in other XMM-Newton observations (Maughan et al., 2006; Khosroshahi et al., 2006), and we emphasise the importance of comparing the blank-sky and local background spectra whenever possible. A possible resolution to this discrepancy would be to normalise the spectra by the count rate in the band, but this would lead to an underestimate of the flux in the fluorescent lines. Furthermore, the slopes of the of the spectra are different due to the differing particle background contributions. We thus conclude that the blank-sky datasets cannot be used for the spectral analysis of this XMM-Newton observation. Instead, we define a local background annulus region between .
This local background region lies further off-axis than the cluster emission, so the vignetting of the background photons must be considered. Vignetting effects were corrected by using the SAS task evigweight. This assigns a weight to every event based on the ratio of the effective area at its detected position and energy, to the effective area on-axis at the same energy. This procedure can not distinguish between vignetted X-rays, and non-vignetted particle events, leading to the incorrect boosting of the particle background. Fig. 1 demonstrates that this is already a significant effect by .
For a given source region, this effect can be removed with the aid of the XMM-Newton closed filter background datasets which consist of purely instrumental and particle events. A “boosted-particle” spectrum was created for each camera by running evigweight on the closed filter background and extracting a spectrum from the local background region. This replicates the treatment of the particle events in the source dataset. These boosted-particle spectra were then normalised to the count rate in the local background spectra and subtracted from them, creating a vignetting-corrected “X-ray only” background spectrum. A similar boosted-particle spectrum was then extracted from the source region in the closed filter data, normalised by the same factor and added onto the “X-ray only” background spectrum (after scaling by area). The resultant background spectrum then consisted of an X-ray background that was correctly weighted for the vignetting at the background region, and a particle component that was incorrectly weighted in exactly the same way as the particles in the source spectrum. The net effect is that the particle and X-ray backgrounds are both subtracted correctly. This has a significant effect on the temperatures measured at large radii where the background dominates, and this method was followed for all XMM-Newton spectral analysis.
4. Cluster Morphology
The exposure corrected Chandra and XMM-Newton images of ClJ1226.93332 were smoothed to the level using the adaptive smoothing algorithm of Ebeling et al. (2006). Contours were then derived from the smoothed images at flux levels defined so that the emission in the region between two adjacent contour levels was detected at above the emission in the next lowest band. This contouring algorithm is described in detail in Appendix A and allows the significance of features in contour plots to be determined easily by eye.
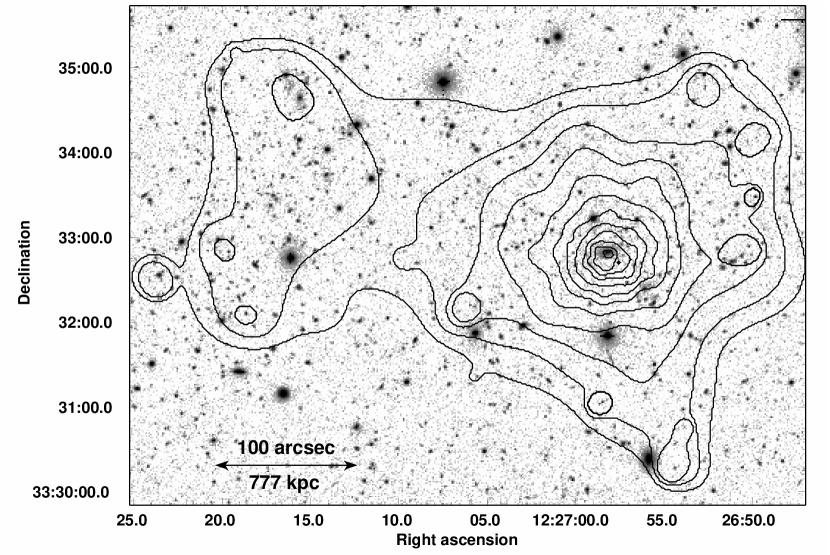
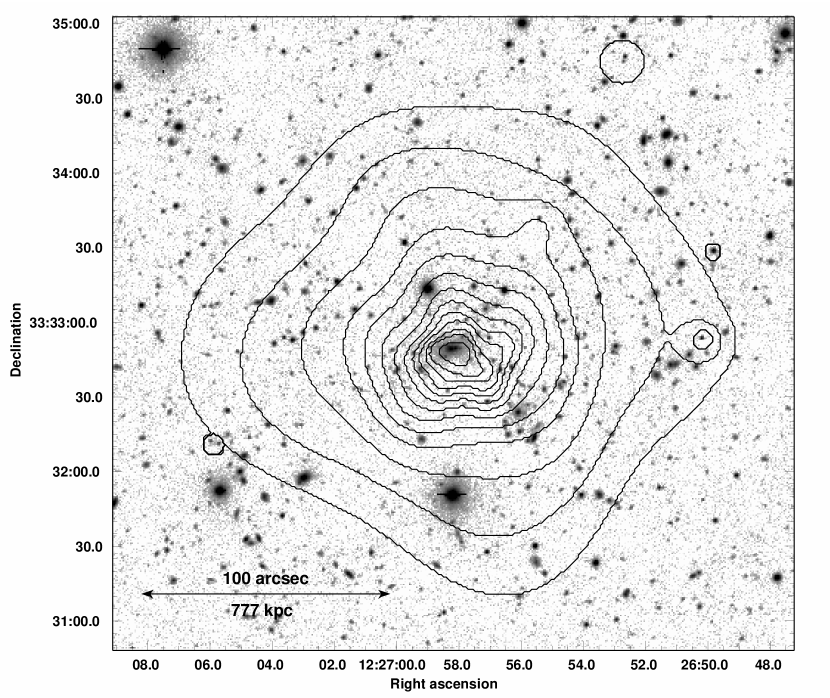
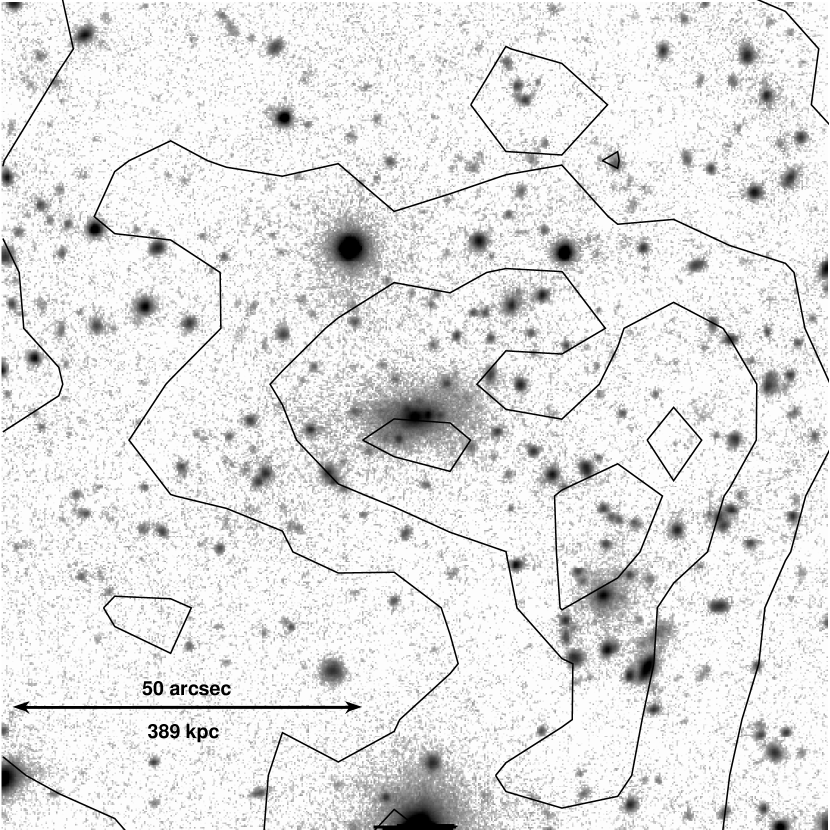
Fig. 3 shows a wide field view of ClJ1226.93332 with XMM-Newton contours overlaid on a Keck-II I band image. The image is dominated by the bright, circular ClJ1226.93332 in the western half, but the foreground cluster ClJ1227.33333 is visible in the eastern half of the image. ClJ1227.33333 appears unrelaxed and consists of several sub-clumps of galaxies at a similar spectroscopic redshift (). All of the sources seen in the contours are consistent with point sources except for the northern peak of ClJ1227.33333 and ClJ1226.93332. Fig. 4 shows the Chandra contours of ClJ1226.93332 on the same optical image. These contours demonstrate the regular, relaxed appearance of the emission in ClJ1226.93332.
5. Spectral Analysis
5.1. Methodology
Before discussing the different spectral analyses performed, we give an overview of the spectral extraction and fitting methods used for the XMM-Newton and Chandra data. In all cases, responses were generated for the spectral extraction regions, weighted by the distribution of counts in the region. Cluster spectra were modelled in XSPEC with a single temperature, APEC (Smith et al., 2001) plasma model, and with the exception of the MOS data as noted below, the absorbing column was fixed at the Galactic value inferred from observations (Dickey & Lockman, 1990). During fitting, the APEC normalisation, metal abundance and temperature were the only free parameters. When data from multiple detectors were fit simultaneously, the temperature and metal abundances of the models were tied, but the normalisations were not.
For the XMM-Newton data, only the best-calibrated events (FLAG=0) were selected, and the modified local background spectra discussed in §3 were used for each detector. The MOS and PN spectra were fit in the energy bands, avoiding the bright fluorescent lines above in the PN and minimising any remaining problems with the particle background subtraction.
For the Chandra data, the background spectra were taken from the blank sky datasets. A spectrum of the soft residuals due to Galactic X-ray emission differences between the target and blank-sky datasets was produced for each dataset by subtracting a blank-sky background spectrum from a local background spectrum extracted in the same region. This was fit with a , unabsorbed APEC model of zero redshift (Vikhlinin et al., 2005). This model was included as an additional background component in all spectral fits, with the normalisation scaled by the difference in extraction area. The cluster spectrum was fit by an absorbed APEC model in the and the best fitting temperature was found. The model was refit with the soft Galactic component normalisation set to and again with the overall blank-sky background renormalised by , and the resulting systematic temperature uncertainties were added in quadrature to the statistical uncertainties.
5.2. Cross-calibration
In order to test the spectral calibration of the different detectors before combining their data, a single spectrum was extracted from for each detector. Selecting only the central cluster region in this way maximised the signal to noise ratio of the spectra, reducing the uncertainties due to the background subtraction. No point sources were detected within this region by either Chandra or XMM-Newton. To further simplify the comparison, the metal abundances were fixed at . The spectra were fit separately and simultaneously in different combinations, and example spectra are plotted in Fig. 5.
The results of the spectral fitting are summarised in Fig. 6. The solid points show that the temperatures measured with EPIC MOS were significantly higher than the PN measurements; the confidence intervals do not overlap. The absorbing column was then allowed to vary, and the agreement in was improved dramatically. The best fitting PN absorbing column did not vary significantly from the Galactic value () and the PN temperature was unchanged. In the case of the combined MOS spectra, however, the best-fitting absorption was significantly higher than the Galactic value at ( errors) and the temperature was significantly reduced. The absorbing columns found when fitting the MOS data independently of each other were also consistent with this value. All of these spectral fits were statistically acceptable, whether the absorbing column was fixed or varying.
The hollow points in Fig. 6 show the temperatures measured when the absorbing column was fixed at for the MOS data; all EPIC measurements agree well. The statistical precision of the ACIS measurements, meanwhile, cannot exclude any of the XMM-Newton measurements. The fact that the MOS fits require an absorbing column significantly higher than Galactic suggests that there is an outstanding calibration problem with those detectors, and that the PN temperature should be more reliable. In all further spectral fits, the absorbing column was frozen at the Galactic value for the PN and at for the MOS data. The variation in the best-fitting temperature caused by setting the MOS absorbing column to its limits was taken as an indication of the additional systematic uncertainty due to this problem. This uncertainty was added in quadrature to the statistical errors on all subsequent temperature measurements, resulting in an increase of . Finally, we note that consistent temperatures and uncertainties were found using the combined EPIC data if energies below were ignored in the MOS spectra.

5.3. Spectral Profiles
The XMM-Newton observation of ClJ1226.93332 is sufficiently deep to provide radial profiles of its spectral properties. Spectra were extracted from annuli centred on the X-ray centroid (with point sources excluded), and were fit as before. The resulting projected temperature profile is plotted in Fig. 7. The data from the three EPIC camera were fit simultaneously for these results, with the temperatures tied, the PN absorbing column frozen at the Galactic value, and the MOS absobing column at
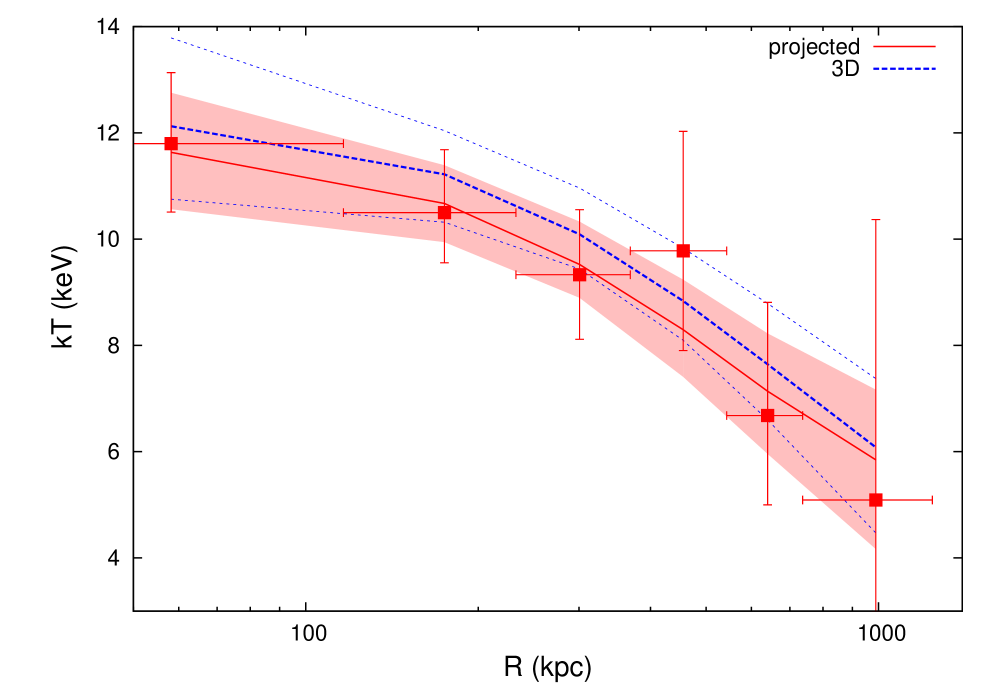
To model the temperature profile of ClJ1226.93332 we follow the method of Vikhlinin et al. (2006, V06) of projecting a model of the three-dimensional (3D) temperature distribution along the line of sight, and fitting that to the observed projected temperature profile. In doing this we use the algorithm of Vikhlinin (2006) to predict the observed temperature for the combination of temperatures and emissivities of gas along the line of sight in each bin. The emissivities were determined from our analysis of the gas density profile (§6.1), and the metal abundance of the gas was set at at all radii (varying the metal abundance had negligible effect on this analysis, which is reasonable, as the emission is continuum dominated at these high temperatures). The temperature profile model of V06 was used to model the 3D temperature distribution:
| (1) |
This model was simplified slightly to reduce the number of free parameters by fixing and , in line with the average profile found by V06 in a sample of relaxed nearby clusters. The best fitting 3D model had , , , , , and , and the model and its projection are plotted in Fig. 7. This model has as many degrees of freedom as datapoints in the profile, and has degeneracies between parameters, so the uncertainties on all dependent quantities were computed by a Monte-Carlo method. A simpler model
| (2) |
was also fit to the data, giving , and . While the V06 model was used for all results quoted subsequently, this simpler model gave consistent results and uncertainties throughout.
This method of modelling the temperature profile does not take the effect of the XMM-Newton PSF into account. As the surface brightness profile of ClJ1226.93332 is not sharply peaked and the temperature profile bins are all (the approximate FWHM of the PSF), the mixing effect of the PSF on the temperature profile is not expected to be large. This was verified by fitting the spectra from all radial bins simultaneously with absorbed APEC models, using the xmmpsf model in XSPEC to model the redistribution of photons by the XMM-Newton PSF. The resulting PSF-corrected temperature profile was consistent with the original profile, with the noise fluctuations amplified and large uncertainties. The original uncorrected temperature profile was used for all further analysis.
The projected metal abundance profile of ClJ1226.93332 is plotted in Fig 8. The statistical uncertainties on the metal abundance measurements are large due to the high ionisation state of the plasma. The data suggest a radially decreasing abundance profile but are also consistent with a flat abundance profile.

5.4. Temperature map
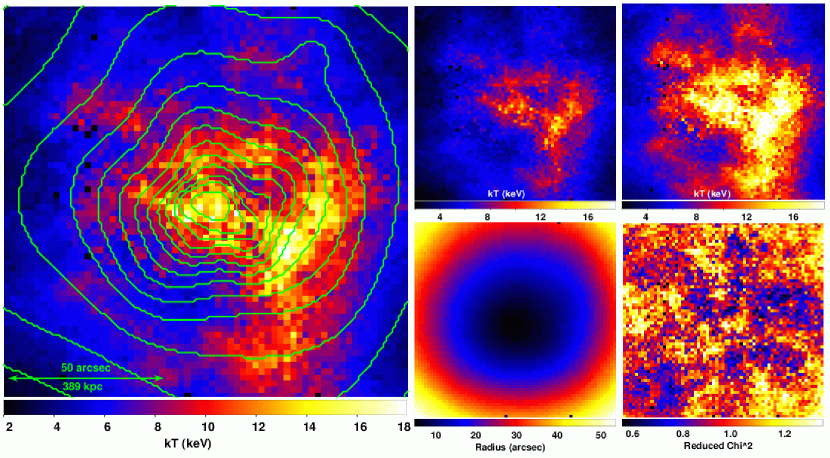
The two dimensional projected temperature distribution in ClJ1226.93332 was investigated by constructing a temperature map following the methods described in Maughan et al. (2006, see also ()). In brief, spectra were extracted from many overlapping circular regions in the cluster, the radii of which were chosen to contain at least net photons. The best fitting temperature for the spectrum from each region was assigned to the pixel in the temperature map corresponding to the centre of that region. The result is a smooth image of the projected temperatures, in which nearby pixels are not independent. The spectra were fit as before, but the metal abundance was fixed at .
The resulting projected temperature map is shown in Fig. 9. The temperature structure shows asymmetry that is not apparent in the surface brightness distribution. There is significantly hotter emission to the west and south west of the cluster core than the surrounding gas at the same radius. Fig. 10 shows contours of the X-ray temperature overlaid on the optical image. The region of hotter emission appears associated with an overdensity of galaxies (confirmed cluster members) to the south west of the core, suggesting that a merger event may be responsible for the temperature asymmetry.
A new temperature profile was produced, with the sector containing these hotter regions excluded, and the temperatures obtained were not significantly different from those measured with the sector included. This indicates that this hot region does not significantly bias our temperature profile measurement. However, if it is related to merger activity in the cluster, this will undermine the assumption of hydrostatic equilibrium used in the following mass analysis of ClJ1226.93332.
6. Mass Analysis
6.1. Gas density profile
The X-ray emissivity of the intra-cluster medium depends strongly on the gas density and only weakly on its temperature. This means that the observed projected emissivity profile can be used to accurately measure the gas density profile. For each annular bin in the surface brightness profile, the observed net count rate was corrected for area lost to chip gaps, bad pixels and excluded regions, and converted to an integrated emission measure. For each bin, the conversion factor was calculated assuming an absorbed MeKaL (Kaastra & Mewe, 1993) plasma model folded through an ARF generated for that region, and an on-axis RMF. The absorption of the spectral model was set at the galactic value and the metal abundance was set at . The temperature of the spectral model in each bin was given by the best-fitting 3D temperature model. We note that the dependence of the conversion from count rate to emission measure on the assumed temperature is weak; this analysis was repeated assuming the cluster was isothermal for the purpose of deriving the emission measures, and the results were not significantly changed.
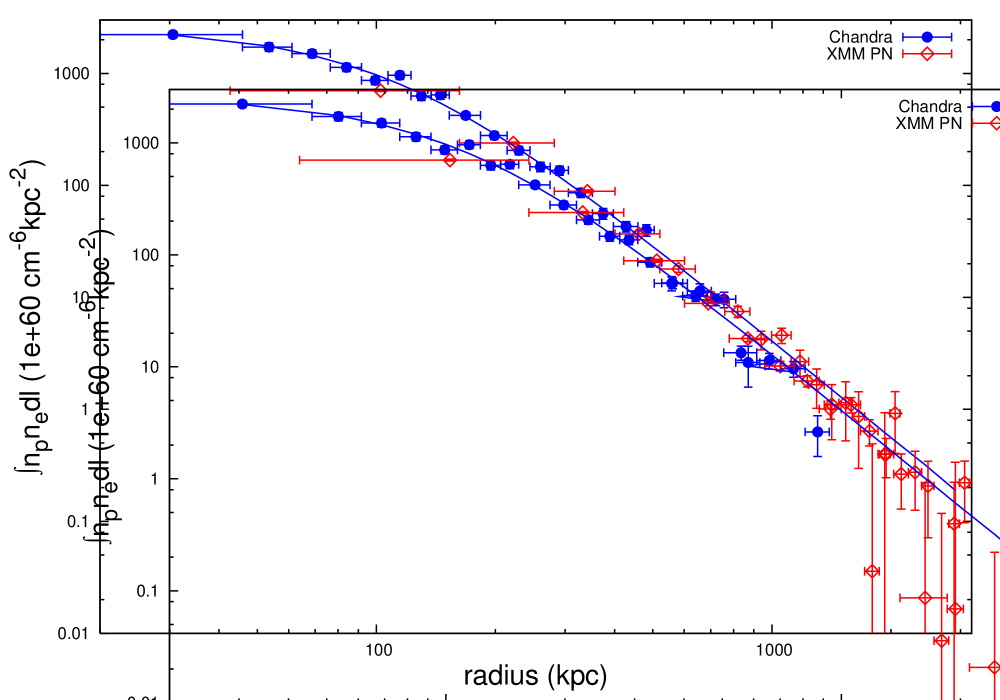
Projected emission measure profiles were derived from the ACIS and PN data in this way, and are plotted in Fig. 11. The radial bins were set to a minimum width of for the PN profile, to minimise the effect of the XMM-Newton PSF, and the profiles agree very well. The MOS data were omitted here for simplicity, as the PN data alone were sufficient to extend the profile beyond the range of the temperature profile, which is the limiting factor in the mass analysis.
To model the emissivity profile, we used the modified -profile used by V06 to describe the emission measure profile of the gas in nearby relaxed clusters;
| (3) |
This model can describe a steep core component and any steepening of the data beyond the standard -profile at large radii. A additive core component has been removed from the V06 model here as it was not required by the data. This emission measure model was then projected along the line of sight and fit to the observed projected emission measure profile. The model was fit to the Chandra and XMM-Newton PN data simultaneously, with the PN data within excluded to minimise PSF effects. The best fitting model is plotted in Fig. 11. The gas density is then related to the emission measure by , assuming a cosmic plasma with helium abundances given by Anders & Grevesse (1989). For comparison with other work, the profile was also fit with a standard -model, and the best-fitting parameters were and .
6.2. Mass profiles
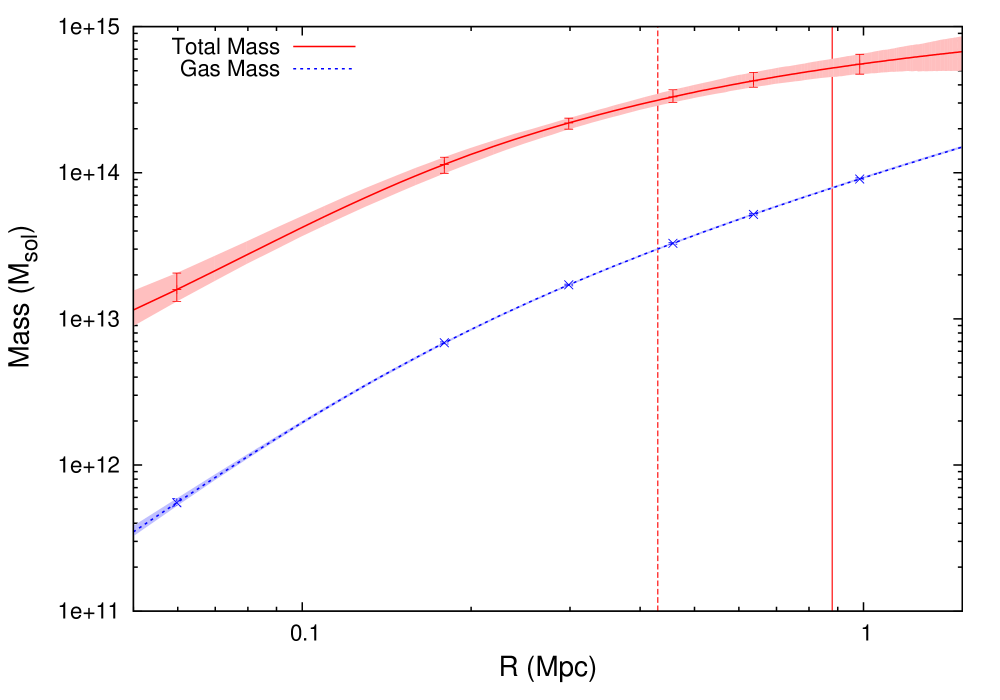
The 3D models of the gas density and temperature distributions enable the total gravitating mass of ClJ1226.93332 to be derived under the assumptions of spherical symmetry and hydrostatic equilibrium. Fig. 12 shows the total and gas mass profiles of ClJ1226.93332 with the shaded regions indicating the uncertainties. The error analysis was performed by producing 1000 randomisations of the observed temperature and emission measure profiles based on their measurement uncertainties. The full analysis was repeated for each randomisation, and the percentiles of the distribution about the value determined from the non-randomised data gave the uncertainties on each parameter.
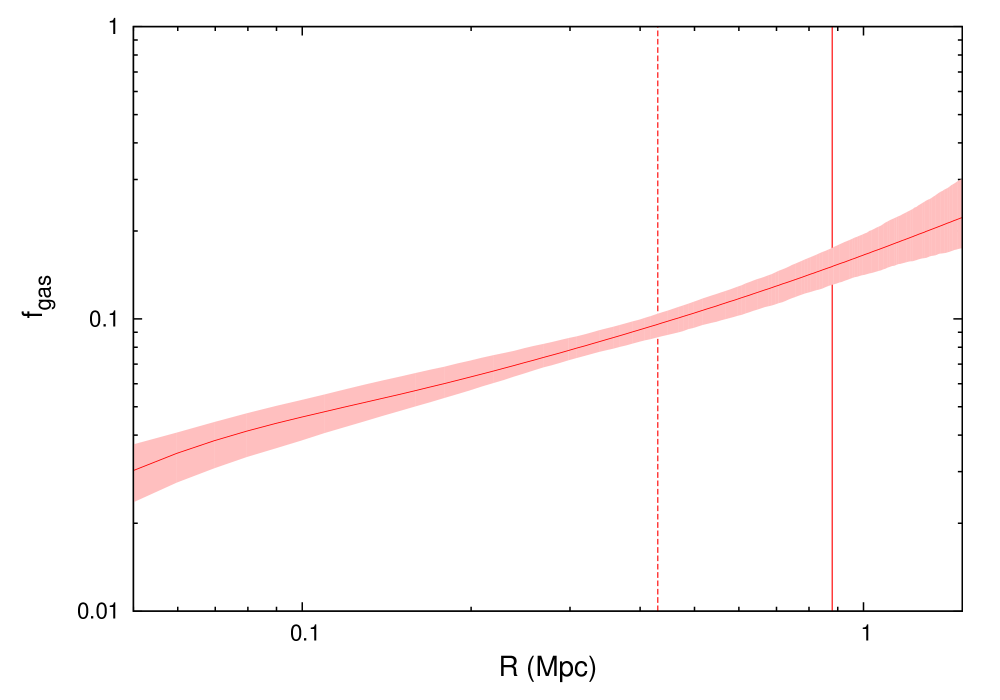
The enclosed gas mass fraction () profile of ClJ1226.93332 was also computed, and the resulting profile is plotted in Fig. 13. The profile increases out to , which is consistent with the profiles measured by V06 for local clusters, but contrasts with the findings of Allen et al. (2004) that profiles tend to a universal value at around (although with some variation between clusters). The latter work used Chandra observations of sample of clusters including ClJ1226.93332; the value of we find for ClJ1226.93332 at is consistent with that measured by Allen et al. (2004).
7. Entropy and cooling time profiles
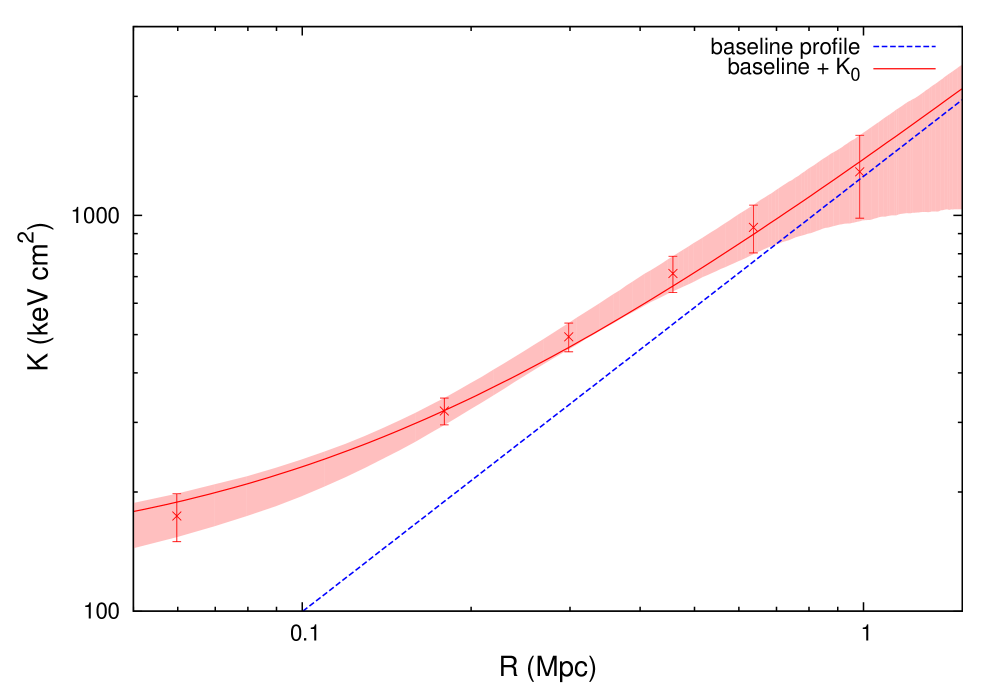
The entropy () of the intra-cluster gas can give useful insight into its energetics (e.g. Ponman et al., 1999; Voit & Donahue, 2005). The entropy profile of ClJ1226.93332 was derived from the 3D temperature and gas density models according to the definition and is plotted in Fig. 14. In order to model this entropy profile, we started with the baseline entropy profile due to gravitational effects alone, derived from numerical simulations by Voit et al. (2005); . was estimated following the method suggested by Voit et al. (2005), with
| (4) |
where gives the redshift-variation of the Hubble parameter and was estimated from the mass within via . For ClJ1226.93332 was found to be by extrapolating the mass profile model to , and hence . The baseline entropy profile is plotted in Fig. 14 and is clearly not a good description of the data. The data suggest a large entropy excess above the gravitational baseline in the central regions of ClJ1226.93332. To model this, a constant entropy level () was added to the baseline model to give
| (5) |
This model was fit to the entropy values measured at the midpoints of the 6 temperature bins of ClJ1226.93332. The best fitting model had and is plotted in Fig. 14. The model is a good description of the data () and a significant improvement on the baseline model alone. Donahue et al. (2006) used a similar model to fit entropy profiles in nearby cooling flow clusters, and the central entropy level is significantly higher in ClJ1226.93332 than the values of found by Donahue et al. (2006). This is consistent with the high central temperature and lack of cool core in ClJ1226.93332, and is likely a result of the suspected merger activity in the system.
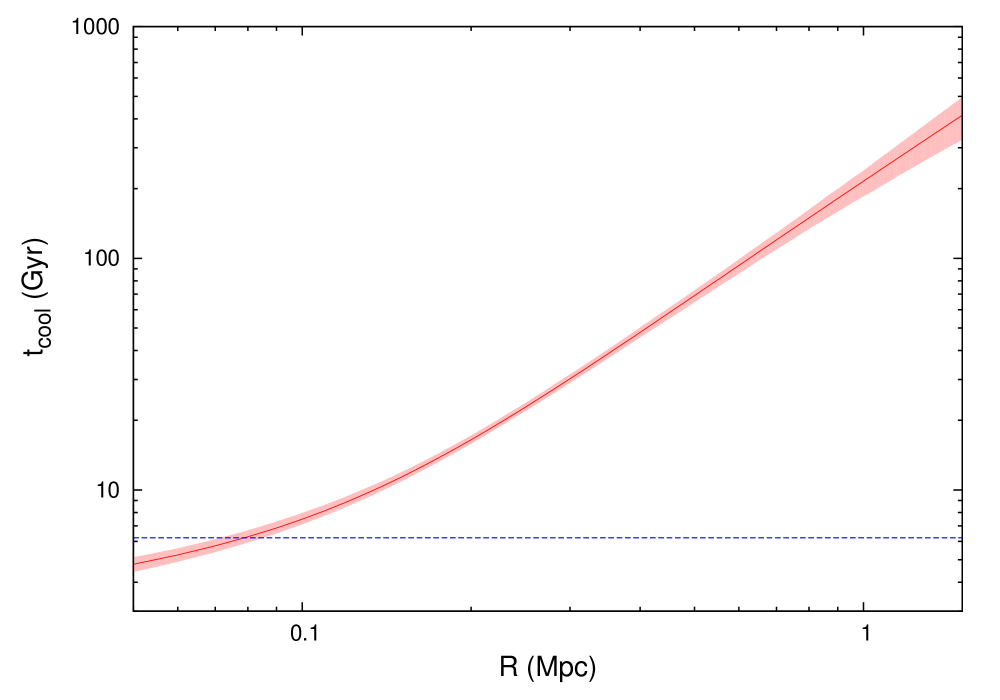
The 3D gas density and temperature profiles enable the cooling time profile of ClJ1226.93332 to be computed, using the relation
| (6) |
(Sarazin, 1986). The resulting profile is plotted in Fig. 15 along with the Hubble time at , and shows that the gas in the central regions of ClJ1226.93332 would take to radiate its thermal energy away. This combined with possibility of a recent merger event (implied by the asymmetry in the temperature map and galaxy distribution) make the absence of cool gas in the core of this system unsurprising. As pointed out by Cagnoni et al. (2001) there is a faint point-like radio source at the centre of ClJ1226.93332, consistent with a low-luminosity radio-loud AGN. This is also a candidate for energy input into the cluster core at some point in the past.
8. Discussion
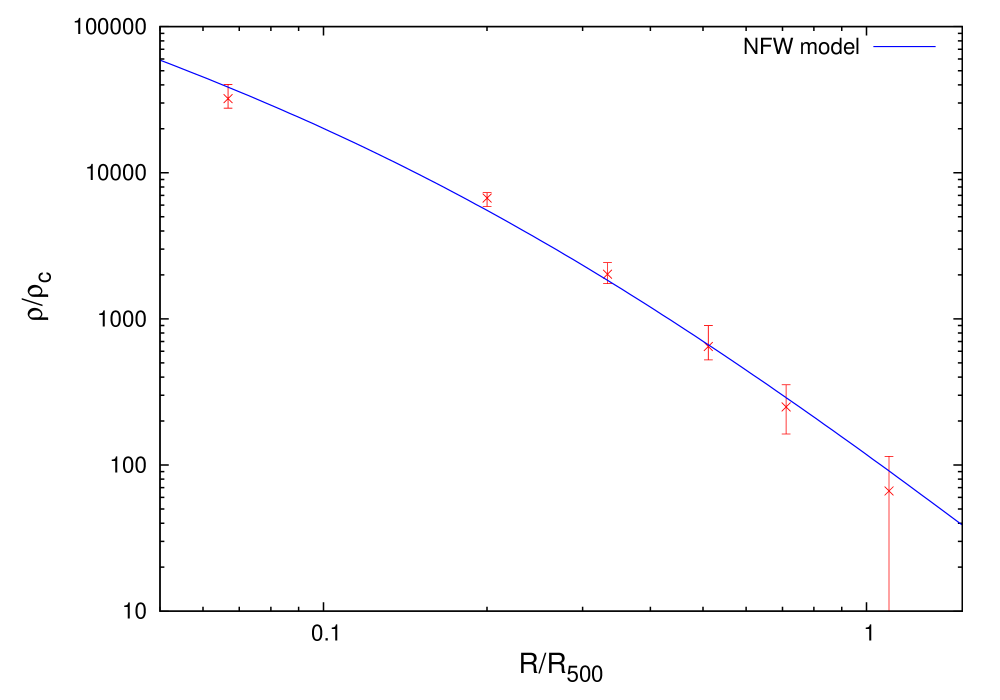
The deep XMM-Newton observation of ClJ1226.93332 has enabled a uniquely detailed mass analysis of a galaxy cluster. This allows comparison with theoretical density profiles for the first time at such high redshift. A profile was constructed using the densities calculated at the midpoint of each temperature profile bin, with uncertainties derived from the Monte-Carlo realisations. These data points were fit by a Navarro et al. (1996, 1997, NFW) profile:
| (7) |
where the normalisation can be expressed in terms of the halo concentration , and the overdensity factor of interest :
| (8) |
The scale radius is then related to the overdensity radius by the concentration, . This model has been used successfully to describe the density profiles of both simulated and observed clusters of a range of masses.
The model was fit to the density profile of ClJ1226.93332 using , and the best-fitting parameters were and (). Using scales the concentration to . The data and best fitting model are plotted in Fig. 16. The measured concentration of ClJ1226.93332 is significantly higher than that found for local clusters of a similar mass by V06. Furthermore, simulations predict that should decrease with increasing redshift (for a fixed mass) (e.g. Wechsler et al., 2002; Bullock et al., 2001). Wechsler et al. (2002) also found that concentration increases with the time between the epoch at which a cluster is observed () and that at which it formed (); . With , the concentration of ClJ1226.93332 would be in line with these predictions. However, given the suspected merger activity in ClJ1226.93332, seems more likely, with the high concentration resulting from the merger activity.
8.1. The global properties of ClJ1226.93332 and the scaling relations
To enable comparisons with other works, we compute the global properties of ClJ1226.93332 within different radii. These are summarised in Table 1. The temperatures and metal abundances were obtained from single temperature fits to the spectra extracted within each radius using the combined XMM-Newton data. These represent some of the most precise such measurements for a high-redshift system. The metal abundance is slightly lower than the values of observed in local clusters (e.g. Fukazawa et al., 1998), but is consistent with the declining abundance with redshift predicted by Ettori (2005) based on modelled supernovae rates.
We computed the bolometric luminosity of the cluster by scaling the value measured within out to (for consistency with Markevitch, 1998) and out to infinity using the measured surface brightness profile. We find and , including uncertainties on the temperature and metal abundance in those on the luminosity. These luminosities are consistent with those found by Maughan et al. (2006) based on a shorter XMM-Newton observation of ClJ1226.93332.
The measured properties of ClJ1226.93332 were then compared with local luminosity-temperature () relation of Markevitch (1998):
| (9) |
Here we have converted the relation to our cosmology, and included the predicted self-similar evolution. The properties of ClJ1226.93332 were found to agree very well with the predictions of this relation. ClJ1226.93332 was then compared to the local mass-temperature () relation derived by V06
| (10) |
The relation is again converted to our cosmology with the predicted self similar evolution. The V06 data and relation are plotted in Fig. 17 along with the data point for ClJ1226.93332, which falls significantly below the V06 relation.

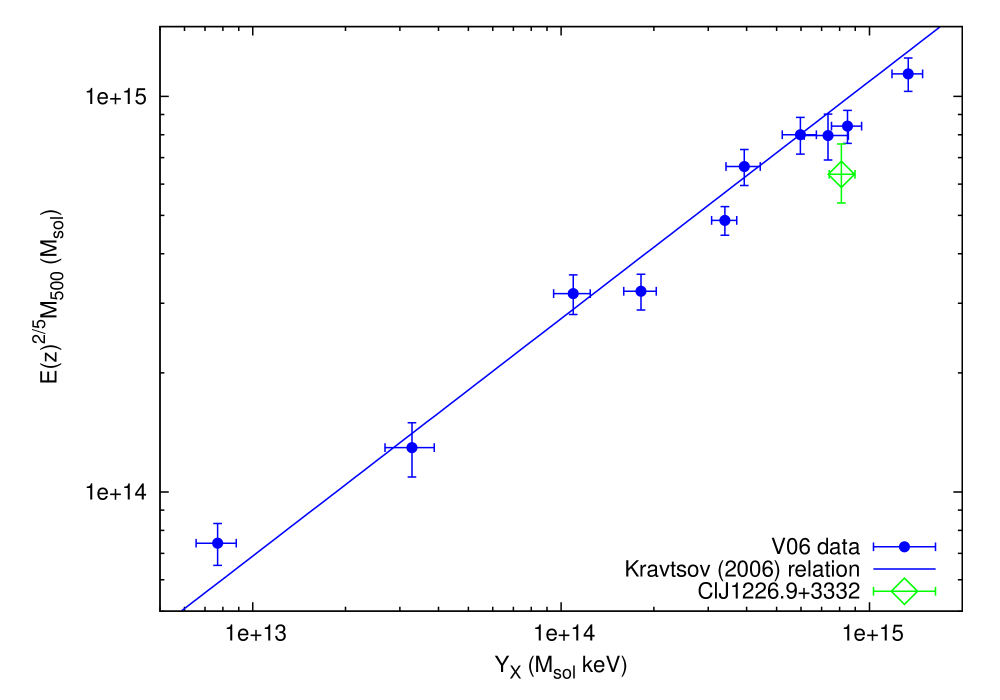
Finally, Kravtsov et al. (2006) recently proposed a new mass proxy for clusters, , obtained by multiplying the gas mass and temperature measured within together. This quantity was found to scale with mass with smaller scatter than other X-ray observables, and simulations showed that the scatter is less than even for unrelaxed clusters, and that the scaling relation evolves self-similarly. The high quality X-ray data for ClJ1226.93332 enable us to test these predictions observationally for the first time at high redshift. In Fig. 18 we reproduce the plot from Kravtsov et al. (2006) including the V06 data points. Following Kravtsov et al. (2006) we parameterise the relation as
| (11) |
Here, the normalisation found from the simulations of Kravtsov et al. (2006) has been reduced by (in line with the recommendation in that work), to better agree with the observed V06 cluster data. ClJ1226.93332 has a mass that is slightly low compared to the local clusters (although it is within the scatter at the level). This could be due to stronger than expected evolution in the relation, with resulting in good agreement. A more likely explanation though, is that the offset from the relation is caused by errors in one or both parameters. The simulations of Kravtsov et al. (2006) show that the scatter in is very small, even for merging clusters. Taking the measured of ClJ1226.93332 as an indicator of the true total mass then implies that the X-ray analysis underestimates the true mass by . Such a difference would also improve the agreement of ClJ1226.93332 with the relation.
Numerical simulations have shown that merging clusters tend to have lower temperatures for a given mass than relaxed systems, as the increase in thermal energy of the gas does not match the increase in mass due to the merger (Mathiesen & Evrard, 2001; Kravtsov et al., 2006). Thus the suspected merger event in ClJ1226.93332 could be responsible for an underestimate of the total mass using X-ray methods. The good agreement of ClJ1226.93332 with the relation is not inconsistent with this explanation, as mergers have been found to boost the luminosity and temperature of clusters approximately simultaneously, moving them along the relation (Randall et al., 2002; Rowley et al., 2004).
8.2. The effect of systematic temperature errors
As discussed in §5.2 an artificially high absorbing column was required when fitting the MOS spectra to produce agreement with the PN data. It appears likely that the PN data are the more reliable in this case, as the best-fitting PN absorbing column is close to the Galactic value while the MOS is significantly higher. However, the full analysis was also repeated with the MOS column fixed at the Galactic value, resulting in systematically higher temperatures in the combined EPIC fit. Vikhlinin et al. (2005) also found cluster temperatures measured with Chandra that were systematically higher by than those measured by XMM-Newton. It is thus instructive to evaluate the effect that systematic increase to the individual temperatures would have on the inferred properties of ClJ1226.93332.
Reassuringly, the total mass, gas mass, overdensity radii, and luminosity of ClJ1226.93332 did not change significantly when the Galactic column was used for the MOS data. These quantities are all robust to residual uncertainties in the EPIC calibration. The only significant change was in the temperatures, with the global temperature increasing to , with a corresponding increase in . The agreement with the , , and relations were thus all worsened by the higher . The derived mass did increase slightly in this test, but remained within our uncertainties because we included a large systematic contribution in our error budget and because the shape of the temperature profile did not change significantly in this experiment, even though its normalisation did. An isothermal mass estimate would have been much more sensitive to the increase in .
9. Summary and Conclusions
High quality XMM-Newton and Chandra data of ClJ1226.93332 have enabled the most precise X-ray mass analysis of any such high-redshift system. The temperature profile of the system showed no sign of central cooling, with a hot core and a radially declining profile. The cooling time of the gas only drops marginally below the Hubble time in the centre of the cluster. A temperature map showed asymmetry in the temperature distribution with a hot region that is apparently associated with a subclump of galaxies, but is not visible in the X-ray surface brightness. This is likely to be result of a merger event in the cluster, but does not appear to significantly affect the overall temperature profile.
The entropy profile in ClJ1226.93332 was not well described by the gravitational baseline profile of Voit et al. (2005) and required an additional constant entropy level. The profile increases with radii out to , and is consistent with the profiles observed in local clusters. The global properties of ClJ1226.93332 were compared with the local scaling relations and found to be consistent with the relation, but to fall below the and relations. As is insensitive to mergers, this implies that the total mass is underestimated by in the X-ray analysis, probably due to departures of the gas from hydrostatic and virial equilibrium. The high NFW concentration parameter found for ClJ1226.93332 is likely also due to the merger activity. Given the high luminosity of ClJ1226.93332, it is likely to be the only distant cluster for which such rich X-ray data are obtained with the current generation of satellites.
Appendix A A significance contouring method
Here we describe the procedure used to define contour levels based on the significance of the emission enclosed between them. For this method to succeed, the image used to define the contour regions needs to be sufficiently smoothed that smooth contiguous regions can be defined even where the number of counts are low. An adaptive smoothing algorithm is most suited for this purpose as it uses a large smoothing kernel in regions of low signal to noise, but maintains high spatial resolution where the signal to noise ratio is high. Two adaptive smoothing algorithms were tested; asmooth (Ebeling et al., 2006, upon which the CIAO task csmooth333Note however that the CIAO csmooth is inferior to the Ebeling et al. (2006) asmooth algorithm. This is addressed by Ebeling et al. (2006) and some shortcomings of csmooth are pointed out by Diehl & Statler (2005). is based), and the XMM-Newton Science Analysis Software (SAS) smoothing tool (this tool is also called asmooth, but for clarity we refer to it herein as xmmsmooth). We found that for this particular purpose, the asmooth was more suitable than xmmsmooth as xmmsooth created artifacts around point sources and pixelation in the cluster cores (even with a high smoothing significance threshold) that were incompatible with our contouring algorithm. We note that both asmooth and xmmsooth are less sensitive to regions of depressed emission than regions of excess emission.
To set the lowest contour level, the flux was measured in the background image for that cluster (after it had been normalised to match the local background level) in a circle of radius at the cluster centre. The lowest contour level was then set at a flux of above this background level. The flux interval between this level () and the peak of the cluster flux was divided into 500 logarithmically spaced intervals (; ). The next contour level was set at , and spatial regions bounded by the contours at and were defined on a smoothed image of the X-ray emission. For each distinct region, the significance of the emission contained in that region above the background was measured using the counts in the original unsmoothed source and background images. Regions that contained emission detected at significance were kept, and the others were rejected.
The process was then repeated with an upper flux limit of . Where regions had passed the previous step, new “child” regions were defined bounded by the contours at to , and were by definition fully enclosed by the passing parent region from the previous step. Where regions failed the previous step, new regions bounded by contour levels and were defined. This process was then repeated for all of the flux levels , with the significance of the emission enclosed by each region measured with respect to its local background. The local background for all child regions was measured in their respective parent region. For the lowest level regions bounded by contours at and , the blank-sky background image was used to measure the background level.
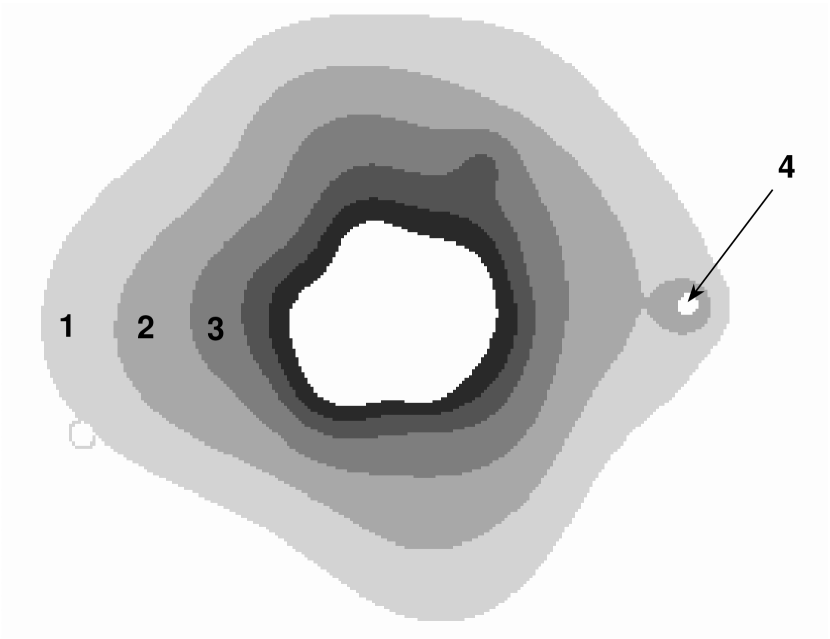
An image of some of the regions used to define the contour levels in the Chandra image of ClJ1226.93332 is shown in Fig. 19 for illustration. Region 1 is bounded by contour levels at and , and contains emission detected at above the emission in region 1 in the background image. Region 2 uses the emission in region 1 as the background level above which to measure its significance. Regions 3 and 4 use region 2 as a background, but their significance is measured independently. Note that this contouring scheme means that contour levels cannot be interpreted in the same way as in standard contour plots; separate contours that are the same number of contours above the background are unlikely to correspond to the same flux level in the smoothed image.
When applying this method to a large number of Chandra observations of clusters (Maughan et al. 2006 in prep.) it was found that an artificial “banding”could result. This is a repeated sequence of two tightly grouped contours followed by two widely spaced contours. The reason for this is that the statistical uncertainties on the blank-sky background counts in a region are generally very small, so a narrow contour band is sufficient for a detection. When that narrow band is used for a background for its child region, the uncertainties on the background level are relatively large due to the small number of counts, so a wide contour band is required for a detection. The next band is then narrow because of the relatively small background uncertainties in the wide parent region, and the process repeats. In order to prevent this, an additional criterion was imposed to regulate the process. In order for a region to pass, it was required that the contained emission be detected at and that the statistical uncertainty on the enclosed flux be smaller than some threshold. A threshold of was used for the majority of the clusters, but a higher (lower) threshold was required for the faintest (brightest) clusters. This regulation prevents the banding problem and means that, particularly in the brightest clusters, the significance of some regions is somewhat larger than the threshold.
References
- Allen et al. (2004) Allen S. W., Schmidt R. W., Ebeling H., Fabian A. C., van Speybroeck L., 2004, MNRAS, 353, 457
- Anders & Grevesse (1989) Anders E., Grevesse N., 1989, Geochim. Cosmochim. Acta, 53, 197
- Arnaud et al. (2002) Arnaud M., Majerowicz S., Lumb D., Neumann D. M., Aghanim N., Blanchard A., Boer M., Burke D. J., Collins C. A., Giard M., Nevalainen J., Nichol R. C., Romer A. K., Sadat R., 2002, A&A, 390, 27
- Bullock et al. (2001) Bullock J. S., Kolatt T. S., Sigad Y., Somerville R. S., Kravtsov A. V., Klypin A. A., Primack J. R., Dekel A., 2001, MNRAS, 321, 559
- Cagnoni et al. (2001) Cagnoni I., Elvis M., Kim D.-W., Mazzotta P., Huang J.-S., Celotti A., 2001, ApJ, 560, 86
- Dickey & Lockman (1990) Dickey J. M., Lockman F. J., 1990, ARA&A, 28, 215
- Diehl & Statler (2005) Diehl S., Statler T. S., 2005, ArXiv Astrophysics e-prints
- Donahue et al. (2003) Donahue M., Gaskin J. A., Patel S. K., Joy M., Clowe D., Hughes J. P., 2003, ApJ, 598, 190
- Donahue et al. (2006) Donahue M., Horner D. J., Cavagnolo K. W., Voit G. M., 2006, ApJ, 643, 730
- Ebeling et al. (2001) Ebeling H., Jones L. R., Fairley B. W., Perlman E., Scharf C., Horner D., 2001, ApJ, 548, L23
- Ebeling et al. (2006) Ebeling H., White D. A., Rangarajan F. V. N., 2006, MNRAS, 368, 65
- Ellis & Jones (2004) Ellis S. C., Jones L. R., 2004, MNRAS, 348, 165
- Ellis et al. (2006) Ellis S. C., Jones L. R., Donovan D., Ebeling H., Khosroshahi H. G., 2006, MNRAS, 368, 769
- Ettori (2005) Ettori S., 2005, MNRAS, 362, 110
- Ettori et al. (2003) Ettori S., Tozzi P., Rosati P., 2003, A&A, 398, 879
- Fukazawa et al. (1998) Fukazawa Y., Makishima K., Tamura T., Ezawa H., Xu H., Ikebe Y., Kikuchi K., Ohashi T., 1998, PASJ, 50, 187
- Henry (2004) Henry J. P., 2004, ApJ, 609, 603
- Jee et al. (2005) Jee M. J., White R. L., Ford H. C., Blakeslee J. P., Illingworth G. D., Coe D. A., Tran K.-V. H., 2005, ApJ, 634, 813
- Jeltema et al. (2001) Jeltema T. E., Canizares C. R., Bautz M. W., Malm M. R., Donahue M., Garmire G. P., 2001, ApJ, 562, 124
- Joy et al. (2001) Joy M., LaRoque S., Grego L., Carlstrom J. E., Dawson K., Ebeling H., Holzapfel W. L., Nagai D., Reese E. D., 2001, ApJ, 551, L1
- Kaastra & Mewe (1993) Kaastra J. S., Mewe R., 1993, A&AS, 97, 443
- Khosroshahi et al. (2006) Khosroshahi H. G., Maughan B. J., Ponman T. J., Jones L. R., 2006, MNRAS, pp 514–+
- Kravtsov et al. (2006) Kravtsov A. V., Vikhlinin A., Nagai D., 2006, ArXiv Astrophysics e-prints
- Majumdar & Mohr (2003) Majumdar S., Mohr J. J., 2003, ApJ, 585, 603
- Markevitch (1998) Markevitch M., 1998, ApJ, 504, 27
- Markevitch (2001) Markevitch M., 2001, ACIS background. http://hea-www.harvard.edu/ maxim/axaf/acisbg/
- Mathiesen & Evrard (2001) Mathiesen B. F., Evrard A. E., 2001, ApJ, 546, 100
- Maughan et al. (2006) Maughan B. J., Ellis S. C., Jones L. R., Mason K. O., Cordova F., Priedhorsky W. C., 2006, ApJ, in press
- Maughan et al. (2004) Maughan B. J., Jones L. R., Ebeling H., Scharf C., 2004, MNRAS, 351, 1193
- Maughan et al. (2006) Maughan B. J., Jones L. R., Ebeling H., Scharf C., 2006, MNRAS, 365, 509
- Maughan et al. (2004) Maughan B. J., Jones L. R., Lumb D., Ebeling H., Gondoin P., 2004, MNRAS, 354, 1
- Navarro et al. (1996) Navarro J. F., Frenk C. S., White S. D. M., 1996, ApJ, 462, 563
- Navarro et al. (1997) Navarro J. F., Frenk C. S., White S. D. M., 1997, ApJ, 490, 493
- O’Sullivan et al. (2005) O’Sullivan E., Vrtilek J. M., Kempner J. C., David L. P., Houck J. C., 2005, MNRAS, 357, 1134
- Ponman et al. (1999) Ponman T. J., Cannon D. B., Navarro J. F., 1999, Nature, 397, 135
- Randall et al. (2002) Randall S. W., Sarazin C. L., Ricker P. M., 2002, ApJ, 577, 579
- Read & Ponman (2003) Read A. M., Ponman T. J., 2003, A&A, 409, 395
- Rowley et al. (2004) Rowley D. R., Thomas P. A., Kay S. T., 2004, MNRAS, 352, 508
- Sarazin (1986) Sarazin C. L., 1986, Reviews of Modern Physics, 58, 1
- Scharf et al. (1997) Scharf C., Jones L. R., Ebeling H., Perlman E., Malkan M., Wegner G., 1997, ApJ, 477, 79
- Smith et al. (2001) Smith R. K., Brickhouse N. S., Liedahl D. A., Raymond J. C., 2001, ApJ, 556, L91
- Spergel et al. (2003) Spergel D. N., Verde L., Peiris H. V., Komatsu E., Nolta M. R., Bennett C. L., Halpern M., Hinshaw G., Jarosik N., Kogut A., Limon M., Meyer S. S., Page L., Tucker G. S., Weiland J. L., Wollack E., Wright E. L., 2003, ApJS, 148, 175
- Tonry et al. (2003) Tonry J. L., Schmidt B. P., et. al. 2003, ApJ, 594, 1
- Vikhlinin (2006) Vikhlinin A., 2006, ApJ, 640, 710
- Vikhlinin et al. (2006) Vikhlinin A., Kravtsov A., Forman W., Jones C., Markevitch M., Murray S. S., Van Speybroeck L., 2006, ApJ, 640, 691
- Vikhlinin et al. (2005) Vikhlinin A., Markevitch M., Murray S. S., Jones C., Forman W., Van Speybroeck L., 2005, ApJ, 628, 655
- Vikhlinin et al. (1998) Vikhlinin A., McNamara B. R., Forman W., Jones C., Quintana H., Hornstrup A., 1998, ApJ, 502, 558
- Vikhlinin et al. (2003) Vikhlinin A., Voevodkin A., Mullis C. R., VanSpeybroeck L., Quintana H., McNamara B. R., Gioia I., Hornstrup A., Henry J. P., Forman W. R., Jones C., 2003, ApJ, 590, 15
- Voit & Donahue (2005) Voit G. M., Donahue M., 2005, ApJ, 634, 955
- Voit et al. (2005) Voit G. M., Kay S. T., Bryan G. L., 2005, MNRAS, 364, 909
- Wechsler et al. (2002) Wechsler R. H., Bullock J. S., Primack J. R., Kravtsov A. V., Dekel A., 2002, ApJ, 568, 52