11email: yhtang@nju.edu.cn, lic@nju.edu.cn 22institutetext: National Center for Space Weather Monitoring and Warning, Meteorological Administration, Beijing 100081, China
22email: wgzong@nsmc.cma.gov.cn
The acceleration characteristics of solar energetic particles in the 2000 July 14 event
Abstract
Aims. In large gradual solar energetic particle (SEP) events, especially the ground-level enhancement (GLE) events, where and how energetic particles are accelerated is still a problem.
Methods. By using imaging data from TRACE, Yohkoh/HXT, SOHO/MDI and SOHO/EIT, along with the data from the GOES, Apatity NM, and SOHO/LASCO CME catalog, the evolution of the X5.7 two-ribbon flare and the associated SEP event on 14 July 2000 are studied.
Results. It is found that the magnetic reconnection in this event consists of two parts, and the induced electric field is temporally correlated with the evolution of hard X-ray and -ray emission. In particular, the first hard X-ray and -ray emission peak occurred at 10:22 UT, corresponding to the magnetic reconnection in the western part of the flare ribbons and the maximum of 9.5 V/cm; the second emission peak at 10:27 UT, corresponding to the eastern part and the maximum of 13.0 V/cm. We also analyze the SEP injection profiles as functions of time and CME-height, and find two-component injection which may result from different acceleration mechanisms.
Conclusions. A reasonable conclusion is that reconnection electric field makes a crucial contribution to the acceleration of relativistic particles and the impulsive component of the large gradual SEP event, while CME-driven shocks play a dominant role in the gradual component.
Key Words.:
acceleration of particles – Sun: particle emission – Sun: flares – Sun: coronal mass ejections (CMEs)1 Introduction
Solar energetic particles are one manifestation of violent energy releases on the Sun. It is widely accepted that SEP events can be divided into two classes: impulsive and gradual (Cane et al. Cane86 (1986); Kallenrode et al. Kallenrode92 (1992)). The impulsive SEPs are accelerated in flares, while the gradual ones are accelerated by CME-driven shocks (Reames Reames90 (1990); Reames Reames99 (1999); Kahler Kahler01 (2001); Kallenrode Kallenrode03 (2003)). “Mixed” events consisting of both particles accelerated in flares and at the shocks were considered to be nonexistent (Reames Reames02 (2002)). In particular, Kahler (Kahler94 (1994)) examined the SEP injection profiles of three ground-level enhancement (GLE) events as the function of the height of the associated coronal mass ejections (CMEs). They suggested that in these events SEP injection appears to only result from a single CME-driven shock and not from the flare impulsive phase.
In 1992, Kallenrode et al. found the most common energetic proton events are those exhibiting both an impulsive phase and shock emission, the “pure gradual” events are relatively rare. They suggest that between these two classes there should be “mixed” or “hybrid” events with both impulsive and shock acceleration. Cliver et al. (Cliver95 (1995)) then expanded the two-type classification to include the “mixed” events, in which the SEP event contains a mixture of flare-accelerated and CME/shock-accelerated particles. Recent observations and studies provide more and more evidence of the existence of mixed SEP events. Cohen et al. (Cohen99 (1999)) found that the charge states of 12 elements with energies of 12 – 60 MeV/nucl and source temperatures of (3 – 6) K, are significantly higher than at lower energies. It rules out acceleration out of the ambient material (Kallenrode Kallenrode03 (2003)). In addition, Cane et al. (Cane03 (2003)) find that in some intense SEP events, the time-intensity profiles exhibit two peaks: the earlier one with a high Fe/O ratio, the later one a low Fe/O ratio. A much simpler interpretation is that the earlier one is flare-related and the later one is CME-driven shock related. Dai et al. (Dai05 (2005)) find that some large gradual SEP events have an initial impulsive component, which may stem from flare acceleration. Shocks could also add substantial protons and contribute to the gradual component (Cane et al. Cane86 (1986)). And a recent simulation of mixed particle acceleration by Li & Zank (Li05 (2005)) indicated that the SEP time-intensity profile has an initial rapid increase followed by a plateau similar to a pure shock case.
An outstanding solar event occurred on 14 July 2000, “Bastille Day”, comprising an X-class flare, a fast halo CME, and a large particle intensity enhancement in interplanetary space. It offers an excellent opportunity to extend our knowledge about the acceleration and transport process of solar energetic particles. The GOES X5.7/3B two-ribbon flare, which occurred in the NOAA region 9077 (N22W07) at 10:03 UT, has been thoroughly studied by Aschwanden & Alexander (Aschwanden01 (2001)), Fletcher & Hudson (Fletcher01 (2001)), and Masuda et al. (Masuda01 (2001)). Their studies mainly focus on the generation of EUV and hard X-ray sources and on the corresponding magnetic structure. One of their important results is that flare ribbons map the footprints of magnetic field lines newly linked by reconnection, along which nonthermal particles bombard the lower atmosphere and lose their energy.
In this paper, we go on to use high-cadence observations from the Transition Region and Coronal Explorer (TRACE), along with the longitudinal magnetic field from the Michelson Doppler Imager (MDI) on board SOHO, to evaluate the magnetic reconnection electric field. This enables us to estimate a charged particle’s energy gain in the active region. Because this event was associated with a fast halo CME, we also analyzed the SEP injection profiles as the functions of time and the CME-height. We then discuss the roles of flare and CME-driven shock in producing energetic particles. This paper is organized as follows: In Sect. 2, we analyze the reconnection electric field, comparing it with hard X-ray emission, and investigate the SEP injection profiles. Section 3 is dedicated to discussions, and conclusions are drawn in Sect. 4.
2 Data analysis and results
2.1 Reconnection electric field
In the standard model of flare evolution, a rising reconnection region results in ribbons moving apart through the photospheric magnetic field. The separation motion of flare ribbons that sweep through the magnetic field lines corresponds to the rate of magnetic reconnection in the corona, where the reconnection current sheet (RCS) is generated (Forbes & Priest Forbes84 (1984), Forbes & Lin Forbes00 (2000)). We measured the magnetic reconnection rate in the form of a reconnection electric field. In a 2D-configuration approximation it can be given by (Qiu et al. Qiu02 (2002)), where is the separation velocity of flare ribbons and the magnetic field that the ribbons sweep through. Since the flare occurred near the disk center, can be approximately taken as the longtitudinal component of the magnetic field obtained from the SOHO/MDI magnetogram at 09:36:01 UT before the flare. The mean reconnection electric field induced inside the current sheet is obtained by averaging the electric field inferred in each of the two ribbons.
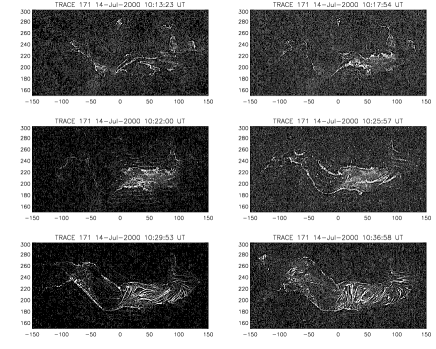
We used the high-cadence ( minute) 171 TRACE observations covering the time interval of 10:11 UT – 10:59 UT to measure the ribbon separation of the flare. To enhance the spatial structure of the flare ribbons, we applied a high-pass filter by subtracting a smoothed image (smoothed by 33 pixels) from the original images. Figure 1 shows six of these images of the active region at different times. It is clear that the separation of the flare ribbons occurred first in the western part and then in the eastern part.
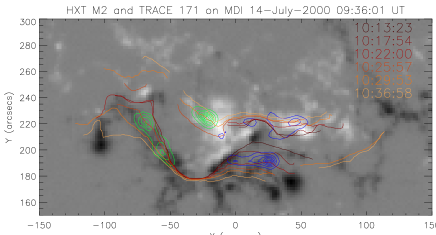
To overlay the positions of the flare ribbons on the magnetogram, we first resized the TRACE white light image (at 09:35:16 UT) to the same pixel size as an MDI continuum image (at 09:35:31 UT), and cross-correlated the two images. This procedure returns a value for the offset between the TRACE and MDI images. With this offset correction, the positions of the flare ribbons for each TRACE 171 image can be traced and overlaid on the MDI magnetogram. Since the time interval we studied is 50 minutes, the solar rotation must be taken into account. We also reconstructed hard X-ray images (M2 channel) made during the two peaks of the flare emission (10:22:45 – 10:23:10 UT and 10:26:58 – 10:27:04 UT), and overlaid them on the MDI magnetogram. Figure 2 shows the positions of EUV ribbons and hard X-ray sources overlaid on the MDI magnetogram.
As Fig. 1 shows, the eruption of the flare is divided into two stages. The first eruption occurred in the western part of the flare ribbons between 10:11 UT and 10:24 UT, and then it triggered the second eruption at the eastern part after 10:24 UT. This indicates that the reconnection current sheet should consist of two parts, corresponding to the evolution of the two parts of the flare ribbons. Comparing the electric field inferred from the two parts with flare nonthermal emission at hard X-ray, we find good temporal correlation between them, as shown in Fig. 3. In particular, the first hard X-ray emission peaks at 10:22 UT, corresponding to the magnetic reconnection in the western part of the flare ribbons and the maximum of 9.5 V/cm and the second one occurred at 10:27 UT, corresponding to the magnetic reconnection in the eastern part and the maximum of 13.0 V/cm. Two -ray emission peaks were also reported at 10:22 UT and 10:27 UT (Share et al. Share01 (2001)).

From Fig. 2, we can also find that the hard X-ray sources, in which energetic particles precipitated along magnetic field lines newly linked by reconnection, are just located at the area where the flare ribbons have the most rapid separation. The good temporal and spatial correlation indicates a physical link between magnetic reconnection and energy release in flares, and also suggests that reconnection electric field plays an important role in accelerating nonthermal particles.
2.2 SEP injection profiles
The 2000 July 14 GLE event was accompanied by both an X5.7 flare and a fast halo CME with a speed of 1674 km/s. To understand the roles of the flare and the CME-driven shock in producing solar energetic particles, both the proton and cosmic ray intensities were compared to the CME height-time profile. The proton intensity was obtained from Geostationary Operational Environment Satellite (GOES). The , , and channel data we used were 5-minute-averaged and cover the energy ranges 15 – 40, 40–80, and 165 – 500 MeV, respectively. The one-minute-averaged cosmic ray intensity was obtained from the Apatity neutron monitor (NM), which is located at N67.57E33.40. At the time of the GLE event, Apatity NM was “viewing” in the direction towards the Sun along the interplanetary magnetic field (IMF) lines connecting the Sun with the Earth, so it has a suitable position for detecting the direct prompt solar cosmic ray (SCR) intensity.
Assuming that energetic particles travel along the IMF lines at a speed of with no scattering, we usually estimate the proton solar release time relative to CME white light observation, by subtracting from observed time at 1 AU, where
| (1) |
1.1 AU corresponds to the length of IMF lines when the solar wind is about 600 km/s for this event. For SCR particles ( GeV), we take as approximately 0.9c (c is the velocity of light). For GOES (15 – 40 MeV) and (165 – 500 MeV)– considering the velocity dispersion within each channel and due to the power law spectrum– the highest intensities are related to the lowest energies, we take as approximately 0.2c and 0.6c, related to the lowest energies 15 and 165 MeV, respectively. Then, the SEP injection profiles as functions of time and CME-height are plotted in Fig. 4.

The estimate of solar release times in Eq. (1) to determine the SEP injection profiles is justified only when the SEP mean free path 1 AU. However, a range of 0.080.3 AU for SEPs of all energies was found by Palmer (Palmer82 (1982)) from SEP intensity-time and anisotropy-time measurements, so it is necessary to consider the effect of interplanetary scattering on the injection profiles of Fig. 4. Using the transport equation (Kallenrode et al. Kallenrode92 (1992)) and a Reid-Axford injection profile (Reid Reid64 (1964)), we estimate the displacements in the plot of Fig. 4 that is delayed from the true injection profiles. The Reid-Axford injection profile is shown to be:
| (2) |
We take (, , ) as (0.1 hr, 0.5 hr, 0.1 AU) for SCR ( GeV) particles and (0.3 hr, 1 hr, 0.08 AU) for GOES ( and ) particles, respectively.
Then, the peaks of SCR, , and injection profiles should be respectively displaced by 20, 145, and 78 minutes. Considering these displacements, we find that the peaks of the injection profiles of SEPs occurs before 10:31 UT 5 minutes when the CME height reaches , which is very close to the Sun.
This estimation is consistent with the result of Bieber et al. (Bieber02 (2002)), who obtained the best fit to the relativistic protons observed on Bastille Day and found that the injection function of particles released near the Sun has a peak at 10:26:50 UT with an FWHM (full width half maximum) of 5 minutes. Please note that this injection function has a good correlation with the hard X-ray, -ray emission and the inferred reconnection electric field during 10:22 – 10:33 UT as Fig. 3 shows.

To fully comprehend the SEP event, proton intensity-time profiles during two days are plotted in Fig. 5, which shows that the injection profiles have two components or phases, which can be named “impulsive component” and “gradual component”. The impulsive component lasts from 10:26 UT to 15:00 UT on 14 July 2000 only a few hours, followed by the gradual one lasting until the interplanetary shock reached 1 AU at 14:16 UT on 15 July 2000, far beyond the flare duration. It is clearly shown that the gradual component of relative lower energetic protons (P4 and P5) appears to result from interplanetary shock acceleration, which however plays a minor role in accelerating somewhat higher energetic protons (P7).
3 Discussion
This section tries to explore the origins of relativistic particles and the impulsive component of the large gradual SEP event, flare reconnection acceleration, and shock wave acceleration?
3.1 Particle acceleration in the RCS
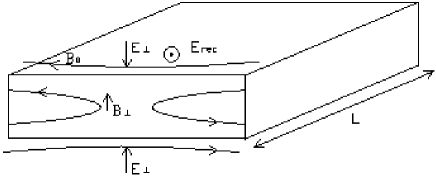
In the RCS particles can be accelerated by the DC electric field. This acceleration process is limited by the gyromotion along the transverse magnetic field (Martens & Young Martens90 (1990)). The question then arises as to whether the DC electric field can accelerate protons to GeV energy. Litvinenko & Somov (Litvinenko95 (1995)) introduced a transverse electric field outside the RCS (Fig. 6), which efficiently “locks” the protons in the RCS, thus allowing protons to be accelerated to a few GeV energy in a time of 0.1 s. For this event, given the maximum V/cm, acceleration length cm is needed to accelerate the protons to GeV energy. The ratio of the acceleration length to the whole filament length in this event is , hence protons are not accelerated in a single beam running the full length of the RCS. This avoids the contradiction that the electric current associated with the accelerated particles would be so large that the induced magnetic field would exceed typical coronal values by a lot.
3.2 RCS – a reasonable acceleration source of SCR particles
On the condition described above, protons could be effectively and rapidly accelerated to a very high energy in the RCS. The inferred GLE onset time also coincides with the hard X-ray, -ray emission and the inferred reconnection electric field. It suggests that the reconnection electric field perhaps makes a crucial contribution to the acceleration of SCR particles and the impulsive component of the large gradual SEP event.
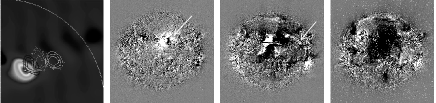
An argument against flare acceleration is that the flare did not occur in the well-connected region. However, Klein et al. (Klein01 (2001)) find a clear frequency dispersion of the western radio source during the time around the GLE onset, indicating a coronal magnetic structure that bends westward with decreasing frequencies (Fig. 7, left panel). This can be interpreted as a coronal magnetic channel that links to the well-connected region. The large-scale solar surface disturbance observed between 10:12 UT – 10:48 UT is also shown in the right panel Fig. 7. It offers a particle transport path from the poor-connected region (flare site) to the well-connected region and may correspond to a field-opening process.
Another argument against flare acceleration in large gradual events is that reconnection occurs in closed field lines beneath CME and that the accelerated particles are trapped so they cannot escape (Reames Reames02 (2002)). However, according to the time profiles of hard X-ray and -ray, as well as energetic particles (including proton, 3He, and 4He) from the FY-2 satellite, Tang & Dai (Tang03 (2003)) found that the 2000 July 14 SEP event should be a mixed one, in which both flare and CME-driven shock accelerated particles exist. Continuous radio bursts from a few GHz to 1 MHz were also reported (Cane et al. Cane02 (2002); Klein et al. Klein01 (2001)). It implies that open field lines extending from within 0.5 solar radii into interplanetary space must exist, so flare-accelerated particles can escape along the open field lines into interplanetary space.
3.3 Other viewpoints
Indeed, in large SEP events, especially the GLE events, where and how energetic particles are accelerated remains enigmatic. In the above section, we suggest that RCS could make a crucial contribution to the SCR particles and the impulsive component of the large gradual SEP event. One may propose a possibility that particles first be energized in the current sheet and then be reaccelerated by perpendicular coronal shocks (Tylka et al. Tylka05 (2005)). The large-scale disturbance (Fig. 7, right panel) may be considered as a visible manifestation of a moving acceleration region and interpreted as the moving skirt of coronal shock wave (Cliver et al. Cliver95 (1995); Torsti et al. Torsti99 (1999)). However, an important issue is whether low-energy ions can be efficiently and rapidly accelerated to GeV energy at the coronal shock given a lower compression ratio (The compression ratio of this event is 2). Even though particles can be efficiently and rapidly accelerated by perpendicular coronal shock, it still cannot explain the two components of the SEP injection profiles. Tang & Dai (Tang03 (2003)) find that the interplanetary shock is the extension of the coronal shock with the same driver agency — the fast CME. As a result, the shock-acceleration SEPs should be continuously depleting and cannot have two peaks as shown in Fig. 5. Whatever the true cause, the rapid and great enhancement of relativistic particles cannot be mainly due to shock acceleration, and the reconnection electric field probably makes a crucial contribution, while the gradual enhancement of energetic particles can be perfectly interpreted by CME-driven shock acceleration.
4 Conclusions
In this paper, we have evaluated the reconnection electric field inferred from the 14 July 2000 X5.7 two-ribbon flare, and analyzed the associated SEP event. Based on the above analysis, our conclusions can be briefly summarized as follows:
-
1.
The magnetic reconnection in this event consists of two parts, corresponding to the evolution of the two parts of the flare ribbons, respectively. The induced electric field is temporally correlated with the evolution of hard X-ray and -ray emission, which indicates that the reconnection electric field plays an important role in accelerating nonthermal particles. Given the maximum V/cm, acceleration length cm is needed to accelerate protons to GeV energy in the RCS by DC electric field.
-
2.
The injection of SEPs is composed of two components. The impulsive component occurs very close to the Sun, and the solar protons’ release time is consistent with the hard X-ray, -ray emission peak and the inferred maximum reconnection electric field.
-
3.
The reconnection electric field probably makes a crucial contribution to the acceleration of relativistic particles and to the impulsive component of the large gradual SEP events, while CME-driven shocks play a dominant role in the gradual component.
Acknowledgements.
We are very grateful to J. Qiu and the anonymous referee, whose constructive comments have greatly improved this paper. We thank the SOHO/MDI, SOHO/EIT, SOHO/LASCO CME catalog, Yohkoh/HXT, and TRACE teams for providing the observational data. SOHO is a project of international cooperation between ESA and NASA. Apatity neutron monitor data is kindly provided by the Polar Geophysical Institute of the Russian Academy of Sciences (PGI, Apatity). This work was supported by NKBRSF of China G2000078404 and NSFC key projects No. 10333040 and No. 10221001.References
- (1) Aschwanden, M. J., & Alexander, D. 2001, Sol. Phys., 204, 93
- (2) Bieber, J. W., Dröge, W., Evenson, P. A., Pyle, R., Ruffolo, D., Pinsook, U., Tooprakai, P., Rujiwarodom, M., Khumlumlert, T. & Krucker, S., 2002, ApJ, 567, 622
- (3) Cane, H. V., McGuire, R. E., & von Rosenvinge, T. T. 1986, ApJ, 301, 448
- (4) Cane, H. V., Erickson, W. C., & Prestage, N. P. 2002, J. Geophys. Res., 107, 1315
- (5) Cane, H. V., von Rosenvinge, T. T., Cohen, C. M. S., & Mewaldt, R. A. 2003, Geochim. Res. Lett., 30, 8017
- (6) Cliver, E. W., Kahler, S. W., Neidig, D. F., Cane, H. V., Richardson, I. G., Kallenrode, M. -B., & Wibberenz, G. 1995, in Proc. 24th Int. Cosmic Ray Conf. Rome, Italy, 4, 257
- (7) Cliver, E. W. 1996, in High Energy Solar Physics, AIP Conference Proeedings, 374, 45
- (8) Cohen, C. M. S., Cummings A. C., Leske R. A., Mewaldt, R. A., Stone, E. C., Dougherty, B. L., Wiedenbecke, M. E., Christian, E. R. & von Rosenvinge, T. T., 1999, Geochim. Res. Lett., 26, 149
- (9) Dai, Y., Tang, Y. H., & Qiu, K. P. 2005, Adv. Space Res., 35, 1871
- (10) Fletcher, L., & Hudson, H. 2001, Sol. Phys., 204, 71
- (11) Forbes, T. G., & Lin, J. 2000, J. Atmos. Sol-Terr. Phys., 62, 1499
- (12) Forbes, T. G., & Priest, E. R. 1984, in Solar Terrestrial Physics: Present and Future, ed. D. W. Butler & K. Paradupoulous(NASA), 1
- (13) Kahler, S. W. 1994, ApJ, 428, 837
- (14) Kahler, S. W. 2001, in AGU Geophys. Monogr. Ser. 125, Space Weather, ed. P. Song, H. Singer, & G. Siscoe (Washington: AGU), 109
- (15) Kallenrode, S. W., Cliver, E. W., & Wibberenz, G. 1992, ApJ, 391, 370
- (16) Kallenrode, S. W. 2003, J. Phy. G: Nucl. Part. Phys. 29, 965
- (17) Klein, K. -L., Trottet, G., Lantos, P., & Delaboudinire, J. -P. 2001, A&A, 373, 1073
- (18) Li, G., & Zank, G. P. 2005, Geochim. Res. Lett., 32, 2101
- (19) Litvinenko, Y. E., & Somov, B. V. 1995, Sol. Phys., 158, 317
- (20) Martens, P. C. H., & Young, A. 1990, ApJS, 73, 333
- (21) Masuda, S., Kosugi, T., & Hudson, H. S. Sol. Phys., 204, 57
- (22) Palmer, I. D., 1982, Rev. Geophys. Space Phys., 20, 335
- (23) Qiu, J., Lee, J., Gary, D. E., & Wang, H. M. 2002, ApJ, 565, 1335
- (24) Reames, D. V. 1990, ApJS, 73, 235
- (25) Reames, D. V. 1999, Space Sci. Rev., 90, 413
- (26) Reames, D. V. 2002, ApJ, 571, 63
- (27) Reid, G. C., 1964, J. Geophys. Res., 69, 2659
- (28) Share, G. H., Murphy, R. J., Tylka, A. J., Schwartz, R. A., Yoshimori, M., Suga, K., Nakayama, S., & Takeda, H. 2001, Sol. Phys., 204, 43
- (29) Tang, Y. H., & Dai, Y. 2003, Adv, Space Res., 32, 2609
- (30) Torsti, J., Kocharov, L. G., Teittinen, M., & Thompson, B. J. 1999, ApJ, 510, 460
- (31) Tylka, A. J., Cohen, C. M. S., Dietrich, W. F., Lee, M. A., Maclennan, C. G., Mewaldt, R. A., Ng, C. K., & Reames, D. V. 2005, ApJ, 625, 474