Oscillatory relaxation of a merging galaxy cluster
Abstract
Within the cosmic framework clusters of galaxies are relatively young objects. Many of them have recently experienced major mergers. Here we investigate an equal mass merging event at resulting in a dark matter haloe of at . The merging process is covered by 270 outputs of a high resolution cosmological N-body simulation performed with the ART (adaptive refinement tree) code. Some s elapse between the first peri-centre passage of the progenitor cores and their final coalescence. During that phase the cores experience six peri-centre passages with minimal distances declining from to . The time intervals between the peri-centre passages continuously decrease from to s. We follow the mean density, the velocity dispersion and the entropy of the two progenitors within a set of fixed proper radii (25, 50, 100, 250, 500, ). During the peri-centre passages we find sharp peaks of the mean densities within these radii, which exceed the sum of the corresponding progenitor densities. In addition to the intermixing of the merging haloes, the densities increase due to contraction caused by the momentary deepening of the potential well. The velocity dispersions also peak during peri-centre passages. Within the fixed proper radii the entropy of the most massive progenitor after the merger settles close to its pre-merger values. At the end of the oscillatory relaxation phase the material originating from the less concentrated of the two equal mass progenitors is deposited at larger radii and shows a slightly more radially anisotropic velocity dispersion compared to the material coming from the more concentrated progenitor. Every peri-centre passage is accompanied by a substantial drop of the central potential well. We briefly discuss the possibility that AGN outbursts are triggered by the periodically changing potential.
keywords:
cosmology:theory – galaxies:clusters:general – methods:numerical1 Introduction
The current cosmological model (e.g. Spergel et al. 2006) assumes the gravitating matter to be composed of per cent baryonic and per cent dark matter (DM). The former interacts electromagnetically, the latter is not directly visible. By comparing lensing observations with X-ray maps of the merging cluster 1E0657-558 Clowe et al. (2006) find strong evidence for unseen matter concentrations that are more massive than the baryonic component. These observations emphasise the complexity of the interactions between dark and baryonic matter during mayor merging events. Based on hydrodynamic simulations of head-on mergers between model galaxy clusters Pearce et al. (1994) find a damping of the core oscillations by the gaseous component. The situation may become even more complex if the collision of gas-rich systems can trigger star formation and outflows from the central active galactic nucleus (AGN). Multi wave band observations by Conselice et al. (2001) reveal that this may actually the case for the central galaxy NGC 1275 in the Perseus Cluster.
Using high resolution gas dynamical simulations Nagai et al. (2006) demonstrate that the X-ray observations of unrelaxed clusters cannot accurately measure the density and temperature gradients in the hot baryonic intra cluster medium (ICM). In addition some potentially relevant physical processes, such as AGN bubbles, magnetic fields, and cosmic rays, are not well understood yet and are usually excluded from such simulations. Here we do not aim to model the behaviour of the gas directly. Our analysis is based on a pure N-body simulation. However, since the collisionless component dominates the gravitational potential, we hope to gain some complementary insight into the violent processes during a mayor merger of galaxy clusters. The merging event is covered by a set of 270 simulation outputs which allows us to precisely measure even highly variable features during the violent relaxation phase. Our goal is twofold: (1) we provide a precise time table of events during the core merging phase. The dynamics may be slightly altered by the presence of collisional material, however the general behaviour is not expected to change profoundly. (2) we investigate the evolution of the central potential to achieve some basic understanding of the gravitational forces which the baryons are exposed to. Ultimately we wish to uncover interactions between the DM and the baryonic components which result in observable phenomena.
The paper is organised as follows. § 2 introduces the simulation and data preparation. In § 3 we present the evolution of the density, the velocity dispersion and the entropy of the DM within spheres of fixed proper radii. Additionally, the evolution of the central gravitational potential is discussed. Finally, § 4 provides a summary of the main results and a discussion focusing on the potential interplay between the dark and the baryonic component.
2 Simulation and data preparation
The N-body simulation of a cluster-sized DM haloe has been performed with the adaptive mesh refinement code ART (Kravtsov et al., 1997). The present analysis is based on snapshots between the redshifts and . The cluster haloe has been selected from an initial low-resolution simulation, particles within an cube in a CDM universe ( ; ; ; ). Higher mass resolution has been achieved by means of the multiple-mass technique (Klypin et al., 2001) applied to the particles within a Lagrangian volume of approximately twice the virial radius () of the cluster at . This technique results in a mass resolution of which is equivalent to an effective resolution of particles within the box. The minimum cell size allowed in the ART runs was set to . The simulation started at and the virial mass of the cluster at has is corresponding to particles within the virial radius. The haloe analysed here is the most massive cluster in the sample discussed by Ascasibar et al. (2004).
| 1 | 2 | 3 | |
|---|---|---|---|
| 0.20 | 338548 | 41580 | |
| 0.17 | 153916 | 140898 | 31656 |
| 0.10 | 71595 | 60984 | 15949 |
| 0.07 | 31077 | 31006 | 9733 |
| 0.02 | 3489 | 1312 | 326 |
At two progenitors of similar mass merge. They are by far the largest units assembled by the cluster up to the present time. We wish to identify those particles at later times which belonged to one of the two most massive progenitors before the merger. To that purpose we apply a hierarchical friends-of-friends approach (FoF, see Klypin et al. 1999) at , which is before the actual merger takes place. First the three most massive haloes within the high resolution Lagrangian volume are found by a linking length of times the mean particle separation. With a sequence of decreasing linking lengths, namely 0.10, 0.07 and 0.02 times the mean particle separation, substructures of increasing density are detected. Tab. 1 lists the three most massive structures for the various linking lengths.
We find that the three most massive groups detected for each linking length are associated one by one with the three most massive spatially separated 0.17 haloes. Visual inspection reveals that the second most massive progenitor is in the final state of a merging event at . However, at when the central parts of the two progenitors begin to penetrate each other, the relaxation associated with that precedent merging event is entirely completed. Therefore, the two progenitors can be assumed to be fairly undisturbed objects at the onset of the major merger. In the following we will refer to the two most massive progenitors, comprising 153916 and 140898 particles, as the first and second ranked progenitors. The difference in mass is only per cent, which justifies the perception of an equal mass merging event. To get an idea of the constellation relative to each other we apply a further FoF analysis this time with an enlarged linking length of 0.20 times the mean particle separation listed in the first line in Tab. 1. The most massive 0.20 group embeds the two most massive 0.17 haloes, indicating that those two are about to merge. The second 0.20 group is much less massive and encloses the third 0.17 group, indicating that the third 0.17 group is well separated from the two others. In fact this group will merge with the main cluster at , a long time after the completion of the major merger. To summarise, at the two most massive progenitors are fairly relaxed systems. The second ranked progenitor shows disturbances due to a precedent merging event at , however these are completely erased at . The two progenitors have similar masses and are about to merge. The third most massive object is clearly separated at and merges with the main cluster not before .

Fig. 1 compares the density profiles of the first and second ranked progenitors at with the density profile of the merged system at . In agreement with the FoF analysis, which indicated that the second ranked progenitor formed later, the first ranked progenitor shows higher concentration () than the second one (), where the concentration results from a NFW-fit (Navarro et al., 1997) to the density profiles. The densities within the merged system are about two times larger than the densities within the two most massive progenitors. The hump seen in both progenitor profiles at reflects the location of the other progenitor.
Simulations provide an opportunity to trace the evolution of single particles. This is of particular interest since it enables us to analyse the properties of the subset of particles within the merged cluster that originate from each progenitor. In addition the orbits of the progenitor remnants within the already merged system can be easily traced if the substructure identification is based only on those particles which originate from the corresponding progenitor. Therefore, we keep record of the particles which belonged to one of two most massive haloes at . That way the progenitor of a given particle can be identified for any given subsequent time. A particle can either originate from the most or the second massive progenitor at or from neither of them.

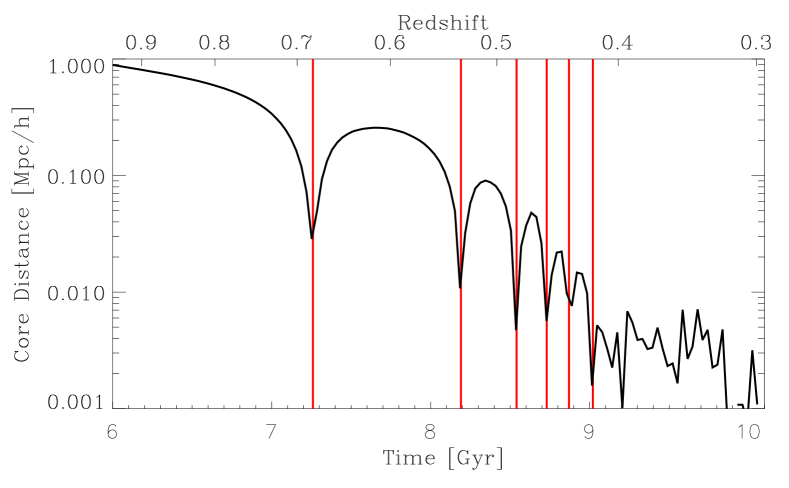
To trace the orbit of a progenitor during the merging process we compute the top hat smoothed density field, (proper), based only on those particles which belonged to the corresponding 0.17 FoF group at . Subsequently, we determine the location of the peak density. Applied to all snapshots, this procedure enables us to trace the orbit of the progenitor core during peri-centre passages and at late evolutionary states even if there is a strong contamination of particles from the other progenitor. Fig. 2 displays the projected orbits of the two most massive progenitors between and . A complementary aspect is provided by Fig. 3 which shows the evolution of the distance between the two progenitor cores with time. During the first peri-centre passage the minimum distance of the progenitor cores is and it gradually declines to for the last resolved peri-centre passage. Similar decays of subhaloe orbits have been shown by Kravtsov et al. (2004) and Boylan-Kolchin & Ma (2006). Our approach enables to trace six peri-centre passages before the two progenitor cores entirely fuse to one single structure. About elapse between the first peri-centre passage and the final coalescence.
3 Results
The present analysis of an N-body merging event takes advantage of the possibility to mark particles according to their association with one of the two most massive progenitors at . Consequently the properties of all the particles within the final halo volume can be compared to the properties of only those particles that originally were associated with either the first or the second ranked progenitor. In the foregoing section we have verified that the masses of the two progenitors at the onset of the merging process () are in fact very similar but the concentrations differ. The first ranked progenitor is somewhat more concentrated. This property is important for the interpretation of the results presented here. The following paragraphs focus on the evolution of mean values of the density, velocity dispersion and the entropy within a variety of proper halo-centric radii (, 50, 100, 250, 500 and ). Finally we discuss the oscillations of the central potential during the merging process.
3.1 Density
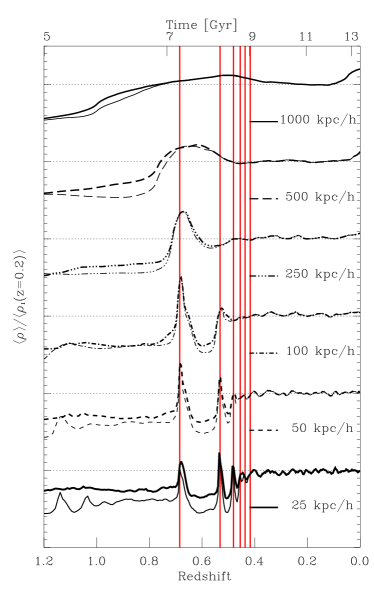
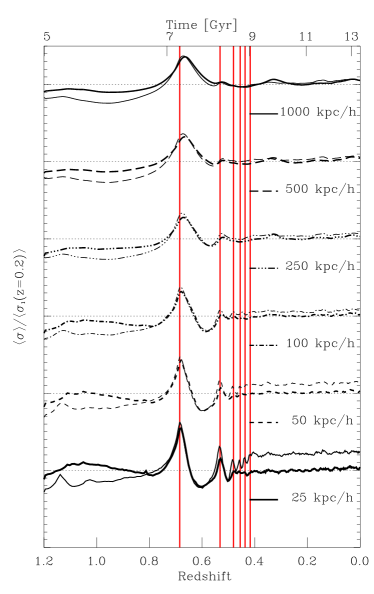
The evolution of local densities during a merging event of collisionless systems depends on two competing processes: (1) the volume overlap of the two systems causes an increase of the local densities; (2) the deepening of the gravitational potential well that induces a contraction accompanied by accretion of additional material from the surrounding. To disentangle these two mechanisms Fig. 4 shows the evolution of the mean densities in two different ways. The left hand side of Fig. 4 displays the evolution of the ’total’ densities, i.e. densities based on all particles within the corresponding halo-centric spheres independent of the particles’ origin (first or second ranked progenitor or none of them). The right hand side of Fig. 4 exhibits the densities based only on those particles which originally (at ) were associated with each progenitor. In both figures the heavy lines are used for the density evolution associated with the first ranked progenitor and the thin lines depict the evolution of the second ranked progenitor. All densities are scaled by the mean densities of the first ranked progenitor at . (In fact, if the densities are computed based on all particles within a sphere since two progenitor cores coincide at ). Each horizontal dotted line indicates a value of one for the pair of graphs next to it and a value of zero for the pair of graphs above.
For all proper inclusion radii the evolution of the mean densities in the left panel of Fig. 4 passes a maximum value around . For all radii the mean densities after the completion of the merging are somewhat lower than the sum of two the corresponding progenitor densities. For example the tracks of the mean densities within raise from for both progenitors to at the first peri-centre passage. After passing a subsequent minimum and a less pronounced second maximum the density of the merged system settles at a value of 1, whereas the sum of the two initial densities results in a value of 1.2 . In contrast to the final density, the density at first peri-centre passage () is larger than the sum of the two initial densities. This additional increase cannot be explained solely by the volume overlap of the two progenitors, it must be at least partly caused by the deepened potential well during the peri-centre passage which attracts an additional amount of matter towards the centres of the progenitors.
The right hand side of Fig. 4 measures the density enhancement as a response of the deepened potential well during peri-centre passages. Here the computation of the densities is based only on the particles which were associated with each corresponding progenitor at . This approach rules out increasing densities as a result of overlap with the other progenitor. The only way that the mean densities within the fixed proper radii can increase is by contraction, causing additional material to stream inwards across the boundary of that particular sphere. The densities are normalised by the mean densities associated with the first ranked progenitor at . In all cases the mean densities are lowered after the merging event and the densities of the second ranked and less concentrated progenitor decrease by somewhat higher fractions. Some of the kinetic bulk energy of the progenitors is used to accelerate individual particles which subsequently leave the original volume. The modest decrease for the is explained by the fact that before merging the two most massive progenitors have virial radii (see Fig. 1), similarly the extend of the 0.17 FoF groups at is substantially smaller than the spheres. Therefore, if particles are pushed towards larger radii during the merging event they may still reside within the sphere. However even for the spheres a 10 percent loss can be observed.
It is of interest to see how much additional matter (i.e. particles) not associated with either of the two most massive progenitors at , can be found within the various spheres after the merging event. In the following table we display the sum of the particles descending from both most massive progenitors divided by the total number of particles within the listed radii.
| 25 | 50 | 100 | 250 | 500 | 1000 | |
|---|---|---|---|---|---|---|
| 1.00 | 0.99 | 0.95 | 0.84 | 0.68 | 0.52 |
The table above indicates that all particles within the central and 95 per cent of the particles within descend from one of the two most massive 0.17 FoF groups at . Within the sphere per cent of the material was not associated with either of the two progenitors. As discussed above this is mainly caused by the fact that the sphere is substantially larger than the FoF groups, therefore already at a substantial fraction of particles is included which is not associated with either of the two 0.17 FoF groups.
The vertical lines in Fig. 4 indicate the moments of peri-centre passage derived from the evolution of the core distances in Fig. 3. The right hand side of Fig. 4 reveals a slightly delayed peak of the densities based only on the original progenitor particles compared to the densities based on all particles within the given radii. The density enhancement due to the overlap of the two progenitors is followed by a density enhancement due to a contraction of the original particles. For example the first peaks for the sphere on the right hand side of Fig. 4 are delayed by compared to the corresponding peaks on the left hand side. For larger inclusion radii this delay time increases. As clarified in Fig. 3 the spheres of the two progenitors overlap only partially during the first peri-centre passage with a minimum core distance of . Thus most of the density increase within the innermost sphere must be caused by contraction involving mostly original particles, which should erase differences between the two panels. Despite of the slightly higher density peak for the second ranked progenitor (left panel) and a marginal delay for both peaks of the individual progenitors (right panel), the amplitude and shape of the first peaks of the spheres are very similar in both panels.
The evolution of the densities has revealed that the peak densities during peri-centre passages within fixed proper radii are caused by the volume overlap and additionally by contraction as a response of the deepened potential well during that phase. The final masses included within the fixed radii are not the sum of the masses within the corresponding radii of the progenitors. The transformation of kinetic bulk energy into random velocities pushes individual particles out of the original volume. Despite having very similar masses, the lower concentrated progenitor loses a higher fraction of its original central particles compared to the higher concentrated progenitor.
3.2 Velocity dispersion
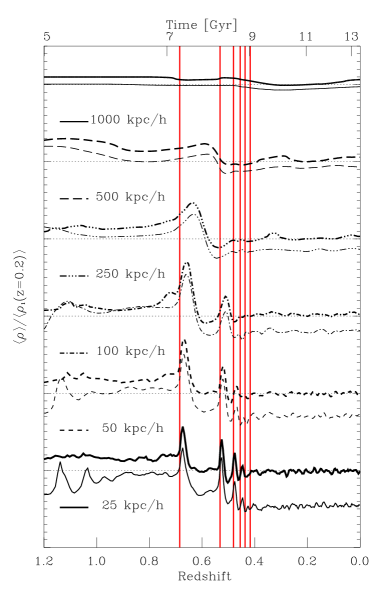
Using an approach similar to that of the densities also the mean velocity dispersions are investigated in a twofold manner. Fig 5 shows the evolution of the mean velocity dispersion for all particles within the corresponding spheres and for only those particles which were associated with each individual progenitor at . The heavy lines display the evolution of the first ranked progenitor whereas the thin lines display the fate of the second ranked progenitor. Before computing the velocity dispersions the bulk velocity has to be subtracted from the individual particle velocities. For the the bulk velocity of the merging subhaloes we adopt the mean velocity within the central sphere, considering only those particles associated with each progenitor at . This approach avoids a high background contamination, in particular during peri-centre passages. In addition the small volume sphere () allows us to focus on the very central processes. As a test we also computed the evolution of the velocity dispersions based on bulk velocities within spheres resulting in negligible deviations. The red vertical lines depict the moments of the peri-centre passages obtained from Fig. 3.
We find the velocity dispersions within fixed proper radii do not change by more than 20 per cent between the values before and after the merging event. This is valid for the total velocity dispersion displayed in the left panel of Fig. 5 as well as for the velocity dispersions based only on individual progenitor particles on the right. During the first peri-centre passage the velocity dispersions exhibit a momentary increase of per cent. At the subsequent apo centre passage the velocity dispersions recede to the pre-merging values. The dispersions within the sphere drop even slightly below the initial values. At the following peri-centre passage a second peak with substantial lower amplitude is reached. The following oscillations for the total velocity dispersions indicate some relaxation process but a synchronisation with the peri-centre passages is ambiguous. A slightly different picture arises for dispersions based only on the original progenitor particles (right panel of Fig. 5). At least for the central dispersions () the particles descended from the second ranked progenitor show a synchronisation with the peri-centre passages.
The double peak structure in both panels of Fig. 5 in particular for the spheres with intermediate radii resembles the behaviour of the total kinetic energy found by Pearce et al. (1993) who analysed isolated N-body mergers. However, one has to keep in mind that our approach probes the evolution of the mean velocity dispersion along the paths of the progenitors which is not exactly the same as the total kinetic energy of the whole system. Nevertheless, the fact that we find a similar double peak structure reveals that the internal velocity dispersions have a strong impact on the total kinetic energy. The structural similarity of the initial peaks in the left and the right panel of Fig. 5 indicates that the increase in velocity dispersion is mainly caused by an internal acceleration due to the deepening potential well during peri-centre passages. This statement is supported particularly by the evolution of the velocity dispersions within the spheres. As shown in Fig. 3 the distance of the cores is resulting in only a partial overlap of the spheres associated with the two progenitors. Therefore, the enhancement of the total velocity dispersion is based mainly on the original particles of the associated progenitor and should resemble the behaviour in the right hand panel, as it does. However, a slight difference between the evolution of the total velocity dispersions and those based only on original progenitor particles can be seen for almost all initial peaks. The peak associated with the second ranked progenitor (thin lines in the right panel) is slightly higher than the peak for the particles descending from the first ranked progenitor. For the central spheres this trend is more pronounced during the subsequent peri-centre passages, resulting in substantially larger velocity dispersions for the particles descending from second ranked progenitor after total coalescence (thin lines on the right panel of Fig. 5).
Combining the results derived for the evolution of the densities with the findings of this section results in the following picture. After completion of the merging process the densities based on the particles descending from the second ranked progenitor are lowered relative to the densities related to the first ranked progenitor. The velocity dispersions behave in the opposite way, they are higher for the particles descending from the second ranked progenitor. The progenitors have nearly equal masses but different concentrations, which motivates the conclusion that an equal mass merger transfers a larger fraction of the released gravitational energy to the system of lower concentration and/or the energy is distributed amongst fewer particles in the low concentrated system. This behaviour is probably related to the findings by Dehnen (2005) who showed based on the phase space analysis of merging systems that the steepest cusps survive. However, it is not clear whether there exists a correlation between the central slope and concentration (see e.g. Diemand et al. 2004).
3.3 Velocity anisotropy parameter
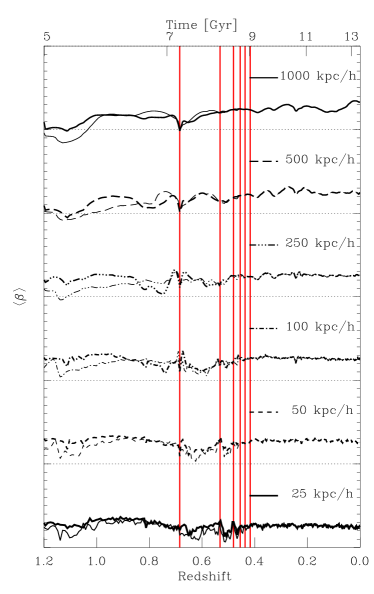
If during the relaxation process the particles of the lower concentrated system are pushed further away from the central regions this may have an impact on the velocity anisotropy of the particles descending from this second ranked progenitor. The left panel of Fig. 6 displays the evolution of the velocity anisotropy parameter , where indicates the tangential velocity dispersion and is the radial velocity dispersion, for all particles within the corresponding spheres. At , the time of the first peri-centre passage of the progenitor cores, the velocities within and appear to be momentary isotropic which is caused by the large tangential contribution of the passing cores and does not reflect the overall behaviour of the velocity fields. For smaller inclusion radii the anisotropy drops during and a short time after the second peri-centre passages. After a stable configuration is achieved with a slightly radial anisotropy and a tendency to more isotopic velocities towards the centre.
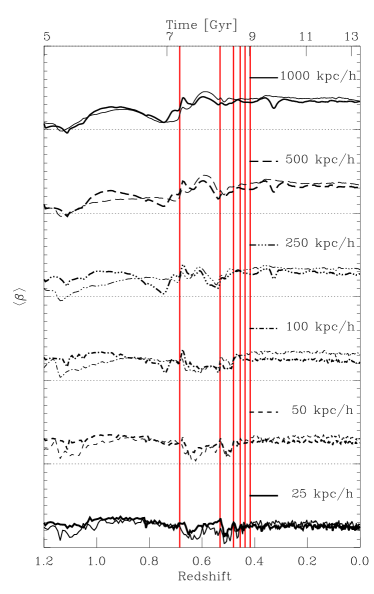
The velocity anisotropy based only on the particles descending from one of the progenitors at (right panel of Fig. 6) support the above discussion of the velocity dispersions. After the final coalescence of the progenitor cores the particles related to the second ranked progenitor show higher radial anisotropies than particles associated with the first ranked progenitor. The analysis of the densities and the velocity dispersions have already revealed that the particles descended from the less concentrated progenitor are more strongly dispersed. To make that happen these particles have to be provided with some additional radial velocity component which is supplied by the gravitational energy released by of the merging systems. The result of this process is an relative increase of the radial anisotropy causing higher values of the parameter.
3.4 Entropy
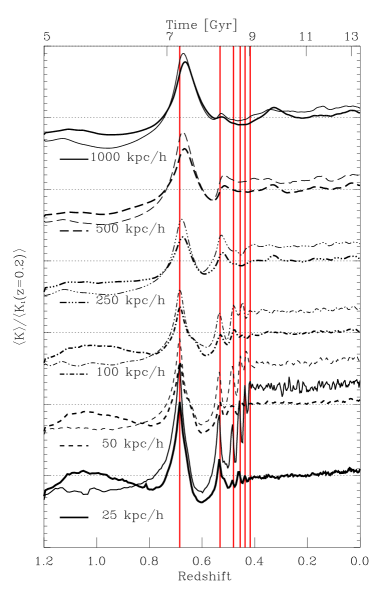

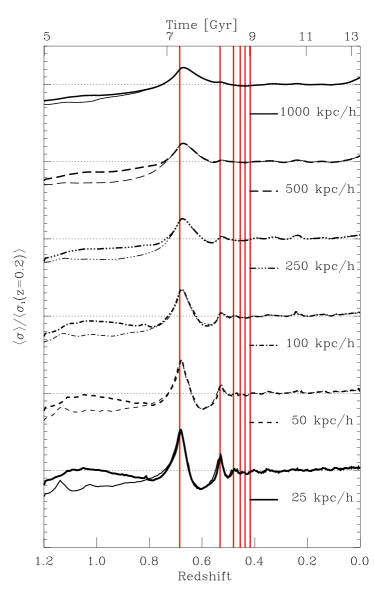
We define the entropy of the DM similar to the entropy of an ideal gas (see e.g. White & Narayan 1987; Navarro et al. 1995; Eke et al. 1998). In analogy to the Sackur-Tetrode equation we write for the specific entropy of the dark matter , where is the DM velocity dispersion and an additive constant is neglected. Following the convention used in the studies of galaxy clusters we define (see also Faltenbacher et al. 2006). The DM specific entropy is closely related to the phase space density (Taylor & Navarro, 2001; Ascasibar et al., 2004).
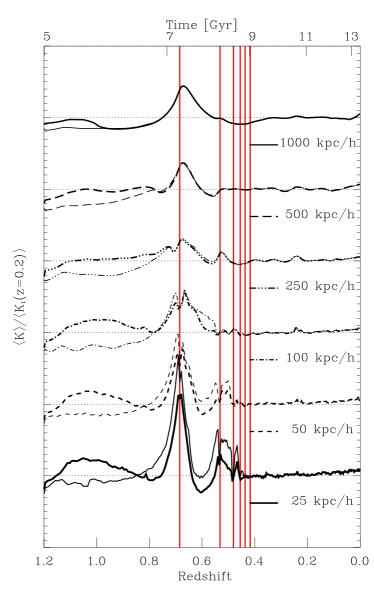
Fig. 7 displays the mean entropies within the listed radii along the tracks of the two most massive progenitors. During the merging event the entropy within all radii rises temporarily. But it is difficult to estimate the change from initial to final entropy since the initial values are ill determined, e.g. the central entropy of the first ranked progenitor (thick lines) shows a maximum value at and drops by per cent before dramatic growth takes place during the first peri-centre passage. In Fig. 8 we show evolution within the density-velocity dispersion plane between and . The open circles indicate the starting point of the tracks and the filled circles give the location at . Attached to both of these points is a dotted line indicating the loci of constant entropy or equivalently phase-space density. The distance between a pair of dotted lines gives the ratios between the final and initial entropies , which range from to for the and the , respectively. This changes are rather small, in particular if one considers the occasionally sever deviations from isentropic behaviour during the active merging phase. Within the sphere initial and final entropies are equal (heavy long dashed line in Fig. 7). This radius may be of particular interest, since it is the largest radius included by the virial radius for all times considered here.
For the 100 and spheres the evolution of the entropies show a clear double-peaked structure at the first peri-centre passage. This feature is most prominent for the sphere. The analysis of the the densities (Fig. 4) revealed that within this sphere the density during the first peri-centre passage increases strongest compared to the behaviour of other spheres. This particular steep density enhancement can counterbalance the increase of the entropy caused by the peaking velocity dispersion.
We have shown that particles descended from the second ranked progenitor build a subset of particles within the final cluster with lower central densities and higher velocity dispersions compared to particles descended from the first ranked, more concentrated progenitor. The combination of these two processes causes a substantial rise in the central entropies for the particles descended from the second ranked progenitor as displayed in Fig. 7. This is a further indication that the central parts of the less concentrated progenitor get heavily disrupted whereas the more concentrated progenitor is less affected by the merging event.
3.5 Central Potential
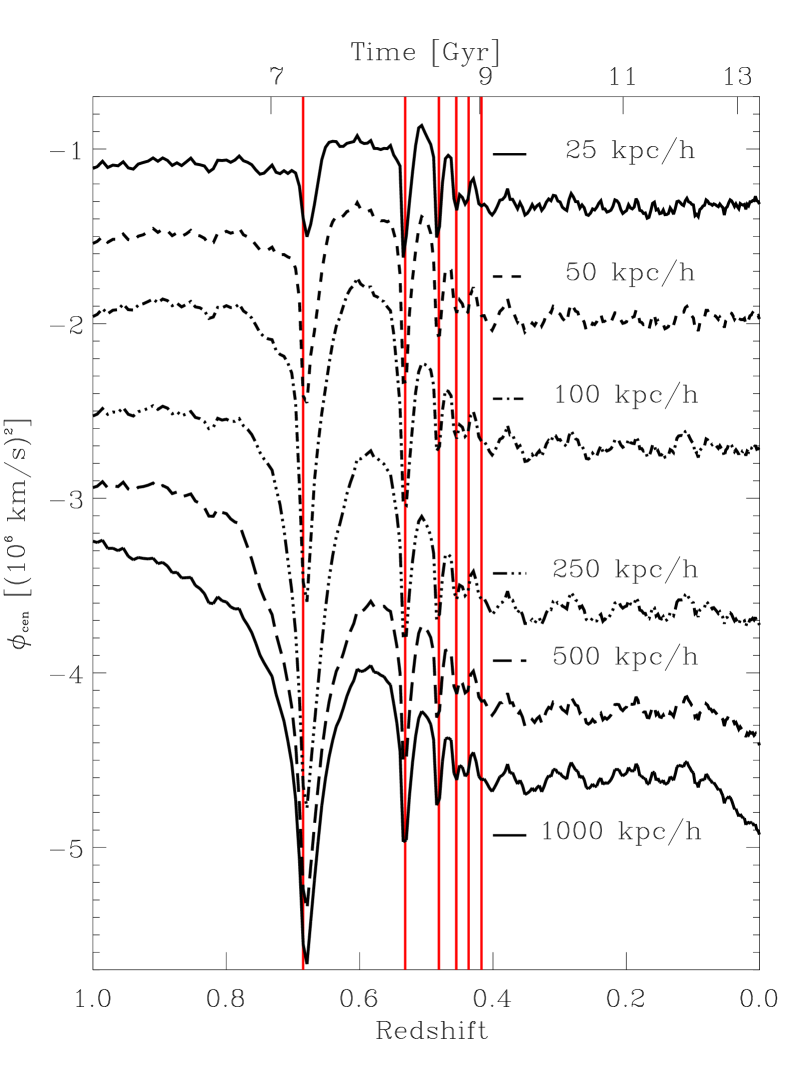
We compute the contribution of the various spheres to the central potential by direct summation.
| (1) |
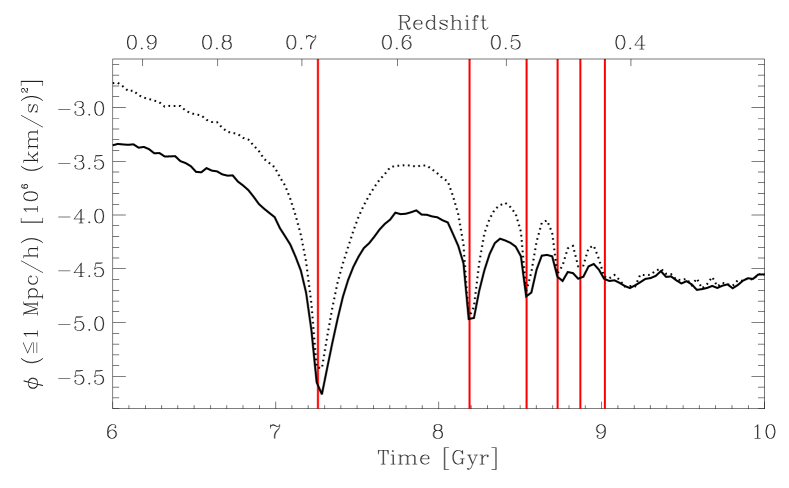
Here, is the centre of the progenitor, and are the mass and the position of the th particle within the inclusion radius and is the gravitational constant. The evolution for the central potential of the most massive progenitor is displayed in Fig. 9. In order to see how the evolution of the potential is affected by occasional very central passages of single particles we have computed the potential of the particle which closest to the centre for the given moment. We find that the contribution of the most central particle to the potential is on average with maximal amplitudes of . Therefore, occasional central passages of single particles do not seriously affect the overall evolution of the gravitational potential. The oscillatory behaviour seen in the evolution of the density and the velocity dispersion is also apparent in the central potential. Since the potential based on the results in the most pronounced variations we compare in Fig. 10 the central potentials along the tracks of the two progenitors based on the sphere. Obviously the central potential of the second ranked progenitor undergoes stronger variations during the oscillatory relaxation phase. The six peri-centre passages based on the core distances (Fig. 3) are clearly visible in the evolution of the central potential. The time interval of the later oscillations is .
4 Summary and Discussion
We have analysed the merging of a cluster-sized dark matter haloe focusing on the evolution of the density and the velocity dispersion within fixed proper radii. This approach is complementary to the more common analysis based on the scaling relations for dark matter haloes. Whereas the latter emphasises the self similar nature of gravitationally collapsed systems, the former provides insight into the processes at fixed scales and may help to understand the cause of the self similarity. Our main results are: (1) About s elapse from the first encounter of the progenitor outskirts to the final coalescence of their central cores. Within the s between the first peri-centre passage and the final core merging six peri-centre passages take place. During that process the periods decrease by a factor of ten from s to s. (2) The central densities of the merging progenitors peak at each peri-centre passage and are most pronounced at the first one. The density enhancement is caused by the overlapping volumes of the subhaloes but also by the contraction due to the deepening of the potential well during a peri-centre passage. (3) After the merger is completed () the densities and the velocity dispersions within the fixed proper radii keep roughly constant. The increase for larger radii at is associated with an ongoing intermediate merger as discussed in § 2. In agreement with Romano-Diaz et al. (2006) we find that the properties of the dark matter haloe change rapidly during merging events but remain constant during phases of passive evolution. (4) The ranking of the progenitor concentrations determines the final distribution of the particles. Less concentrated haloes get more dispersed and show higher radially anisotropic velocity dispersions.
Finally, we briefly discuss the impacts of the oscillatory relaxation process of the collisionless matter on the baryonic component. It is of interest to consider the possibility that enhanced AGN activity in the cluster-centred galaxies may be stimulated by the large oscillations of the haloe potentials during a major cluster merger. We note that the period of relaxation oscillations for our merging cluster, yrs, is similar to the duty cycle observed in AGNs (Voit & Donahue, 2005), although only a small fraction of AGNs reside in massive clusters. Nevertheless, to explore this idea, we performed a simple gasdynamical calculation to determine how much additional radiative cooling occurs when the merging potentials are deepened, compressing the hot cluster gas. For this purpose we set up a traditional quasi-steady state cluster cooling flow in a potential of mass with typical concentration . The gas temperature at large radii, keV, was chosen according to the observed cluster relation (Arnaud et al., 2005) and the initial (hydrostatic) gas density was adjusted until the baryon mass matched the cosmic value at the virial radius. The relaxed steady state cooling flow that results closely resembles the observations of Vikhlinin et al. (2006) and has a central cooling rate of yr-1 (assuming abundance 0.4 solar). The potential was then set into sinusoidal oscillations with period Gyr and an amplitude similar to that of Figure 10 by sinusoidally varying the concentration between and . During these oscillations, the cooling rate near the centre of the flow varied with an amplitude of only 7 per cent, much less than the unperturbed steady state value which is at least times larger than allowed by X-ray observations (Peterson et al., 2001). We conclude that the additional radiative cooling stimulated by the oscillating merger potentials is negligible.
Perhaps a more fruitful approach along these lines is the possibility that galaxies (and large black holes) orbiting about the cluster core can be processed by dynamical friction into the central galaxy/black hole during the relaxation process. The acceleration due to dynamical friction depends on the mass and the velocity of the orbiting object and the density of the ambient material. By setting the velocity equal to the mean dispersion , we see that the time scale for dynamical friction . During apo-centre passages when the dark halo entropy passes a minimum, objects orbiting near the cluster-centred galaxy may efficiently reduce their angular momentum, increasing the chance of a capture by the central black hole during the subsequent contraction phase. It is conceivable that such events, stimulated by the global merger, could result in enhanced AGN activity with a period imprinted by the dark matter oscillations.
Acknowledgements
This work has been supported by NSF grant AST 00-98351 and NASA grant NAG5-13275 for which we are very grateful. The simulations were performed at the Leibniz Rechenzentrum Munich.
References
- Arnaud et al. (2005) Arnaud M., Pointecouteau E., Pratt G. W., 2005, A&A, 441, 893
- Ascasibar et al. (2004) Ascasibar Y., Yepes G., Gottlöber S., Müller V., 2004, MNRAS, 352, 1109
- Boylan-Kolchin & Ma (2006) Boylan-Kolchin M., Ma C.-P., 2006, ArXiv Astrophysics e-prints, astro-ph/0608122
- Clowe et al. (2006) Clowe D., Bradac M., Gonzalez A. H., Markevitch M., Randall S. W., Jones C., Zaritsky D., 2006, ArXiv Astrophysics e-prints astro-ph/0608407
- Conselice et al. (2001) Conselice C. J., Gallagher III J. S., Wyse R. F. G., 2001, AJ, 122, 2281
- Dehnen (2005) Dehnen W., 2005, MNRAS, 360, 892
- Diemand et al. (2004) Diemand J., Moore B., Stadel J., 2004, MNRAS, 353, 624
- Eke et al. (1998) Eke V. R., Navarro J. F., Frenk C. S., 1998, ApJ, 503, 569
- Faltenbacher et al. (2006) Faltenbacher A., Hoffman Y., Gottloeber S., Yepes G., 2006, ArXiv Astrophysics e-prints astro-ph/0608304
- Klypin et al. (1999) Klypin A., Gottlöber S., Kravtsov A. V., Khokhlov A. M., 1999, ApJ, 516, 530
- Klypin et al. (2001) Klypin A., Kravtsov A. V., Bullock J. S., Primack J. R., 2001, ApJ, 554, 903
- Kravtsov et al. (2004) Kravtsov A. V., Gnedin O. Y., Klypin A. A., 2004, ApJ, 609, 482
- Kravtsov et al. (1997) Kravtsov A. V., Klypin A. A., Khokhlov A. M., 1997, ApJS, 111, 73
- Nagai et al. (2006) Nagai D., Vikhlinin A., Kravtsov A. V., 2006, ArXiv Astrophysics e-prints astro-ph/0609247
- Navarro et al. (1995) Navarro J. F., Frenk C. S., White S. D. M., 1995, MNRAS, 275, 720
- Navarro et al. (1997) Navarro J. F., Frenk C. S., White S. D. M., 1997, ApJ, 490, 493
- Pearce et al. (1993) Pearce F. R., Thomas P. A., Couchman H. M. P., 1993, MNRAS, 264, 497
- Pearce et al. (1994) Pearce F. R., Thomas P. A., Couchman H. M. P., 1994, MNRAS, 268, 953
- Peterson et al. (2001) Peterson J. R., Paerels F. B. S., Kaastra J. S., Arnaud M., Reiprich T. H., Fabian A. C., Mushotzky R. F., Jernigan J. G., Sakelliou I., 2001, A&A, 365, L104
- Romano-Diaz et al. (2006) Romano-Diaz E., Faltenbacher A., Jones D., Heller C., Hoffman Y., Shlosman I., 2006, ApJ, 637, L93
- Spergel et al. (2006) Spergel D. N., Bean R., Dore’ O., Nolta M. R., Bennett C. L., et al. 2006, ArXiv Astrophysics e-prints astro-ph/0603449
- Taylor & Navarro (2001) Taylor J. E., Navarro J. F., 2001, ApJ, 563, 483
- Vikhlinin et al. (2006) Vikhlinin A., Kravtsov A., Forman W., Jones C., Markevitch M., Murray S. S., Van Speybroeck L., 2006, ApJ, 640, 691
- Voit & Donahue (2005) Voit G. M., Donahue M., 2005, ApJ, 634, 955
- White & Narayan (1987) White S. D. M., Narayan R., 1987, MNRAS, 229, 103