Deep Submillimeter Observations of Two Lyman- Emitting Galaxies at 6.5
Abstract
We present deep submillimeter imaging of two spectroscopically confirmed 6.5 Lyman- emitters (LAEs) in the Subaru Deep Field. Although we reach the nominal confusion limit at 850µm, neither LAE is detected at 850µm nor 450µm, thus we conclude that the LAEs do not contain large dust masses ( 2.3 108 M⊙ and 5.7 108 M⊙). The limit on their average LFIR/LUV ratios ( 35) is substantially lower than seen for most submillimeter selected galaxies at 3, and is within the range of values exhibited by Lyman-break galaxies. We place upper-limits on their individual star formation rates of 248 M⊙yr-1 and 613 M⊙yr-1, and on the cosmic star formation rate density of the 6.5 LAE population of 5.010-2 M⊙yr-1Mpc-3. In the two submm pointings, we also serendipitously detect seven sources at 850m that we estimate to lie at .
Subject headings:
galaxies:formation – submillimeter – galaxies, starburst – galaxies, high-redshift1. Introduction
Deep narrow-band imaging at optical wavelengths has identified a sizable number of star-forming galaxies at 6.5 through searches for strong Lyman- (Ly) emission (Ajiki et al., 2003; Kodaira et al., 2003; Hu et al., 2002; Rhoads et al., 2004; Taniguchi et al., 2005). At this redshift, the universe was less than 109 years old and these early systems provide insight into many important aspects of the formation of galaxies at very early times. Although the sample size of 6 galaxies is increasing through the efforts of large surveys, most efforts are focused on optical and near-infrared observations and follow-up studies at longer wavelengths remain scarce.
The detection of 6.5 star-forming galaxies at submm or far-infrared wavelengths would have a number of important implications. Firstly, detection at these wavelengths requires that these young systems contain substantial amounts of dust and, at 109 years after the Big Bang, would provide current dust production models with strong constraints. Although large dust masses have been found in high redshift () quasars and radio galaxies (e.g. Omont et al., 2001; Priddey & McMahon, 2001; Archibald et al., 2001; Robson et al., 2004), quasar winds offer an explanation for the production of their dust (Elvis, Marengo, & Karovska, 2004); however, such a mechanism cannot be invoked for pure starburst galaxies, the Lyman emitters (LAEs). Because the age of the universe at is comparable to the evolutionary timescales of low-mass stars, evolving stars cannot be the primary source of dust. Rather, these star-forming galaxies can only manufacture dust via grain formation in Type II supernovae (SNe) (Todini & Ferrara, 2001; Morgan & Edmunds, 2003); even so, a top-heavy Initial Mass Function and very high star formation efficiency also must be invoked.
Secondly, quantifying the amount of dust in galaxies at 6.5 is important for measuring their individual star formation rates, bolometric luminosities, and by extension, the cosmic star formation rate density (SFRD) at 6. The SFRD has now been measured for large samples of galaxies to 5 and thus far does not exhibit any clear sign of turning over (Lilly et al., 1995; Madau et al., 1996; Connolly et al., 1997; Steidel et al., 1999; Giavalisco et al., 2005); however, this must occur somewhere in the relatively short amount of time between 5 and the epoch of reionization. Currently the majority of measurements at 6 rely on a relatively small number of emission line galaxies found through narrow-band optical searches for Ly emission (Hu et al., 2002; Rhoads et al., 2004; Taniguchi et al., 2005). While these studies measure a SFRD that is apparently an order of magnitude less than at 5, their accuracy is hindered by small numbers, uncertainties in the completeness corrections, and the unknown amount of dust extinction at .
The unknown correction for dust at 6 is potentially substantial, as illustrated by recent submm surveys (e.g., Smail, Ivison, & Blain, 1997; Lilly et al., 1999; Webb et al., 2003b; Chapman et al., 2005) that show the correction due to dust is large at 3: the dust-uncorrected optical/UV estimates of the SFR are one to two orders of magnitude lower than the infrared estimates, and the total star formation in rare, infrared-selected objects is comparable to that seen in large populations of optically-selected galaxies (Chapman et al., 2005). Thus, if there exists a population of heavily dust-obscured star-forming galaxies at 6.5, infrared observations are crucial for measuring their total individual and integrated star formation rates.
One might assume that because dust is an efficient absorber of Ly photons, the existence of strong Ly emission in these systems precludes the presence of significant amounts of dust. However, this does not empirically appear to be the case: thus far, % of the spectroscopic redshifts for submm-detected galaxies are, in fact, derived from strong Ly in emission (Chapman et al., 2005). Only a small number of LAEs at 2 have been observed in the submm, and though none of these have been detected (Barger, Cowie, & Sanders, 1999; Smail et al., 2003) we note that many of the larger, extended Lyman- blobs (LABs) have been detected in the submm and/or infrared (Chapman et al., 2001; Geach et al., 2005; Colbert et al., 2006).
Here we extend for the first time the search for submm emission to two LAEs at = 6.5. We are aided by the negative -correction at submm wavelengths that results in equal sensitivity for detecting dust-obscurred star formation at as at . The two targeted LAEs were discovered through narrow band imaging at =9196Å in the Subaru Deep Field (SDF; Kodaira et al., 2003), and have been spectroscopically confirmed to lie at 6.541 (SDF-1) and 6.578 (SDF-2). We present results at 850 and 450µm for both LAEs; while neither object is detected, we attempt to place upper limits on the properties of the LAE population using our deep submm observations. The paper is organized as follows: in §2 we describe the observations and data analysis; §3 presents the derived properties of the LAEs; and §4 a brief analysis of the serendipitous detections. Our conclusions are in §5. We assume an =0.3, =0.7 cosmology with H∘=70 km/s/Mpc throughout.
2. Data and Analysis
2.1. Observations and Data Reduction
We observed the objects using the Submillimeter (submm) Common-User Bolometer Array (SCUBA; Holland et al., 1999) on the James Clerk Maxwell Telescope (JCMT) over eight partial nights in 2003, 2004, 2005. We obtained data at 850µm and 450µm simultaneously, but due to beam instabilities and poor sky transmission the 450µm data are of poorer quality than the 850µm data. To fill in the under-sampled sky, SCUBA was stepped through a regular 64-point jiggle pattern and sky flux was removed to first order by employing a 3-point chop with a chop-throw of 30″. The chop position angle was held constant in right ascension which results in a characteristic negative-positive-negative beam shape on the final map for real point sources. Telescope pointing was checked every 1.5 hours, and sky opacity was monitored through sky dips every 1.5-3.0 hours and in real time along the line of sight using the JCMT water vapor meter when operational.
The data were reduced using a combination of general SURF (Jenness & Lightfoot, 1999) routines and custom IDL programs written by ourselves. We first applied standard flat-fielding and extinction corrections. Although the 3-point chop employed by SCUBA removed sky to first order, residual sky flux remained; SURF attempts to remove this through a subtraction of a single median or average sky measurement for each second of measurement. To improve on this, we subtracted a sky plane fit to each second of the data time streams and all bolometers, with the bolometers weighted by their individual noise. In a single second of integration, any structure in the maps is only due to sky flux and thus this does not add any systematic offset. A comparison of images produced with and without this method indicates a decrease in the noise of 30%. Noise spikes were then iteratively removed using a simple standard deviation clipping routine (at 3 using the entire array) and the data were regridded onto an astrometrically calibrated map using standard Gaussian weighting.
Total integration times (including the off-source chop time) were 47ks for SDF-1 and 19ks for SDF-2. The final images have central (unsmoothed) noise values of rms=1.2mJy/beam (SDF-1) and rms=1.6mJy/beam (SDF-2); thus both pointings reach depths close to the nominal confusion limit at 850. Note that the noise does not scale perfectly as due to weather differences and night to night variations in the noise properties of the bolometer array. The jiggle-pattern and rotation of the Nasmyth-located SCUBA on the sky results in uneven coverage of the sky, with the center of the image receiving more integration time than the outer edges and hence the centers of each image, where the LAEs are located, are the deepest points on each map.
2.2. Source Detection
To improve point source recovery, we have employed the source detection and extraction technique of Eales et al. (2000) and Webb et al. (2003b). In short, the map is iteratively cleaned using a beam template generated from the point source calibration maps. Sources are detected by convolving the cleaned map with the beam template. Such a technique takes advantage of the negative-positive-negative pattern that real sources exhibit, but that noise spikes do not, and improves the separation of blended sources.
The noise as a function of position in each map was determined in the following way. We produced fake bolometer time-streams, drawn from the real data using a bootstrapping technique. These were passed through our analysis pipeline to produce 1000 full map realizations and the noise is taken to be the rms variation of each pixel in these maps. This technique agrees well with Monte Carlo simulations of the noise, assuming Gaussian statistics (Webb et al., 2003b, 2005).
2.2.1 SDF-1 & SDF-2
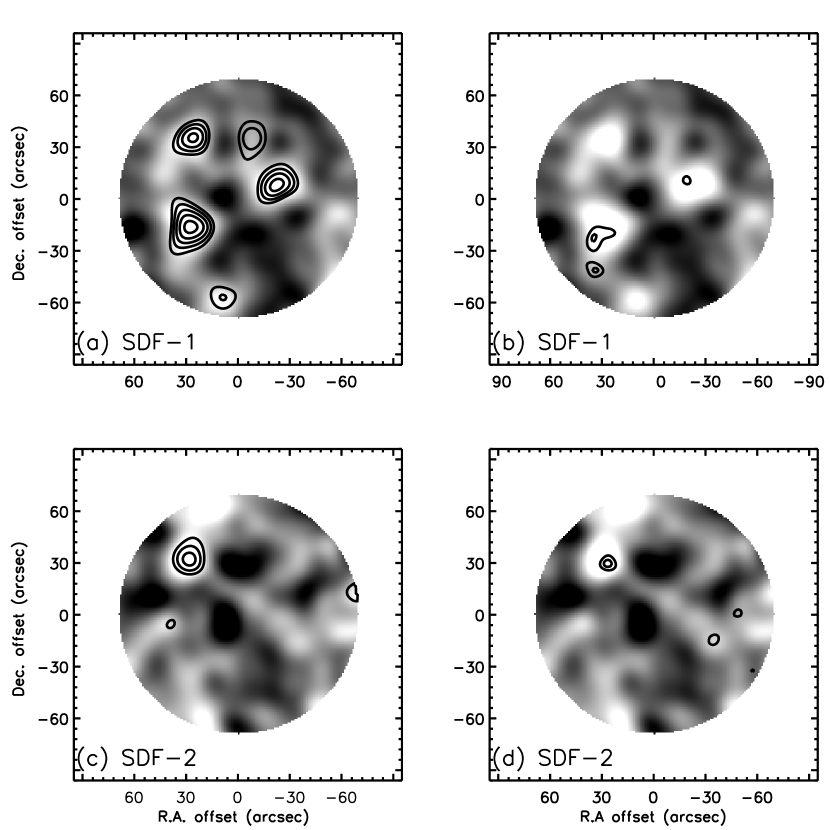
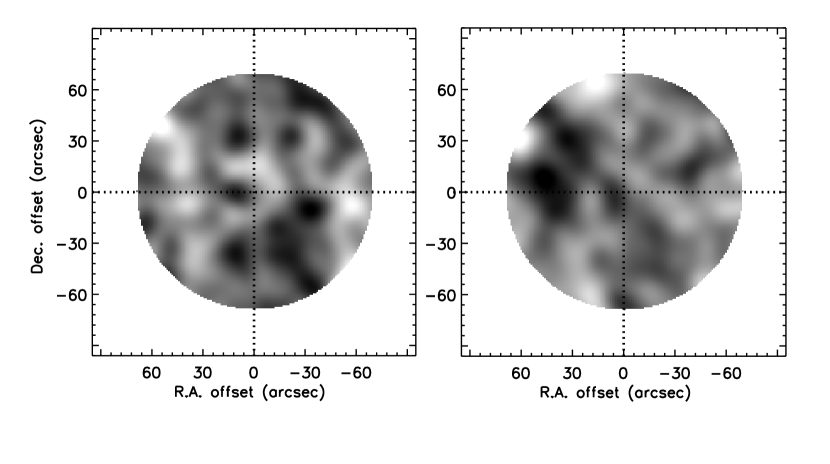
In Fig. 1, we show the two LAE fields at 850µm after smoothing with a 14″ Gaussian; the LAEs are at the center of each image. Overlaid are the signal-to-noise ratio (S/N) contours resulting from the iterative cleaning procedure for the 850µm and 450µm maps; the 450µm contours are shown over the 850µm grey-scale map to aid in positional comparison. Neither image contains significant flux at the locations of the LAEs. Fig. 2 shows the two 850µm maps after the 3.5 sources have been cleaned and removed, with the LAE position marked and the flux at this position listed in Table 1.
Although the maps have a mean flux of zero, there is residual positive and negative structure which is not only due to noise but also real structure in the extragalactic submm sky below the confusion limit of SCUBA. This combination of noise and source confusion results in an offset between the true and recovered positions of objects; simulations show that sources at 3.5-4 are rarely recovered at their original location and can be shifted up to 8″ away ( 90-95 percentiles Webb et al., 2003b; Ivison et al., 2005). Thus, if either of the LAEs exhibited significant submm flux, one would expect it to be offset from the known position by a few arcseconds; however, there are no significant sources within any reasonable search radius of the LAEs.
To determine robust upper limits on the observed flux of the LAEs, we placed and recovered sources at the LAE position in each map, following the same cleaning procedure described above. Fake sources were deemed recovered if they were detected at 3 in the cleaned map within 8″ of the original input position. For the SDF-1 field, this analysis indicated a detection threshold that was in good agreement with the limit expected from the noise map. Although the LAE position is coincident with the off-beam of a bright (3.8mJy) source, we were able to separate the contributions from this and the input (fake) source and recover the fake source at 3 within 8″ of the input position, provided the input flux was 1.5mJy.
The SDF-2 map is shallower than SDF-1 and appears to suffer from greater source confusion in its central region. Although the LAE is not confused with a bright neighbor, structure beneath the 3 detection limit makes it difficult to recover flux at the LAE position. Specifically, it lies in a negative region of the map (which is not statistically significant), and although this minimum could be the off-beam of one or more faint neighbors, they lie below the confusion limit and thus cannot be cleaned from the map. Our simulations indicate that we are unable to recover sources at this position above 3 below an input flux of 3.8mJy to within 8″ of the input position. These recovery limits are listed in Table 1 for 850m and 450m where both were determined in the manner described above.
2.2.2 Serendipitous Detections
Although the LAEs are not detected at submm wavelengths, the deep pointings reveal multiple sources near the LAEs; the sources detected in the two fields are listed in Table 2. SDF-1 contains five sources detected above 3.5 at 850m while SDF-2 contains two such sources. Of these seven 850m sources, two are also cleanly detected at 450m with S/N 3.5 and positional offsets of 4.0. A third 850m source has two possible 450m counterparts: a 4.0 detection 10 from the 850m position, or a 2.8 peak offset by 5.3. Because a 10″ offset between the 450 and 850µm positions is statistically unlikely, we assume that the closer 2.8 peak corresponds to the 450m emission for this source; however, we note that none of our final conclusions are greatly altered if the more distant object was the correct counterpart. Also listed in Table 2 are three additional sources detected only at 450m (all at 3.5).
3. Lyman Emitting Galaxies at
3.1. Star Formation Rates
A galaxy’s far-infrared luminosity is due to thermally radiating dust and is correlated with the galaxy’s current rate of star formation, provided the energy contribution from an active galactic nucleus (AGN) is negligible (Kennicutt, 1998; Bell, 2003). Locally, the most intense starburst galaxies are also the most luminous in the infrared; however, these systems do not show a simple relation between infrared excess and UV slope (the IRX- relation; Goldader et al., 2002). Therefore extrapolating from the UV to a total Lbol and corresponding star formation rate is not trivial, and in many cases it may not even be possible.
This situation is mirrored at high redshift ( 2-3) where luminous (L 1011 L⊙), dusty starbursts are more prevalent (e.g., Borys et al., 2002; Webb et al., 2003b). For such systems, the rest-frame UV estimated SFR can be two orders of magnitude less than that implied by the rest-frame far-infrared emission (Chapman et al., 2005). Far-infrared imaging offers an independent and, for the most luminous systems, a more accurate measure of their total star formation rates and bolometric luminosities. Moreover, because of the flat flux-redshift relation for infrared luminous galaxies at 850m beyond 0.5, such systems are equally detectable at 6 as they are at 1, unlike optical and near-infrared observations.
However, converting infrared luminosities to star formation rates suffers from a number of uncertainties. While the empirically measured local SFR-LIR relation does hold over four orders of magnitude in LIR, the scatter about this relation is approximately a factor of two. At high redshifts, the scatter could be much greater and/or systematically offset from the local relation as uncertainties due to differences in the Initial Mass Function (IMF; Baugh et al., 2005), differences in dust properties such as temperature or emissivity, and the contamination from AGN increase. This is especially relevant at the redshifts considered here where we are beginning to probe the very first generation of stars and dust.
With these caveats in mind, we have employed the following method to convert our limit on the observed to a star formation rate. We adopt a modified black-body spectral energy distribution (SED) with a temperature of 36K, a dust emissivity of =1.5. Following Blain, Barnard, & Chapman (2003) we apply a Wien correction short-ward of 80m with a slope of =2.9. These parameters are chosen to match the measurements of the submillimeter luminous population at 3 (Chapman et al., 2005), but they are also in good agreement with the results from local ULIRG galaxies (Dunne et al., 2000; Blain, Barnard, & Chapman, 2003). Using this SED, we calculate LIR (i.e., L(8-1000m)) for the two LAEs and use the relation from Bell (2003) to convert this to a star formation rate. The results are included in Table 2. Differences in the assumed temperature of 30% (the inter-quartile range of Chapman et al.) result in a difference in the inferred star formation rates of 70%, in the sense that assuming hotter dust results in larger a infrared luminosity and therefore a larger inferred star formation rate.
These SFR limits can be directly compared to those determined through optical measurements. The average dust-uncorrected Ly-estimated rate for the two galaxies is 7 M⊙yr-1, and that estimated from the UV continuum is slightly higher 22 M⊙yr-1 (Kodaira et al., 2003). While our average upper-limit of 430 M⊙yr-1 is an order of magnitude larger than this estimate, it is still a useful first constraint on the infrared properties of these systems; recall the results of the submm and radio studies at 3 that reveal star formation rates in excess of 1000 M⊙yr-1 in systems for which the UV prediction is 10 M⊙yr-1 (Chapman et al., 2005). The two LAEs discussed here are definitely not members of such a luminous population.
3.2. Dust Content
Our deep submm imaging offers a unique opportunity to constrain the mass of dust present in early starburst galaxies, a measurement that has thus far only been possible at these redshifts for infrared luminous quasars (Isaak et al., 2002; Priddey et al., 2003). Using the same parameters we adopted in §3.1 (T = 36K, = 1.5), we calculate the dust mass following Hildebrand (1983):
| (1) |
where is the dust emissivity, is the rest-frame frequency, and Bν is the Planck function at a temperature T. Following Hildebrand (1983), we adopt = 1.875 m2kg-1 and scale with wavelength by . The results (see Table 2) are consistent with the dust mass of the lensed Lyman-break galaxy MS 1512-cB58 which is roughly half the value of our upper limits for similar dust parameters (Sawicki, 2001).
Thus far, quasars are the only submm-detected systems that are confirmed to lie at 5-6 and SED arguments suggest that their submm luminosity is dominated by thermally emitting dust rather than by non-thermal emission from the AGN (Priddey et al., 2003). The dust mass estimates of the quasars range from a factor of 2 to 10 higher than our upper limits (for the same dust parameters). Unless the dust temperature of the LAEs is much hotter than for AGN, we would have detected objects with comparable dust masses in our data. The lower dust content of the two LAEs is consistent with the recent mid-infrared results of Chary, Stern, Eisenhardt (2005) who report evidence for Av = 1.0 mag of dust extinction in a single 6.5 LAE, a value that is in the range of normal galaxies (Choi et al., 2006).
While a positive submm detection for either LAE would have provided dust formation models with further empirical constraints, the non-detections discussed here are unfortunately ambiguous. The existence of large dust masses in these LAEs would raise the important question of how large amounts of dust can form in the time between the formation of the first objects and . Although the two LAEs have distinctly less dust than the submm detected 5 quasars, the 2-3 SCUBA population, and many of the 2-3 Ly blobs, we cannot constrain them to be less dusty than present-day normal starburst galaxies.
The lack of a detection for either systems raises the following question: are the LAEs even old enough to have built up a sizeable dust reservoir through stellar evolution? Perhaps large quantities of dust exists only in the oldest systems at 6 and/or those for which non-stellar dust production mechanisms are available: i.e., quasars. The Ly equivalent-widths of the LAEs of 100-300Å (with uncertainties of 50%) imply ages of 107 years (Malhotra & Rhoads, 2002; Charlot & Fall, 1993), and this is too young an age for large amounts of dust to have been produced by any known mechanism. Low mass stars have not had sufficient time to evolve and even supernovae models have difficulty producing dust in such young objects (Todini & Ferrara, 2001).
Still, such large Ly equivalent widths have been measured for members of the submm detected population at 2-3 (Chapman et al., 2003). These systems clearly have large dust masses but their Ly EWs imply similar ages to the LAEs. Thus while the Ly EW may be a reasonable indicator of the age of the current starburst, it cannot provide complete information on the total star formation and dust production history of a galaxy. If the star formation histories of the 6.5 LAEs are extended over the first Gyr of the universe significant dust mass cannot be ruled out on the basis of the age of the current starburst.
3.3. Comparison to Lower Redshift Populations
Using the submm upper-limit on the LAEs of LL⊙ results in an upper-limit on the LFIR/LUV ratio of (Kodaira et al., 2003). Our limit on the LFIR/LUV ratio is substantially lower than the values of that are observed for the submm-luminous population at (Chapman et al., 2005). Rather, a LFIR/LUV ratio of is within the range of values exhibited by Lyman-break galaxies of LFIR/L 10 (Adelberger & Steidel, 2000; Webb et al., 2003a; Goldader et al., 2002); note that at , LAEs make up % of the LBG population (Shapley et al., 2003).
In contrast to the LAEs, many of the extended Ly emitters at lower redshifts, the so-called Ly Blobs (LABs), are infrared bright and have been detected by SCUBA or, more recently, at 24m by the Spitzer space telescope. In Fig. 3, we compare the Ly luminosities to the bolometeric luminosities (assuming L Lbol) of the two 6.5 LAEs and the lower redshift, infrared detected LAEs, as discussed in Geach et al. (2005) and Colbert et al. (2006). We divide the points into highly extended (diameter 50 kpc) and compact (diameter 50 kpc) objects. There may be a weak tendency for the most extended and Ly luminous LABs to have the highest infrared inferred bolometric luminosities, though note that two of the LABs with LLyα 1043 erg s-1 have Lbol comparable to the most extended and luminous LABs. The LAEs discussed here are small ( 4 kpc) with LLyα comparable to the smaller IR bright LABs, but their Lbol are at least an order of magnitude lower.
A difference in the Lbol of different Ly emitting systems, assumes however that all of the objects have the same dust temperature, and given the large differences in the extent of their Ly emission this may not be the case. If the spatial extent of the dust scales with that of the Ly emission the temperature of the dust may also vary, such that the far-infrared flux of larger Ly systems is dominated by cold diffuse dust, while the compact systems are dominated by similarly compact hot dust. Given the same intrinsic source luminosity, 850 measurements are biased toward cold dust and thus would not detect the hotter compact systems; that is, adopting a temperature which scales with source size could reduce or remove the trend in Fig.3 for the 850µm measurements. However, while this might explain the trend seen for the 850 detected objects, such an effect cannot account for the properties of the 24 detected systems, which appear to follow the same trend. For these objects Lbol is calculated from the rest-frame mid-infrared which does not suffer from the same bias as the 850m data, and thus the smaller LAEs may truly be lower luminosity systems.
An alternative explanation for the range in Lbol lies in the physics driving the intense energy production. Locally, luminous and ultraluminous infrared galaxies (U/LIRGs) are set apart from normal galaxies by their high merger rate and their tendency to host AGN, especially at the high luminosity end (see Sanders & Mirabel (1996) for a review). In these systems a major gas rich merger appears to be the trigger for both star formation and AGN activity (e.g. Mihos & Hernquist, 1996; Barnes & Hernquist, 1996). The preponderance of AGN and/or merger signatures persist in infrared luminous systems at high-redshift such as the SMGs (Alexander et al., 2003; Webb et al., 2003b; Conselice et al., 2003) and some of the galaxies associated with LABs (e.g., Smail et al., 2003; Chapman et al., 2005; Weidinger et al., 2005; Dey et al., 2005; Colbert et al., 2006). Infrared faint systems on the other hand, such as the SDF LAEs and the bulk of the LBG population (Webb et al., 2003a; Huang et al., 2005) do not, as a population, exhibit such properties (Steidel et al., 1996; Huang et al., 2005; Lehmer et al., 2005). This has lead many authors to conclude that the violent infrared luminous phase of galaxy evolution is induced through gas rich mergers, and thus systems such as the LAEs studied here are infrared-faint because they are not currently experiencing such an event.
3.4. Star Formation Rate Density
Using our SFR upper-limit and the luminosity function of LAEs at 6.5 presented by Kashikawa et al. (2006), we can estimate the maximum contribution by these objects to the total SFRD at this redshift. The two LAEs discussed here have = 7.51042 ergs/s and 430 M⊙yr-1. At this luminosity, they represent the brighter end of the luminosity function as published by Kashikawa et al. (2006) and have a cumulative number density of 210-5 Mpc-3. If we take the SFR upper-limit determined here to be representative of the entire LAE population above L(Ly) = 21042 ergs/s, the depth of the Taniguchi et al. (2005) sample, we calculate their contribution to the SFRD of to be 0.05 M⊙yr-1 Mpc-3. We remind the reader that this limit is based on a 3 upper-limit on the flux, and could systematically shift by 70% for a dust temperature range of 30%. If we assume instead that the SFR scales directly with L(Ly) and integrate over the Ly luminosity function of Kashikawa et al. (2006) to L(Ly = 21042 ergs/s, this changes the upper-limit to 0.03-0.3M⊙yr-1 Mpc-3, where the range corresponds to the range of Schechter parameters describing the number density.
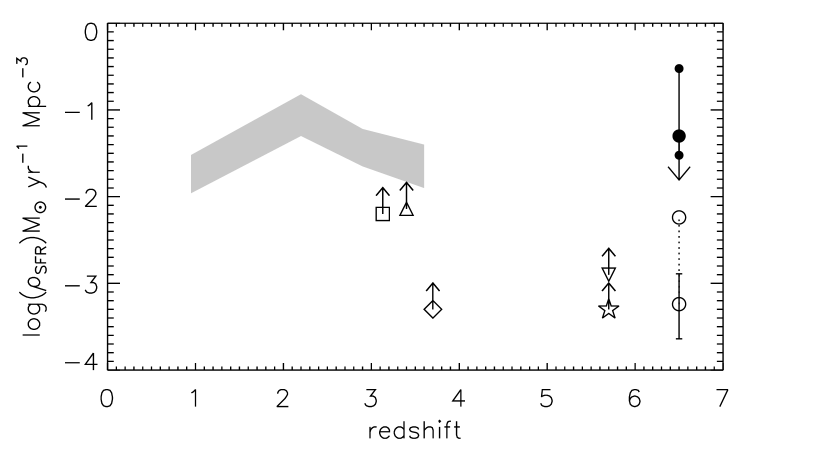
In Fig. 4, we compare our submm limits on the SFRD to measurements from other LAE studies at as well as the submm population at (see figure caption for references). The new 6.5 limits are comparable to that measured for the dust-obscurred population at and thus does not constrain any turnover. However, we stress that these are upper limits on the SFRD from only two LAEs at . Expanding our submm survey to encompass the current sample of LAE candidates in the SDF (58) and, stacking the objects, would increase our depth by a factor of 5, and therefore begin to confirm a decline in the infrared-measured SFRD from to .
4. Serendipitous Submm Sources
Although no detection is made of the LAEs themselves, the submm maps do contain a number of other sources (see Table 2). SDF-1 in particular contains five objects detected above 3.5 at 850µm, all of which are within 1 arcmin of the LAE. This represents a modest excess over the number counts expected from confusion limited blank field surveys of 2 sources (e.g., Webb et al., 2003b). Whether the submm sources are at the same redshift or possibly even at are intriguing possibilities.
At lower redshifts of 3, there is tentative evidence from pair counts and correlation analyses that the submm-luminous population is strongly clustered; indeed, targeted imaging of rare, high-redshift systems such as high-redshift radio galaxies (Stevens et al., 2003) have revealed over-densities of submillimeter sources. To explore the possibility of whether the submm sources near the LAEs belong to a single massive structure, either at the redshift of the two LAEs or in the foreground, we attempt to constrain their redshifts.
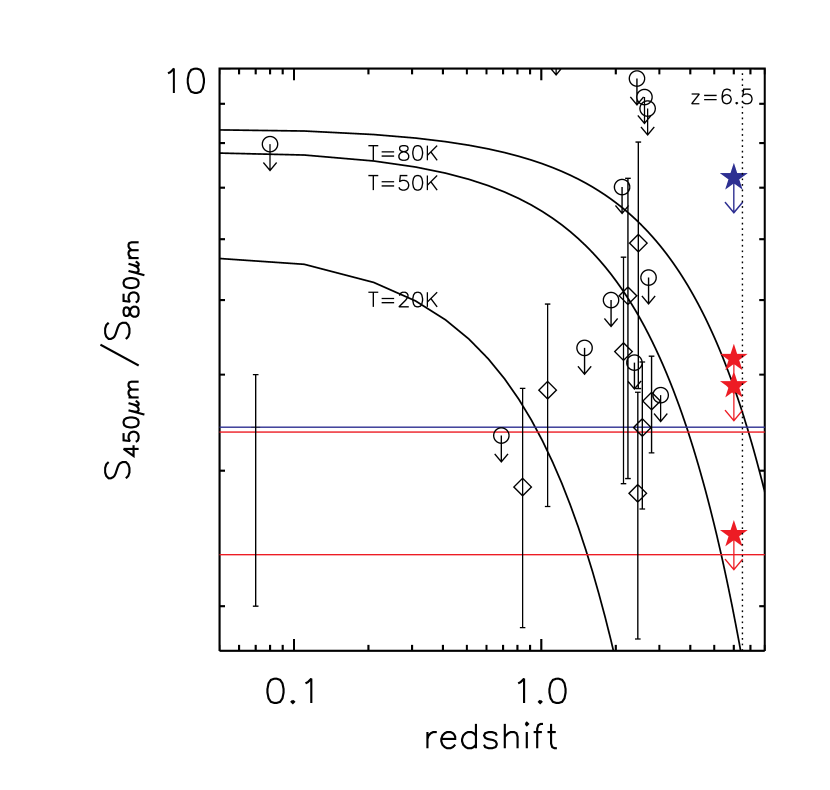
Two of the five 850µm sources in the SDF-1 pointing and one in the SDF-2 pointing are also detected at 450µm, and their submm flux ratios can be used as a very rough indication of their redshift (Fig. 5). Based on these ratios, it is unlikely that the 450m-detected objects lie at the same redshift as the LAEs, unless they have extremely hot dust (80K). Given a reasonable temperature range, the submm sources lie between 15. The upper-limits on the four objects not detected at 450m are consistent with this lower limit of 1.
Considering the large uncertainties on the 450m-850m flux ratios, it is possible that all of the submm sources lie at the same foreground redshift, however, we cannot confirm nor deny this with the current data-set. We have attempted to identify the optical counterparts to these objects using the deep optical imaging available on the SDF, but the number density of optical galaxies is simply too great to allow unambiguous identifications. Such an exercise requires deep Spitzer imaging (Ashby et al., 2006) or radio observations (Ivison et al., 2002). We note that Spitzer imaging of the SDF will become available in the next year, at which point we will attempt to identify the optical/near-IR/mid-IR counterparts to the submm sources to better constrain their redshifts.
5. Conclusions
Quantifying the dust content in starburst galaxies at is important both for determining cosmological properties such as the star formation rate density and for testing stellar evolution models, in particular how quickly large dust masses can form. Using deep submm observations of two spectroscopically confirmed Lyman- emitting galaxies at in the SDF, we show that these starburst galaxies do not contain large quantities of dust ( 4108 M⊙). Our S850μm imaging reaches the confusion limit and enables us to place upper limits on their star formation rates of 430 M⊙ yr-1. The two LAEs are markedly less infrared luminous and less dusty than the submm detected population at 2-3, the extended Ly Blobs at , and the 5 submm detected quasars. Rather, the LAEs have LIR/LUV ratios of 35 that are more in line with the Lyman-break population at lower redshifts.
The submm observations at provide a measurement of the star formation rate density at 6.5 that is independent of the UV determined value. Assuming the two LAEs are representative of the entire 6.5 LAE population and using the Ly luminosity function from Kashikawa et al. (2006), we can place an upper limit on the LAE contribution to the dust enshrouded SFRD at 6.5 of 0.05 M⊙ yr-1 Mpc-3. Although consistent with submm measures of the SFRD at lower redshifts, and therefore unable to constrain a turnover, we stress that this value is extrapolated from only two objects. More observations are clearly needed.
We recognize that because our results are based on only two LAEs, they are tentative. However, our observations have yielded the first constraints on the dust content and total SF rates of such systems, and enable us to begin comparing the LAE galaxies to the growing number of objects to better understand how these early populations overlap. Our deep submm imaging has also revealed a large number of serendipitously detected faint submm sources that are likely to be at . A follow-up study on these objects can provide much needed information on the faint ( 8mJy) submm population.
Further constraints on dust enshrouded star formation at very high redshifts are necessary and can be obtained through infrared observations of larger samples of high-redshift LAEs. Indeed, our program was originally intended to target a larger number of LAEs, but it was cut short due to SCUBA’s unfortunate demise. With the commissioning of SCUBA-2, such a study will again become possible and will provide a more statistically representative sample. In parallel, constraining the counterparts of submillimeter-selected galaxies that do not have radio counterparts in deep radio data will quantify the extent of the high-redshift ( 3) tail of the submillimeter population. Direct detections of dusty star formation at high-redshift, to the level of a few 10M⊙yr-1 (as are currently predicted in the optical), also will be possible in the future with the Atacama Large Millimeter Array.
References
- Adelberger & Steidel (2000) Adelberger, K. L. & Steidel, C. C. 2000, ApJ, 544, 218
- Ajiki et al. (2003) Ajiki, M., et al. 2003, AJ, 126, 2091
- Alexander et al. (2003) Alexander, D.M., et al. 2003, AJ, 125, 383
- Archibald et al. (2001) Archibald, E. N., Dunlop, J. S., Hughes, D. H., Rawlings, S., Eales, S. A., & Ivison, R. J. 2001, MNRAS, 323, 417
- Ashby et al. (2006) Ashby, M., et al. 2006, ApJ, 644, 778
- Barger, Cowie, & Sanders (1999) Barger, A.J., Cowie, L.L., & Sanders, D.B. 1999, ApJ, 518, 5
- Barnes & Hernquist (1996) Barnes, J.E. & Hernquist, L. 1996, ApJ, 471, 115
- Baugh et al. (2005) Baugh, C. M., Lacey, C. G., Frenk, C. S., Granato, G. L., Silva, L., Bressan, A., Benson, A. J., & Cole, S. 2005, MNRAS, 356, 1191
- Bell (2003) Bell, E.F. 2003, ApJ, 586, 794
- Blain, Barnard, & Chapman (2003) Blain, A.W., Barnard, V.E., & Chapman, S.C. 2003, MNRAS, 338, 733
- Borys et al. (2002) Borys, C., Chapman, S.C., Halpern, M., & Scott, D. 2002, MNRAS, 330, 63
- Borys et al. (2004) Borys, C., Scott, D., Chapman, S., Halpern, M., Nandra, K., & Pope, A. 2004, MNRAS, 335, 485
- Chapman et al. (2001) Chapman, S. C., Lewi, G. F., Scotte, D., Richards, E., Borys, C., Steidel, C. C., Adelberger, K. L., & Shapley, A., E. 2001, ApJ, 548, L17
- Chapman et al. (2003) Chapman, S.C., Blain, A.W., Ivison, R.J., & Smail, I.R., 2003, Nature, 422, 186
- Chapman et al. (2004) Chapman, S. C., Scott, D., Windhorst, R.A., Frayer, D.T., Borys, C. Lewis, G.F., & Ivison, R.J. 2004, ApJ, 606, 85
- Chapman et al. (2005) Chapman, S. C., Blain, A. W, Smail, I., & Ivison, R. J. 2005, ApJ, 622, 772
- Charlot & Fall (1993) Charlot, S. & Fall, M. S. 1993, ApJ, 415, 580
- Chary, Stern, Eisenhardt (2005) Chary, R.-R., Stern, D., & Eisenhardt, P. 2005, ApJL in press
- Choi et al. (2006) Choi, P. I., et al. 2006, ApJ, 637, 227
- Clements et al. (2004) Clements, D., et al. 2004, MNRAS, 351, 447
- Colbert et al. (2006) Colbert, J.W., Teplitz, H., Francis, P., Palunas, P, Williger, G.M., & Woodgate, B. 2006, ApJ, 637, L89
- Connolly et al. (1997) Connolly, A. J., Szalay, A. S., Dickinson, M., Subbarao, M. U., & Brunner, R. J. 1997, ApJ, 486, L11
- Contini & Contini (2003) Contini, M. & Contini, T. 2003, MNRAS, 342, 299
- Conselice et al. (2003) Conselice, C.J., Chapman, S.C., & Windhorst, R.A. 2003, 596, 5
- Cowie & Hu (1998) Cowie, L. L. & Hu, E. 1998, AJ, 115, 1319
- Dey et al. (2005) Dey, A., et al. 2005, ApJ, 629, 654
- Dunne et al. (2000) Dunne, L., Eales, S., Edmunds, M., Ivison, R., Alexander, P., & Clements, D.L. 2000, MNRAS, 315, 115
- Eales et al. (2000) Eales, S., Lilly, S. J., Webb, T., Dunne, L., Gear, W., Clements, D., & Yun, M. 2000, AJ, 120, 2244
- Elvis, Marengo, & Karovska (2004) Elvis, M., Marengo, M., & Karovska, M. 2004, IAUS, eds P.-A. Duc, J. Brain, & E. Brinks, 217, 350
- Fujita et al. (2003) Fujita, S., et al. 2003, AJ, 125, 13
- Geach et al. (2005) Geach, J. E., et al. 2005, MNRAS, 363, 1398
- Giavalisco et al. (2005) Giavalisco M., et al. 2004, ApJ, 600, L103
- Goldader et al. (2002) Goldader, J. D., Meurer, G., Heckman, T. M., Seibert, M., Sanders, D. B., Calzetti, D., & Steidel, C. C. 2002, ApJ, 568, 651
- Hildebrand (1983) Hildebrand, R. H. 1983, QJRAS, 24, 267
- Isaak et al. (2002) Isaak, K. G., Priddey, R. S., McMahon, R. G., Omont, A., Peroux, C., Sharp, R. G., & Withington, S. 2002, MNRAS, 329, 149
- Holland et al. (1999) Holland, W., et al. 1999, MNRAS, 303, 659
- Hu et al. (2002) Hu, E. M., Cowie, L. L., McMahon, R. G., Capak, P., Iwamuro, F., Kneib, J.-P., Maihara, T., & Motohara, K. 2002, ApJ, 2002, 568, L75
- Huang et al. (2005) Huang, J.-S., et al. 2005, 634, 137
- Ivison et al. (2002) Ivison, R.J., et al. 2002, MNRAS, 337 1
- Ivison et al. (2005) Ivison, R.J., et al. 2005, MNRAS, 364, 1025
- Jenness & Lightfoot (1999) Jenness, T. & Lightfoot, J. F. 1998, ASPC, 145, 216
- Kashikawa et al. (2006) Kashikawa, N., et al. 2006, ApJ,
- Kennicutt (1998) Kennicutt, R. C., Jr. 1998, ApJ, 498, 541
- Kodaira et al. (2003) Kodaira, K., et al. 2003, PASJ, 55, L17
- Kudritzki et al. (2000) Kudritzki, R.-P., et al. 2000, ApJ, 536, 19
- Lehmer et al. (2005) Lehmer , B.D., et al. 2005, AJ, 129, L1
- Lilly et al. (1995) Lilly, S. J., Tresse, L., Hammer, F., Crampton, D., & Le Fèvre, O. 1995, ApJ, 455, 108
- Lilly et al. (1999) Lilly, S. J., Eales, S., Gear, W. K.P., Hammer, F., Le Fèvre, O., Crampton, D., Bond, J. R., & Dunne, L. 1999, ApJ, 518, 641
- Madau et al. (1996) Madau, P., Ferguson, H. C., Dickinson, M. E., Giavalisco, M., Steidel, C. C., & Fruchter, A. 1996, MNRAS, 283, 1338
- Malhotra & Rhoads (2002) Malhotra, S. & Rhoads, J.E. 2002, 565, L71
- Mihos & Hernquist (1996) Mihos, C.J. & Hernquist, L. 1996, ApJ, 464, 641
- Morgan & Edmunds (2003) Morgan, H. L. & Edmunds, M. G. 2003, MNRAS, 343, 427
- Omont et al. (2001) Omont, A., Cox, P., Bertoldi, F., McMahon, R. G., Carilli, C., Isaak, K. G. 2001, A&A, 374, 371
- Priddey & McMahon (2001) Priddey R. S. & McMahon, R. G. 2001, MNRAS, 342, L17
- Priddey et al. (2003) Priddey, R. S., Isaak, K. G., McMahon, R. G., Robson, E. I., & Pearson, C. P. 2003, MNRAS, 344, L74
- Rhoads et al. (2003) Rhoads, J. E., et al. 2003, ApJ, 125, 1006
- Rhoads et al. (2004) Rhoads, J. E., Xu, C., Dawson, S., Dey, A., Malhotra, S., Wang, J., Jannuzi, B. T., Spinrad, H., & Stern, D. 2004, ApJ, 611, 59
- Robson et al. (2004) Robson, I., Priddey, R. S., Isaak, K. G., & MacMahon, R. 2004, MNRAS, 351, L29
- Sanders & Mirabel (1996) Sanders, D.B. & Mirabel, I.F. 1996, ARA&A, 34, 749
- Sawicki (2001) Sawicki, M. 2001, AJ, 121, 2405
- Scott et al. (2002) Scott, S.E., et al. 2002, MNRAS, 331, 817
- Shapley et al. (2003) Shapley, A. E., Steidel, C. C., Pettini, M., & Adelberger, K. L. 2003, ApJ, 588, 65
- Smail, Ivison, & Blain (1997) Smail, I., Ivison, R. J., & Blain., A. W. 1997, ApJ, 490, 5
- Smail et al. (2003) Smail,I., Ivison, R. J., Gilbank, D. G., Dunlop, J. S., Keel, W. C., Motohara, K., & Stevens, J.A. 2003, ApJ, 583, 551
- Steidel et al. (1996) Steidel, C.C., Giavalisco, M., Dickinson, M., & Adelberger, K.L. 1996, AJ, 112, 325
- Steidel et al. (1999) Steidel, C.C., Adelberger, K.L., Giavalisco, M., Dickinson, M., & Pettini, M. 1999, ApJ, 519, 1
- Stevens et al. (2003) Stevens, J. A., et al. 2003, Nature, 425, 264
- Taniguchi & Shoiya (2000) Taniguchi, Y. & Shioya, Y. 2000, PASJ, 52, 533
- Taniguchi et al. (2005) Taniguchi, Y., et al. 2005, PASJ, 57, 165
- Todini & Ferrara (2001) Todini, P. & Ferrara, A. 2001, MNRAS, 325, 726
- Webb et al. (2003a) Webb T., et al. 2003a, ApJ, 582, 6
- Webb et al. (2003b) Webb, T., et al. 2003b, ApJ, 587, 41
- Webb et al. (2003c) Webb, T., et al. 2003c ApJ, 597, 680
- Webb et al. (2005) Webb, T., ApJ, 631, 187
- Weidinger et al. (2005) Weidinger, M., Møller, P., Fynbo, J.P.U., & Thomsen, B. 2005, A&A, 436, 825
| Name | S850μm(mJy) | S850μm(mJy) | S450μm (mJy) | SFRIR (M⊙yr-1)bbSee §3.1 for description of the star formation rate estimate. | SFRLyα(M⊙yr-1)ccValues taken from Kodaira et al. (2003) | Md 108M⊙ | |
|---|---|---|---|---|---|---|---|
| measured | limit | limit | |||||
| SDF J132415.7+273058 (SDF-1) | 6.541 | -0.027 | 1.5 | 9.0 | 248 | 9.1 0.8 | 2.3 |
| SDF J132418.3+271455 (SDF-2) | 6.578 | -1.0 | 3.8 | 9.5 | 613 | 5.1 0.2 | 5.7 |
| Name | RA (J2000) | Dec (J2000) | S850μm (mJy) | S/N-850m | S450μm (mJy) | S/N-450m | position |
|---|---|---|---|---|---|---|---|
| 850m-450m () | |||||||
| SDF1-850-1aaThere are two possible 450m counterparts to this source. The first, which is listed here, is a 2.8 peak at an offset of 5″ from the 850µm position. The second possibility is source SDF1-450-1 (also listed) which is a 4.0 detection but at a 10 offset. Please see the text §2.2 for discussion. | 13:24:17.80 | 27:30:41.5 | 5.1 | 7.4 | 11.9 | 2.8 | 5.3 |
| SDF1-850-2 | 13:24:14.08 | 27:31:06.5 | 3.8 | 6.5 | 12.8 | 3.5 | 4.0 |
| SDF1-850-3 | 13:24:17.77 | 27:31:33.5 | 4.6 | 6.3 | 11.4 | … | … |
| SDF1-850-4 | 13:24:15.21 | 27:31:34.0 | 3.1 | 4.8 | 12.0 | … | … |
| SDF1-850-5 | 13:24:16.38 | 27:30:00.0 | 3.0 | 4.0 | 12.6 | … | … |
| SDF1-450-1 | 13:24:18.33 | 27:30:34.5 | 2.0 | … | 15.1 | 4.1 | 10.0 |
| SDF1-450-2 | 13:24:18.25 | 27:30:16.0 | 2.2 | … | 16.8 | 4.3 | |
| SDF2-850-1 | 13:24:20.46 | 27:15:28.8 | 5.5 | 5.5 | 18.8 | 4.4 | 4.0 |
| SDF2-850-2 | 13:24:13.44 | 27:15:09.8 | 4.1 | 3.9 | 30.3 | … | … |
| SDF2-450-1 | 13:24:15.63 | 27:14:42.2 | 2.8 | … | 16.0 | 3.5 | … |