Modelling the spectrum and SED of V838 Mon
Abstract
We model the spectra and spectral energy distribution of V838 Mon which were observed in February, March, and November, 2002. Theoretical spectra are calculated using the classical model atmospheres taking into account absorption of atomic and molecular lines. By fitting the observed spectra we determine the physical parameters of the atmosphere of V838 Mon. These parameters are determined to be Teff = 5330 300 K, 5540 270 K, 4960 190 K, and 2000 200 K for February 25, March 2, March 26, and November 6, respectively.
Main Astronomical observatory of NASU, 27 Zabolotnoho, Kyiv-127, 03680 Ukraine
0.1. Introduction
The cause of the eruption of V838 Mon and the nature of its progenitor are unclear. Desidera et al. (2002) reported a faint hot continuum at short wavelengths, recently confirmed by Munari et al. (2005) and identified as a B3V companion.
1. Procedure
1.1. Observational data
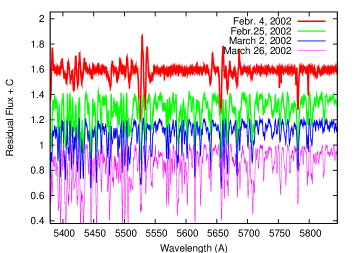
Some spectra obtained on February – March, 2002 are shown in Fig. 1.
The first spectrum of V838 Mon taken on Feb. 4 is shown in Fig. 1. It was obtained by V.Klochkova at the 6 m telescope (SAO, Russia). Details of the data reduction can be found in Kipper et al. (2004).
On February 25 and March 26, 2002 spectra (R 18000) of V838 Mon were obtained with the Echelle+CCD spectrograph on the 1.82m telescope operated by Osservatorio Astronomico di Padova on Mount Ekar (Asiago).
Spectra on March 2 were obtained with the echelle fibre-fed spectrograph on the 1.9-m SAAO telescope kindly provided for us by Lisa Crause (see Crause et al. 2003 for details).
The November 6, 2002 spectrum was obtained with the Kast spectograph on the Cassegrain focus of the Shane 3-m telescope at Lick Observatory. Full details of the observing and data-reduction processes are given in Rushton et al. (2005) and are not repeated here.
1.2. Computation of theoretical spectra
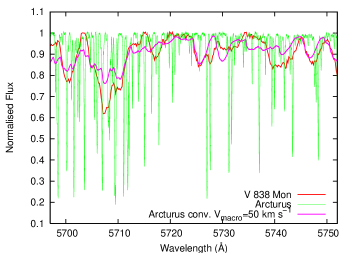
Through February to March 2002, the spectrum of V838 Mon looks like a normal spectrum of a supergiant of spectral class K – G. The optical spectra of V838Mon over these dates are governed by absorption by the neutral atoms. A comparison with a synthetic spectrum of Acturus, with lines broadened by macroturbulent velocities of 50 km/s, shows good agreement (Fig. 1).
To model these spectra we used classical model atmospheres from the Kurucz (1993) grid. Computations of the synthetic spectra were carried out using the program WITA6 Pavlenko (2000) assuming LTE and hydrostatic equilibrium for a one-dimensional model atmosphere without sources and sinks of energy.The equations of ionization-dissociation equilibrium were solved for media consisting of atoms, ions and molecules. Computations were carried out for the VALD (Kupka et al. 1999) line list.
Up until November 2002 both effective temperature and luminosity of V838 Mon drop significantly with time (see also Tylenda 2005). The spectrum of V838 Mon contains strong molecular features. To compute theoretical spectral energy distributions (SEDs) we used a number of model atmospheres, with Teff = 2000 — 2200 K, log g = 0, 0.5 from the NextGen grid of Hauschildt et al. (1999).
In addition to VALD,
molecular line data were taken from a variety of sources:
– the TiO line lists of Plez (1998).
– CN lines from CDROM 18 (Kurucz 1993);
– CrH and FeH lines from Burrows (2002) and
Dulick et al. (2003) respectively
– lines of HO from the BT2 database
(Barber et al. 2006)
– absorption by VO, and by a few molecules of (in the case of
V838 Mon ) lesser importance, was computed in the JOLA
approximation (see Pavlenko et al. 2000).
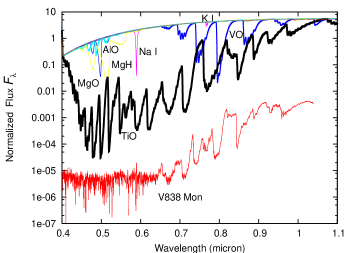
The relative importance of the different opacities contributing to our synthetic spectra is shown in Fig. 1.
2. Results
2.1. V838 Mon in February – March, 2002
It is worth noting a few results (see Kaminsky & Pavlenko (2005) for more details of our procedure and results ):
For February 25 we obtained Teff = 5330 K, dex and = 13. 2.8 km s-1.
For March 2 – Teff = 5540 190 K, dex, = 13.3 3.2 km s-1.
For March 26 – Teff = 4960 270 K, dex, = 12.5 1.7 km s-1.
To account for processes of broadening of spectral lines in spectrum of V838 Mon we used parameter . In our case represents the macroturbulent velocity. We obtained = 54 3, 47 3 and 42 5 km s-1 for February 25, March 2 and March 26, respectively.
Finally, we obtained changes of the radial velocity Vradial = 76 3, 70 3 and 65 3 km s-1 for February 25, March 2 and March 26, respectively, it appears possible that there is a reduction in the expansion velocity of the envelope.
2.2. V838 Mon in November, 2002
On November, 2002 V838 Mon was classified by Evans et al. (2002) as an L-supergiant. The infrared specrum of V838 Mon shows deep absorption bands of H2O . In the optical spectra there are strong TiO bands as well as bands of a few diatomic molecules (Fig. 2).
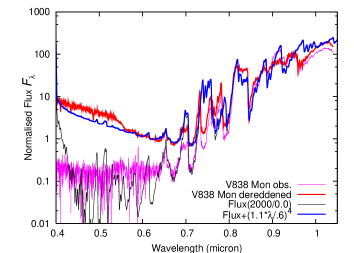
A numerical analysis of V838 Mon spectrum was carried out by Pavlenko et al. (2006). We showed that the slope of the spectrum on 0.6 – 1 micron depends on Teff . The best fit was obtained for Teff = 2000 K (Fig. 2).
It is worth noting that the Balmer hydrogen lines, from Hβ to the Balmer jump, are clearly seen in the observed B3V spectrum. Using the Kurucz (1993) model atmospheres we computed theoretical spectra using WITA6 for different Teff and . The best fit to the observed spectrum provides Teff =18000 - 23000 K and = 4.0 - 4.5.
Our fits of the combined (supergiant+dwarf) synthetic spectrum to the observed spectrum provide the unique possibility for the determination of the radius of the V838 Mon photosphere. This is only possible if V838 Mon and the B3V dwarf form a physically bound system.
Indeed, the radius and effective temperature of the “normal” B3V star should be 6 R⊙ and 20 000 K, respectively. Then, the ratio of the theoretical fluxes around 7000Å computed by WITA6 for the model atmospheres of different effective temperatures is 100. Using one simple suggestion that this ratio can be applied to integrated fluxes from both stars, we get for November 2002
and
Again, we note that this estimation is only correct if V838 Mon and the B3V dwarf are located at the same distance from the Sun.
3. Conclusion
From February until November 2002, we do not see any chemical pecularities in the spectrum of V838 Mon. The observed spectrum resembles the spectrum of the photosphere of a normal supergiant of slightly reduced metallicity [Fe/H] = -0.4 or -0.2 (see Kipper et al. 2004, Kaminsky & Pavlenko, 2005). It therefore provides indirect observation of the evolution of a massive star or binary system with a massive component.
Then, V838 Mon represents a case of very slow evolution. The spectral sequence of V838 Mon can be fitted by the sets of computations for model atmospheres with hydrostatic equilibrium. Weak or intermediate strong spectral lines form in the atmospheres with decreasing temperature outwards. Only the strongest lines in February-March 2002 show P Cyg profiles. The relaxation time after the stellar flash(es) does not exceed 10 days. All these factors should be accounted for in future theoretical models.
Acknowledgments.
YP thanks SOC & LOC of the Meeting for the invitation and support of his participation. YP’s participation was partly supported also by R.Rebolo and E.Martin (IAC). We are grateful to our colleagues Nye Evans, Jacco van Loon (Keele University), Lisa Crause (SAAO), V.Klochkova(SAO), T.Kipper(Tartu), U.Munari(Padova) for the excellent collaboration. We thank Gregory J. Harris (UCL) for some remarks on the text. We thank the authors of the Arcturus atlas for making it available through ftp.
References
- (1) Barber R.J., Tennyson J., Harris G.J., Tolchenov R., 2006, MNRAS, 368, 107
- Burrows et al. (2002) Burrows, A., Ram, S. R., Bernath, P., 2002, ApJ, 577, 986
- Crause et al. (2003) Crause, L.A., et al. 2003, MNRAS, 341, 785
- Desidera & Munari (2002) Desidera, S., Munari, U., 2002, IAUC7982
- Dulick et al. (2003) Dulick, M., Bauschlincher, C. W., Burrows, A. 2003, ApJ, 594, 651
- Evans et al. (2003) Evans, A., Geballe, T. R., Rushton, M. T., Smalley, B., van Loon, J. Th., Eyres, S. P. S., Tyne, V. H., 2003, MNRAS, 343, 1054
- Hauschildt et al. (1999) Hauschildt, P. H., Allard, F., Baron, E., 1999, ApJ, 512, 377
- (8) Hinkle K., Wallace L., Valenti J., Harmer D. Visible and near IR Atlas of the Arcturus spectrum 3727 – 9300 Å. ftp://ftp.noao.edu/catalogs/arcturusatlas/visual/
- Kaminsky & Pavlenko (1995) Kaminsky, B. M., Pavlenko, Y. P., 2005, MNRAS, 357, 38
- Kipper et al. (2004) Kipper, T., Klochkova, V.G., Annuk, K., et al. 2004, A&A, 416, 1107
- Kupka et al. (1999) Kupka, F., Piskunov, N., Ryabchikova, T. A., Stempels, H. C., Weiss, W. W. 1999, A&AS, 138, 119
- Kurucz (1993) Kurucz, R. L., 1993, CDROMs 1-22, Harvard-Smisthonian Astonomical Observatory
- van Loon et al. (2005) van Loon, J. Th., Evans, A., Rushton, M. T., Smalley, B. 2005, A&A, V, P
- Munari et al. (2002) Munari, U., Henden, A., Kiyota, S., et al. 2002, AA, 389, L51
- Munari et al. (2005) Munari, U., et al., 2005, A&A, 434, 1107
- Pavlenko (2000) Pavlenko, Ya. 2000, Astron. Rept., 44, 219
- Pavlenko et al. (2006) Ya. V. Pavlenko, J. Th. van Loon, A. Evans et al. 2006, A&A, accepted (astro-ph/0609225)
- Plez (1998) Plez, B., 1998, A&A, 337, 495
- Rushton et al. (2005) Rushton, M. T., Geballe, T. R., Filippenko, A. V., Chornock, R., Li, W., Leonard, D. C., Foley, R. J., Evans, A., Smalley, B., van Loon, J. Th., Eyres, S. P. S., 2005b, MNRAS, 360, 1281
- Tylenda (2005) Tylenda, R., 2005, A&A, 436, 1009
- van Loon et al. (2004) van Loon, J.Th., Evans, A., Rushton, M.T, Smalley, B. 2004, AA, 427, 193
Discussion
Hirschi: With Teff=2000K, a radius of the order of 1000 R seems reasonable at least for Red Super Giants
Pavlenko: OK, we get the radius 6000 R⊙.
Goranskij: In the spectra shown in web page of Conference, we see that details of L supergiant expand more and more in the blue region. This means that the star becomes hotter and hotter. And this tendency is confirmed by photometry. But your calculations show cooling of the star. Why?
Pavlenko: IR region is better to find temperature of so cool star, because there is the maximum of flux located. Note, by definition the blue part of the spectra should show stronger dependence on shock waves or any other processes of stellar activity. Fortunately, there is only small part of the total/integrated flux of our cool supergiant is located.