11email: defrancesco@to.astro.it,capetti@to.astro.it 22institutetext: INAF - Osservatorio Astrofisico di Arcetri Largo E. Fermi 5, I-50125 Firenze, Italy
22email: marconi@arcetri.astro.it
Measuring supermassive black holes with gas kinematics:
the active S0 galaxy NGC 3998††thanks: Based on observations obtained at
the Space Telescope Science Institute, which is operated by the
Association of Universities for Research in Astronomy, Incorporated,
under NASA contract NAS 5-26555.,††thanks: This publication makes use of the
HyperLeda database, available at http://leda.univ-lyon1.fr.
Abstract
Context. We present results from a kinematical study of the gas in the nucleus of the active S0 galaxy NGC 3998 obtained from archival HST/STIS long-slit spectra.
Aims. We analyzed the emission lines profiles and derived the map of the gas velocity field. The observed velocity curves are consistent with gas in regular rotation around the galaxy’s center.
Methods. By modeling the surface brightness distribution and rotation curve of the H emission line we found that the observed kinematics of the circumnuclear gas can be accurately reproduced by adding to the stellar mass component a compact dark mass (black hole) of (uncertainties at a 2 level); the radius of its sphere of influence ( 016) is well resolved at the HST resolution.
Results. The BH mass estimate in NGC 3998 is in good agreement with both the (with an upward scatter by a factor of 2) and correlations (with a downward scatter by a factor of , depending on the form adopted for the dependence of on ).
Conclusions. Although NGC 3998 cannot be considered as an outlier, its location with respect to the relation conforms with the trend suggesting the presence of a connection between the residuals from the correlation and the galaxy’s effective radius. In fact, NGC 3998 has one of the smallest values of among the galaxies with measured (0.85 kpc) and it shows a negative residual. This suggests that a combination of both and is necessary to drive the correlations between and other bulge properties, an indication for the presence of a black holes “fundamental plane”.
Key Words.:
black hole physics – galaxies: active – galaxies: bulges – galaxies: nuclei – galaxies: kinematics and dynamics1 Introduction
It is generally believed that supermassive black holes (SMBHs; ) are a common, if not universal, feature in the nuclei of nearby galaxies. Since the discovery of quasars (Schmidt 1963), it has been suggested that active galactic nuclei (AGNs) are powered by mass accretion onto a SMBH (Salpeter 1964; Lynden-Bell 1969). This belief, combined with the observed evolution of the space density of AGNs and the high incidence of low-luminosity AGN-like activity in the nucleus of nearby galaxies (Heckman 1980; Maoz et al. 1995; Ho et al. 1997a, b; Braatz et al. 1997; Barth et al. 1998, 1999; Nagar et al. 2002) implies that a significant fraction of galaxies in the Local Universe must host black holes (BHs), relics of past activity (Soltan 1982; Chokshi & Turner 1992; Yu & Tremaine 2002; Marconi et al. 2004; Shankar et al. 2004).
Supports to these beliefs came from studies of the centers of nearby early-type galaxies, which revealed that most contain SMBHs (Kormendy & Gebhardt 2001; Merritt & Ferrarese 2001) and that the BH mass correlates with some properties of the host galaxy, such as bulge luminosity and mass (Kormendy & Richstone 1995; Magorrian et al. 1998; Marconi & Hunt 2003), light concentration (Graham et al. 2001) and bulge velocity dispersion (Ferrarese & Merritt 2000; Gebhardt et al. 2000; Tremaine et al. 2002). The correlation with the bulge velocity dispersion was thought to be the tightest having the smallest scatter: rms 0.3 in log . Ferrarese & Merritt (2000) argued that, for their selected sample of 12 galaxies, thought to have the most reliable BH mass estimates, the observed scatter in the relation was fully accounted for by the assumed measurement errors, which implies that there may be no intrinsic scatter in the correlation. More recently, Marconi & Hunt (2003) have shown that when considering only galaxies with secure BH mass and bulge parameters determinations all the above correlations have a similar observed scatter (see also McLure & Dunlop 2002; Erwin et al. 2004; Häring & Rix 2004).
The existence of any intrinsic correlations of and host galaxy bulge properties supports the idea that the growth of SMBHs and the formation of bulges are closely linked (Silk & Rees 1998; Haehnelt & Kauffmann 2000), therefore having important implications for theories of galaxy formation and evolution. Moreover, SMBH mass estimates inferred via the above correlations, when more direct methods are unplayable, enter in a variety of important studies spanning from AGNs physics and fueling to coeval formation and evolution of the host galaxy and its nuclear black hole. These correlations need, however, to be further investigated by increasing the number of accurate BH mass determinations in nearby galactic nuclei to set these correlations on stronger statistical basis. In particular such a study has the potential to establish the precise role of the various host galaxy’s parameters in setting the resulting BH mass. To date, reliable SMBH detections have been obtained for a limited number of galaxies ( 30, see Ferrarese & Ford 2005 for a review), with a bulk of estimates in the range of . Furthermore, the coverage of the mass range is particularly poor at the low-mass end, the sample being strongly biased against late Hubble types and low luminosity objects. To add reliable new points to the host galaxy properties planes is then a fundamental task for future developments of astronomical and physical studies, and is the aim of the work described in this paper.
Spectral information at the highest possible angular resolution is required to directly measure the mass of SMBHs: the radius of the“sphere of influence” (Bahcall & Wolf 1976) of massive BHs is typically 1″ even in the nearest galaxies. Among the so far most widely used techniques to detect and estimate BHs masses is stellar dynamical modeling (e.g. Dressler & Richstone 1988; Kormendy & Richstone 1995; van der Marel et al. 1998; Gebhardt et al. 2000; Verolme et al. 2002), but the interpretation of the data is complex involving many degrees of freedom and requiring data of very high signal-to-noise ratio (Valluri et al. 2004). Radio frequency measurements of H2O masers in disks around BHs, finally, can be applied only to the small fraction of the disks inclined such that their maser emission is directed toward us (Braatz et al. 1997). A more widely applicable and relatively simple method to detect BHs is based on gas kinematics (e.g. Harms et al. 1994; Ferrarese et al. 1996; Macchetto et al. 1997; Barth et al. 2001), through studies of ordinary optical emission lines from circumnuclear gas disks, provided that the gas velocity field is not dominated by non gravitational motions. A successful modeling of the gas velocity field under the sole influence of the stellar and black hole potential is needed to provide a posteriori support for a purely gravitational kinematics. The angular resolution of of the Space Telescope Imaging Spectrograph (STIS) on-board is the most suitable to perform such studies. The wealth of unpublished data contained in STIS archives represents an extraordinary and still unexplored resource.
Following this chain of reasoning, we performed a systematical search for unpublished data in the STIS archive with the aim of finding galaxies candidates to provide a successful SMBH mass measurement.
In this paper we present the results obtained for the active galaxy NGC 3998. From the Lyon/Meudon Extragalactic Database (HyperLeda), NGC 3998 is classified as an early type (S0) galaxy with an heliocentric radial velocity of 1040 18 km s-1. With = 75 km s-1 Mpc-1 and after correction for Local Group infall onto Virgo, this corresponds to a distance of 17 Mpc and a scale of 83 pc arcsec-1. NGC 3998 is spectroscopically classified as a LINER with broad H emission (Heckman 1980; Keel 1983; Ho et al. 1997a, b) and no significant broad-line polarization (Barth et al. 1999) therefore indicating a probable direct view to a BLR. Support to this hypothesis comes from studies of WFPC2 optical images which revealed an unobscured nucleus and the presence of a bright circumnuclear ionized gas disk (Pogge et al. 2000). The nucleus contains a variable compact flat spectrum radio source (Hummel et al. 1984) displaying a weak jet-like northern structure (Filho et al. 2002). A bright UV source (unresolved at FOC resolution) is present in the center of NGC 3998 (Fabbiano et al. 1994). Its rapidly variable flux (Maoz et al. 2005) implies that a significant fraction of the UV output is contributed by a non-stellar AGN component. A substantial featureless continuum component is also observed in the optical (González Delgado et al. 2004). The presence of an AGN in the nucleus of NGC 3998 is further strengthened by X-ray observations, which revealed the presence of a nuclear source with a power law spectrum (Roberts & Warwick 2000; Pellegrini et al. 2000) and X-ray and H luminosity values consistent with the low luminosities extension of the correlation observed for Seyferts and QSOs (see Koratkar et al. 1995).
The paper is organized as follows: in Sec. 2 we present HST/STIS data and the reduction that lead to the results described in Sec. 3. In Sec. 4 we model the observed H emission line rotation curve and we show that the dynamics of the circumnuclear gas can be accurately reproduced by circular motions in a disk when a point-like dark mass is added to the stellar potential. Our results are discussed in Sec. 5, and summarized in Sec. 6.
2 HST data and reduction
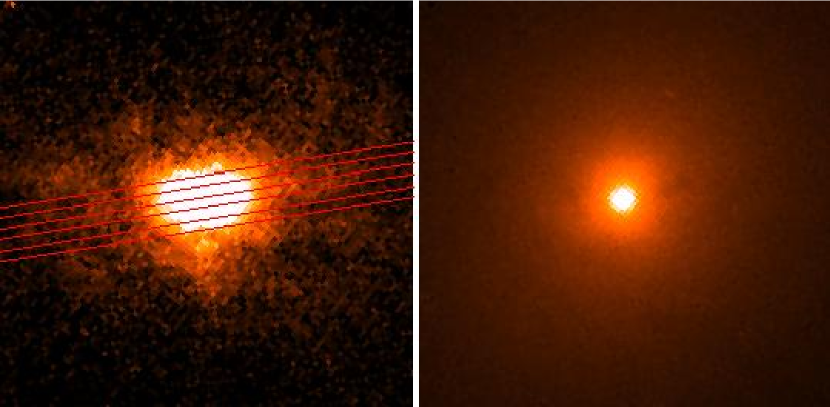
NGC 3998 was observed with STIS on in 1997 November 01 with the G750M grating and the 52″ 01 slit. Data were acquired at five different slit positions, following a perpendicular-to-slit pattern with a step of 01 and the central slit centered on the nucleus. The orientation of the slit was from North, and the exposure time was 328 s for each position. The position of the continuum peak had been acquired with the ACQ mode with two 10 s exposures obtained with the optical long-pass filter MIRVIS. The five spectra obtained, NUC for the nuclear slit, N1-N2 and S1-S2 (from North to South) for the four off-nuclear, were retrieved from the public archive. Fig. 1 shows the slit locations superposed onto a narrow band WFPC2, obtained by using the F658N filter, including the H+[N II] lines.
The data were obtained with a 2x1 on-chip binning of the detector pixels and automatically processed through the standard pipeline to perform the steps of bias and dark subtraction, applying the flat field and combining the two sub-exposures to reject cosmic-ray events. The data were then wavelength and flux calibrated with conversion to heliocentric wavelengths and absolute flux units and rectified for the geometric distortions. The 2-D spectral image obtained for each slit position has a spatial scale of 00507 pixel-1 along the slit, a dispersion of = 1.108 Å pixel-1 and a spectral resolution of , covering the rest frame wavelength range 6480-7050 Å.

For each spectrum we selected the regions containing the lines of interest. The lines were fitted, row by row, along the dispersion direction, together with a linear continuum, with Gaussian functions using the task SPECFIT in STSDAS/IRAF. All emission lines present in the spectra (H, [NII]6548,6583 and [SII]6716,6731) were fitted simultaneously with the same velocity and width and with the relative flux of the [NII] lines kept fixed to 0.334. Results of the fit are tabulated in Appendix A.
A single Gaussian function for H line does not produce an accurate fit to the lines profile in the region for three positions of the slit: NUC and the nearest N1 and S1. Here the lines profile shows a broad base component superposed to the narrow lines of H and [N II] (see Fig. 2 for NUC slit), indicative of the presence of a Broad Line Region. In these regions we performed a fit with two Gaussians components for H line, a narrow and a broad one whose velocity we kept fixed at all locations.
In the external regions, where the SNR was insufficient the fitting was improved by co-adding two or more pixels along the slit direction.


3 Results
The results obtained from the fitting procedure at the five slit positions are shown in Fig. 3 through Fig. 5 where we show the central velocity, surface brightness and FWHM for the narrow H line at each location along the slits. Emission is detected out to a radius of 05 corresponding to 40 pc. The extension of the line emission and its behaviour along the five slit positions are in agreement with the H image seen in Fig. 1, where an EST-WEST elongated emission structure is visible. Conversely, the stellar component shows an almost circular distribution in the V band continuum.
The line emission is strongly peaked on the central slit (Fig. 3, middle panel), rapidly decreasing at larger radii and not showing the presence of any emission line knot other than the central maximum. The velocity curve in the central slit, NUC, has a full amplitude of and shows a general reflection symmetry: starting from the center the velocity rapidly rises on both sides by reaching a peak at 01 from the center. At larger radii, the velocity decreases to form a plateau before rising again at the extremes of the velocity field. Both the line flux and the line width rapidly decrease from the nucleus outwards.
The behaviour seen in the off-nuclear slits is qualitatively similar to that seen at the NUC location, but with substantially smaller velocity amplitude and, more important, a less extreme nuclear gradient. Both amplitude and gradient decrease at increasing distance of the slit center from the nucleus, with a behaviour characteristic of gas rotating in a circumnuclear disk.
4 Modeling the rotation curves
It therefore appears that an ionized gas system is present in the innermost regions of NGC 3998 with a smooth and regular velocity field, co-rotating with respect to the larger scale stellar and gas disk (Fisher 1997).
Our modeling code, described in detail in Marconi et al. (2003), was used to fit the observed rotation curves. The code computes the rotation curves of the gas assuming that the gas is rotating in circular orbits within a thin disk in the galaxy potential. The gravitational potential has two components: the stellar potential (determined in the next section), characterized by its mass-to-light ratio and a dark mass concentration (the black hole), spatially unresolved at HST+STIS resolution and characterized by its total mass . In computing the rotation curves we take into account the finite spatial resolution of HST+STIS, the line surface brightness distribution and we integrate over the slit and pixel area. The is minimized to determine the free parameters using the downhill simplex algorithm by Press et al. (1992).
4.1 The stellar mass distribution
In order to assess the contribution of stars to the gravitational potential in the nuclear region, we derived the stellar luminosity density from the observed surface brightness distribution.
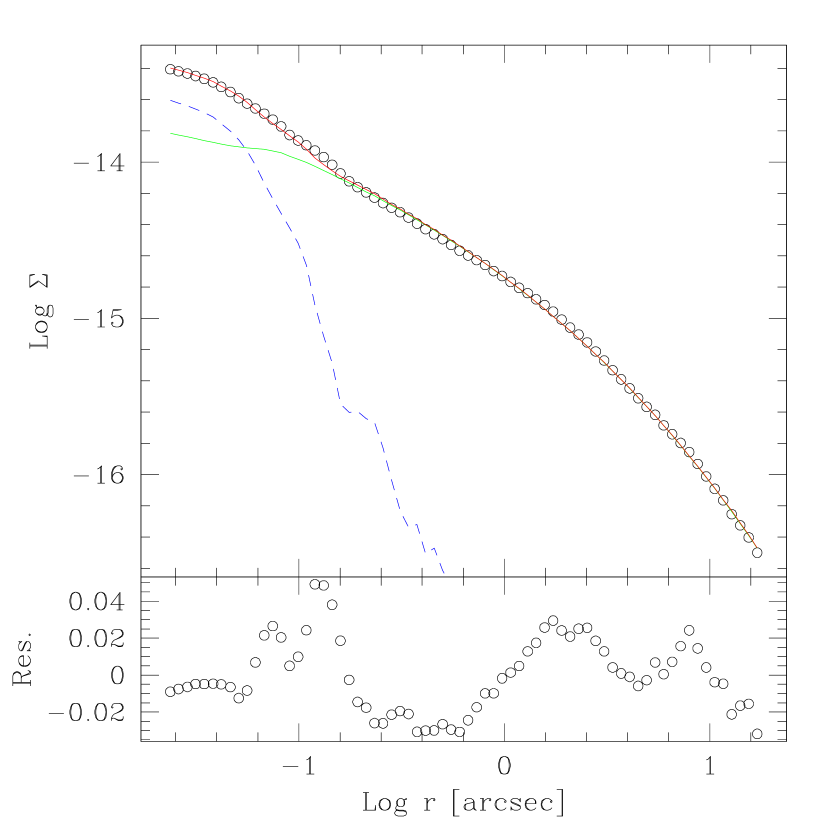
We reconstructed the galaxy light profile using a WFPC2 F547M (V band) image retrieved from the public archive (Fig. 1). An inspection of archive images shows that contamination from dust is negligible, since dust absorption is seen only on relatively large scale ( 2 kpc) while the central regions are apparently free from dust (see also Pogge et al. 2000). We used the IRAF/STSDAS program ELLIPSE to fit elliptical isophotes to the galaxy (see Fig. 6). Excluding the nuclear regions ( 015) that are dominated by a central compact source, the ellipticity shows small variations around a value of 0.15. The position angle does not show significant variations being approximately constant at PA = 135∘.

The nature of the compact nuclear source is crucial for the estimate of the stellar mass distribution. In fact, if this is associated to light produced by the active nucleus, it does not correspond to a stellar mass contribution and should not be included in the mass budget. The presence of a bright (and variable) UV and X-ray source seems to indicate that indeed this is the case. We explored in more detail this issue by fitting the brightness profile with a Sérsic law (Sérsic 1968) with superposed a point source, whose profile was derived from a synthetic Point Spread Function modeled with TINYTIM. This analysis shows a very good agreement between the data and the model (see Fig. 7). This supports the conclusion that the central source is unresolved and associated to AGN emission.
The inversion procedure to derive the stars distribution from the surface brightness is not unique if the gravitational potential does not have a spherical symmetry. Assuming that the gravitational potential is an oblate spheroid, the inversion depends on the knowledge of the potential axial ratio , and the inclination of its principal plane with respect to the line of sight. As these two quantities are related by the observed isophote ellipticity, we are left with the freedom of assuming different galaxy inclinations to the line of sight. We performed the de-projection adopting for the galaxy inclination the value , as given from the HyperLeda database. Due to the small ellipticity of this galaxy, the precise value of its inclination has only a marginal effect on the resulting mass distribution.
Following van der Marel & van den Bosch (1998), we assumed an oblate spheroid density distribution parameterized as:
where is given by , is a reference system with the plane corresponding to the principal plane of the potential and is the intrinsic axial ratio, and performed the de-projection adopting for the mass-to-light ratio in the V band the reference value of = 1. A detailed description of the relevant formulas and of the inversion and fit procedure is presented in Marconi et al. (2003). The best fit obtained is shown in Fig. 8 with = 1.67, =0.65 and =4.65″111Note that with the derived density profile, the stellar mass included within the HST spatial resolution (01) is 4.0 , having adopted a mass-to-light ratio = 6.5 that will be derived in the next Section. Thus it only represents a fraction of 15 % of the best fit value for the SMBH mass.. A point source with flux 5.2 10-16 erg s-1 cm-2 Å-1 was added to the extended luminosity distribution.
4.2 Fitting the gas kinematics
Our modeling code was used to fit the nuclear rotation curves. The free parameters of the fit are:
-
•
the systemic velocity, ,
-
•
the impact parameter (i.e. the distance between the nuclear slit center and the center of rotation) ,
-
•
the position of the galaxy center along the nuclear slit ,
-
•
the angle between the slits and the line of nodes, ,
-
•
the disk inclination ,
-
•
the mass-to-light ratio of the stellar component, ,
-
•
the black hole mass .
In a oblate spheroid, the stable orbits of the gas are coplanar with the principal plane of the potential and it is possible to directly associate the galaxy inclination and line of nodes with those of the circumnuclear gas. However, the potential shape is not sufficiently well determined by the isophotal fitting down to the innermost regions of the galaxy and it is possible that a change of principal plane might occur at the smallest radii, in particular within the sphere of influence of a supermassive black hole. By these considerations we preferred to leave the disk inclination as a free parameter of the fit. We then performed a minimization for different values of , namely , allowing all other parameters to vary freely. Due to the sensitivity of the observed line width to the brightness distribution modeling and to other computational problems (i.e. a coarse sampling, Marconi et al. 2006) we decided to initially perform the fit without using the values of the line width. We will show in Sect. 4.2.1 that the inclusion of the line widths in the modeling code has only a marginal effect on our results.

To build the synthetic kinematical models the intrinsic line surface brightness distribution for the narrow H line had to be obtained for each disk inclination. The observed emission line surface brightness was modeled for each value with a composition of three circularly symmetric Gaussian functions. The first reproducing the observed central emission peak, the second the intermediate regions and the third to account for the brightness behaviour at large radii. The modeling was performed through a minimization, leaving as free parameters the intensity, scale radius and peak position. The choice of a particular model for the line surface brightness distribution does not affect the final BH mass estimate provided that the model reproduces the observed line emission within the errors. Nevertheless it has an important effect on the quality of the velocity fit (Marconi et al. 2006).
The reduced values ( = /d.o.f.) of the best fit to the velocity curves, obtained for each disk inclination, are shown in Fig. 9. The quality of the fit depends only very weakly on the assumed disk inclination, with almost constant values of up to , while rapidly increases at larger inclinations. The overall best fitting model to our data is obtained for for the set of parameters reported in Table 1 and is presented in Fig. 10.
The value of minimum is far larger than the value indicative of a good fit and this is in contrast with the fact that the curves shown in Fig. 10 seem to trace the data points well. The reason for this discrepancy is that is not properly normalized (e.g. because not all points are independent or as they do not include the uncertainties in the relative wavelength calibration for the five slits) and/or imply the presence of small deviations from pure rotation. Following Barth et al. (2001) we then rescaled the error bars in our velocity measurements by adding in quadrature a constant error such that the overall best fitting model provides /d.o.f. 1. This is a quite conservative approach as it has the effect of increasing the final uncertainty on . The additional velocity error is found to be 28 km s-1. We rescaled all values of with this procedure (Fig. 11, bottom panel). The best fitting models obtained at varying disk inclination are within the 2 confidence level () for .


| ) | |||||||
|---|---|---|---|---|---|---|---|
| 30 | 0.00 | -0.02 | 28 | 1010 | 6.5 | 2.7 | 5.96 |
To evaluate the statistical uncertainty associated to the black hole mass estimate we explored its variation with respect to the parameters that are more strongly coupled to it, i.e. the mass-to-light ratio and the gas disk inclination . The uncertainty on associated to changes in has been estimated building a grid in the vs. parameter space. At each point of the grid, described by a fixed pair of and values, we obtained the best fit model allowing all other parameters to vary freely and derived the corresponding value (properly rescaled). This enabled us to build contours of confidence level. The result of this analysis at is presented in Fig. 12. The 2 ranges of the BH mass and mass-to-light ratio at this disk inclination are and respectively. The statistical uncertainty on is reported in the error bar in Fig. 11. We repeated the same analysis for another representative value of the inclination, , obtaining similar fractional uncertainties on the parameters.
The dependence of BH mass on the gas disk inclination closely follows the expected scaling with a 1/ law (see Fig. 11), at least up to . Since all disk inclination yield acceptable fits (within the 2 level), apparently our analysis only provides a lower bound to the black-hole mass. However, also the mass-to-light ratio increases sharply at low inclinations reaching a value of 50 for . In fact at smaller inclinations a deeper potential is needed to maintain the projected velocities seen at the largest radii where the stellar component dominates. We then considered the evolutionary synthesis models for stellar populations derived by Maraston (1998) in order to limit ourselves only to astrophysically acceptable models. The value of monotonically increases with the galaxy’s age reaching, for a Salpeter initial mass function (IMF), the maximum value in the V band of = 7.87 for an age of 15 Gyr. This value corresponds to an inclination of (having used a 1/ interpolation on the disk inclination for the dependence of both and ). This translates into an upper bound to the black hole mass (see Fig. 11). Therefore, although larger black-hole masses are allowed when considering only the kinematical modeling, they are in reality unacceptable as they would correspond to a mass-to-light ratio of the stellar population larger than predicted by the stellar population synthesis. Furthermore, the adopted upper limit on compares favourably with observations. The correlation between galaxy’s luminosity and mass-to-light ratio (e.g. van der Marel 1991; Cappellari et al. 2006) predicts a range (in the R band) of . This is consistent with an age of Gyr and with the upper limit we adopted in the V band.
By combining the allowed range in inclination with the statistical uncertainties on associated to variations in , we obtain a global range of acceptable black hole mass of at a 2 level.
4.2.1 Line width distribution
At this point of our analysis we tested the influence over the above results of including the line width in the fitting procedure. Adopting the best fit parameter set (Table 1) we obtained the FWHM distribution shown in Fig.13 (solid line). The observed line widths are acceptably well reproduced by the model. Only a slightly underestimate ( 20) of the nuclear increase is observable at NUC, while the largest deviation from the peak values occurs at the off-nuclear S1. Among the line parameters, the line width is the most sensitive to the brightness distribution modeling and to other computational problems, i.e. a sub-sampling of the grid used by the numerical code (Marconi et al. 2006). Due to this sensitivity only weak constraints on the BH mass estimate can be derived by its inclusion in the fitting procedure. Therefore, a slightly underestimate of the peak observed values does not invalidate the derived fitting model.
Despite the goodness of the result, we repeated the minimization at , this time by including the observed line widths in the modeling procedure. The best fit obtained is shown in Fig. 13 (dashed line). Only a small improvement of the match with observed values is obtained, while the model velocity curves remain substantially unchanged respect to the previous result. Furthermore, BH mass and mass-to-light ratio values do not change significatively, resulting and = 5.6. The modeling code assumption that the nuclear gas is in a thin, circularly rotating disk is then verified through the satisfactory good match of observed and model line width distributions. Indeed, the nuclear rise of the line width is well accounted for as unresolved rotation by the fitting model.


5 Discussion
Our model fitting of the nuclear rotation curves of NGC 3998 indicates that the kinematics of gas in its innermost regions can be successfully accounted for by circular motions in a thin disk when a point-like dark mass (presumably a supermassive black hole) of is added to the galaxy potential.
Let us explore how this mass determination is connected with the properties of the host galaxy. We compare our BH mass estimate with the known correlations with host spheroid (bulge) mass (Marconi & Hunt 2003) and with the stellar velocity dispersion (Tremaine et al. 2002; Ferrarese & Ford 2005).
Following Marconi & Hunt (2003), we used the virial mass ( = 3) to determine the bulge mass of NGC 3998.
The effective radius of the bulge, , has been estimated as the weighted average of the determinations by Fisher et al. (1996) (11″) and Sánchez-Portal et al. (2004) (96), from which we derived = 102 06 (0.85 0.05 kpc).
We found three optical determinations of the stellar velocity dispersion for NGC 3998 in the literature. The values are 297 (Fisher 1997, 2″ 4″ slit), 314 20 (Tonry & Davis 1981, 3″ 12″ slit), 333 22 (Nelson & Whittle 1995, 15 22 slit) respectively 222Bertola et al. (1984) measured = 350 40 , but, because of saturation, their data gave no results on stellar kinematics in the innermost central regions ( 2″).. We adopted the value from HyperLeda database = (305 10) km s-1. The velocity dispersions in the catalogue are mean values standardized to a circular aperture of radius = 0.595 h-1 kpc (see Golev & Prugniel 1998). At the distance of NGC 3998 this radius corresponds to an aperture of 96 of radius, very close to the value of the bulge effective radius for NGC 3998.
Assuming that this value of is a good approximation for , we obtained for the bulge mass the value . Using this estimate of and the correlation of Marconi & Hunt (2003) which considers only “secure” BH mass determinations (i.e. BH with resolved sphere of influence: 2, with the spatial resolution of the observations) the expected for NGC 3998 is 1.3 , in excellent agreement, within a factor of 2, with our determination (see Fig.14). We also note that the value of the BH sphere of influence radius in NGC 3998 () is 13 pc (0). This implies a well resolved BH sphere of influence at the HST resolution () for our determination (2 3.2).

Concerning the correlations between BH mass and central stellar velocity dispersion, adopting the correlation parameters estimated by Tremaine et al. (2002) the expected BH mass for NGC 3998 is 7.4 (see Fig.15), a factor 2.7 higher than our estimate. However, NGC 3998 cannot be considered as an outlier from the vs. correlation given the errors in the estimates of , , and of the best fit parameters describing relation, and its intrinsic scatter ( in log ). We can also compare our measurement with the expectations of the relation recently derived by Ferrarese & Ford (2005). We then normalized the central velocity dispersion to an aperture of radius equal to 1/8 of , following the method introduced by Jorgensen et al. (1995), and derived . This form of the correlation predicts a BH mass of 1.9 , a factor of 7 higher than our estimate, a larger discrepancy than the one found adopting the Tremaine et al. values.


Marconi & Hunt (2003) showed with a partial correlation analysis that is separately significantly correlated both with and . This is clearly shown by the residuals of the correlation against that show a weak, but significant, correlation (reproduced here in Fig. 16). The new measurement of the black hole mass in NGC 3998 supports this idea. In fact, NGC 3998 has one of the smallest values of among galaxies with measured (0.85 kpc) and it shows a negative residual from the correlation. Recently Capetti et al. (2005) found a similar result, but in the opposed sense, considering the Seyfert galaxy NGC 5252: a large effective radius (9.7 kpc) corresponds in this galaxy to a large positive residual. This confirms that a combination of both and is necessary to drive the correlations between and other bulge properties, an indication for the presence of a black holes “fundamental plane”.

6 Summary and conclusions
We have presented results from a gas kinematics study in the nucleus of the nearby S0 active galaxy NGC 3998. The analyzed data were retrieved from archival HST/STIS long-slit spectra. We performed an analysis of the H, [N II]6548,6583 and [SII]6716,6731 emission lines profiles to derive the map of the gas velocity field. The nuclear velocity curves show a general reflection symmetry and are consistent with the presence of gas in regular rotation. We used our modeling code to fit the observed H surface brightness distribution and velocity curve. The dynamics of the rotating gas can be accurately reproduced by motions in a thin disk when a compact dark mass of , very likely a supermassive black hole, is added to the stellar mass component. This result is also supported by the satisfactory good match of observed and model line width distributions. Furthermore, the black hole in NGC 3998 has a sphere of influence radius of 13 pc (0). At the high HST spatial resolution, this value of implies a resolved BH sphere of influence for our determination (2 3.2).
For what concerns the connections of this BH mass estimate with the properties of the host galaxy, the value for NGC 3998 is in excellent agreement (within a factor of 2) with the correlation between BH and host bulge mass. The black hole mass predicted by the correlation is a factor of 2.7 larger than our measure, adopting the relation found by Tremaine et al. (2002), or a factor of 7 using the most recent parameterization by Ferrarese & Ford (2005). However, NGC 3998 cannot be considered as an outlier from the vs. correlation considering the errors in the estimates of and , and both the uncertainties in the determination of the relation as well as its scatter.
Nonetheless, the lower-than-expected value for the mass of the black hole hosted by NGC 3998 strengthens the presence of a connection between the residuals from the relation and the galaxy’s effective radius. In fact, NGC 3998 has one of the smallest values of among galaxies with measured and it shows a negative residual. We also recently showed that the opposite is true for the Seyfert galaxy NGC 5252: a large effective radius corresponds in this galaxy to a large positive residual.
Apparently only with a combination of both and it is possible to account for the correlations between and other bulge properties, an indication for the presence of a black holes “fundamental plane”. Clearly, only by further increasing the number of direct black hole measurements it will be possible to base these conclusions on a stronger statistical foundation.
Acknowledgements.
We would like to thank the referee, Laura Ferrarese, for her useful comments and suggestions.References
- Bahcall & Wolf (1976) Bahcall, J. N. & Wolf, R. A. 1976, ApJ, 209, 214
- Barth et al. (1999) Barth, A. J., Filippenko, A. V., & Moran, E. C. 1999, ApJ, 525, 673
- Barth et al. (1998) Barth, A. J., Ho, L. C., Filippenko, A. V., & Sargent, W. L. W. 1998, ApJ, 496, 133
- Barth et al. (2001) Barth, A. J., Sarzi, M., Rix, H., et al. 2001, ApJ, 555, 685
- Bertola et al. (1984) Bertola, F., Bettoni, D., Rusconi, L., & Sedmak, G. 1984, AJ, 89, 356
- Braatz et al. (1997) Braatz, J. A., Wilson, A. S., & Henkel, C. 1997, ApJS, 110, 321
- Capetti et al. (2005) Capetti, A., Marconi, A., Macchetto, D., & Axon, D. 2005, A&A, 431, 465
- Cappellari et al. (2006) Cappellari, M., Bacon, R., Bureau, M., et al. 2006, MNRAS, 366, 1126
- Chokshi & Turner (1992) Chokshi, A. & Turner, E. L. 1992, MNRAS, 259, 421
- Dressler & Richstone (1988) Dressler, A. & Richstone, D. O. 1988, ApJ, 324, 701
- Erwin et al. (2004) Erwin, P., Graham, A. W., & Caon, N. 2004, in Coevolution of Black Holes and Galaxies, ed. L. C. Ho
- Fabbiano et al. (1994) Fabbiano, G., Fassnacht, C., & Trinchieri, G. 1994, ApJ, 434, 67
- Ferrarese & Ford (2005) Ferrarese, L. & Ford, H. 2005, Space Science Reviews, 116, 523
- Ferrarese et al. (1996) Ferrarese, L., Ford, H. C., & Jaffe, W. 1996, ApJ, 470, 444
- Ferrarese & Merritt (2000) Ferrarese, L. & Merritt, D. 2000, ApJ, 539, L9
- Filho et al. (2002) Filho, M. E., Barthel, P. D., & Ho, L. C. 2002, A&A, 385, 425
- Fisher (1997) Fisher, D. 1997, AJ, 113, 950
- Fisher et al. (1996) Fisher, D., Franx, M., & Illingworth, G. 1996, ApJ, 459, 110
- Gebhardt et al. (2000) Gebhardt, K., Bender, R., Bower, G., et al. 2000, ApJ, 539, L13
- Golev & Prugniel (1998) Golev, V. & Prugniel, P. 1998, A&AS, 132, 255
- González Delgado et al. (2004) González Delgado, R. M., Cid Fernandes, R., Pérez, E., et al. 2004, ApJ, 605, 127
- Graham et al. (2001) Graham, A. W., Erwin, P., Caon, N., & Trujillo, I. 2001, ApJ, 563, L11
- Haehnelt & Kauffmann (2000) Haehnelt, M. G. & Kauffmann, G. 2000, MNRAS, 318, L35
- Häring & Rix (2004) Häring, N. & Rix, H.-W. 2004, ApJ, 604, L89
- Harms et al. (1994) Harms, R. J., Ford, H. C., Tsvetanov, Z. I., et al. 1994, ApJ, 435, L35
- Heckman (1980) Heckman, T. M. 1980, A&A, 87, 152
- Ho et al. (1997a) Ho, L. C., Filippenko, A. V., & Sargent, W. L. W. 1997a, ApJS, 112, 315
- Ho et al. (1997b) Ho, L. C., Filippenko, A. V., Sargent, W. L. W., & Peng, C. Y. 1997b, ApJS, 112, 391
- Hummel et al. (1984) Hummel, E., van der Hulst, J. M., & Dickey, J. M. 1984, A&A, 134, 207
- Jorgensen et al. (1995) Jorgensen, I., Franx, M., & Kjaergaard, P. 1995, MNRAS, 276, 1341
- Keel (1983) Keel, W. C. 1983, ApJ, 269, 466
- Koratkar et al. (1995) Koratkar, A., Deustua, S. E., Heckman, T., et al. 1995, ApJ, 440, 132
- Kormendy & Gebhardt (2001) Kormendy, J. & Gebhardt, K. 2001, in AIP Conf. Proc. 586: 20th Texas Symposium on relativistic astrophysics, ed. J. C. Wheeler & H. Martel, 363
- Kormendy & Richstone (1995) Kormendy, J. & Richstone, D. 1995, ARA&A, 33, 581
- Lynden-Bell (1969) Lynden-Bell, D. 1969, Nature, 223, 690
- Macchetto et al. (1997) Macchetto, F., Marconi, A., Axon, D. J., et al. 1997, ApJ, 489, 579
- Magorrian et al. (1998) Magorrian, J., Tremaine, S., Richstone, D., et al. 1998, AJ, 115, 2285
- Maoz et al. (1995) Maoz, D., Filippenko, A. V., Ho, L. C., et al. 1995, ApJ, 440, 91
- Maoz et al. (2005) Maoz, D., Nagar, N. M., Falcke, H., & Wilson, A. S. 2005, ApJ, 625, 699
- Maraston (1998) Maraston, C. 1998, MNRAS, 300, 872
- Marconi et al. (2003) Marconi, A., Axon, D. J., Capetti, A., et al. 2003, ApJ, 586, 868
- Marconi & Hunt (2003) Marconi, A. & Hunt, L. K. 2003, ApJ, 589, L21
- Marconi et al. (2006) Marconi, A., Pastorini, G., Pacini, F., et al. 2006, A&A, 448, 921
- Marconi et al. (2004) Marconi, A., Risaliti, G., Gilli, R., et al. 2004, MNRAS, 351, 169
- McLure & Dunlop (2002) McLure, R. J. & Dunlop, J. S. 2002, MNRAS, 331, 795
- Merritt & Ferrarese (2001) Merritt, D. & Ferrarese, L. 2001, in ASP Conf. Ser. 249: The Central Kiloparsec of Starbursts and AGN: The La Palma Connection, ed. J. H. Knapen, J. E. Beckman, I. Shlosman, & T. J. Mahoney, 335
- Nagar et al. (2002) Nagar, N. M., Falcke, H., Wilson, A. S., & Ulvestad, J. S. 2002, A&A, 392, 53
- Nelson & Whittle (1995) Nelson, C. H. & Whittle, M. 1995, ApJS, 99, 67
- Pellegrini et al. (2000) Pellegrini, S., Cappi, M., Bassani, L., della Ceca, R., & Palumbo, G. G. C. 2000, A&A, 360, 878
- Pogge et al. (2000) Pogge, R. W., Maoz, D., Ho, L. C., & Eracleous, M. 2000, ApJ, 532, 323
- Press et al. (1992) Press, W. H., Teukolsky, S. A., Vetterling, W. T., & Flannery, B. P. 1992, Numerical recipes in FORTRAN. The art of scientific computing (Cambridge: University Press, c1992, 2nd ed.)
- Roberts & Warwick (2000) Roberts, T. P. & Warwick, R. S. 2000, MNRAS, 315, 98
- Salpeter (1964) Salpeter, E. E. 1964, ApJ, 140, 796
- Sánchez-Portal et al. (2004) Sánchez-Portal, M., Díaz, Á. I., Terlevich, E., & Terlevich, R. 2004, MNRAS, 350, 1087
- Schmidt (1963) Schmidt, M. 1963, Nature, 197, 1040
- Sérsic (1968) Sérsic, J.-L. 1968, Atlas de Galaxias Australes(Córdoba: Obs. Astron.)
- Shankar et al. (2004) Shankar, F., Salucci, P., Granato, G. L., De Zotti, G., & Danese, L. 2004, MNRAS, 354, 1020
- Silk & Rees (1998) Silk, J. & Rees, M. J. 1998, A&A, 331, L1
- Soltan (1982) Soltan, A. 1982, MNRAS, 200, 115
- Tonry & Davis (1981) Tonry, J. L. & Davis, M. 1981, ApJ, 246, 666
- Tremaine et al. (2002) Tremaine, S., Gebhardt, K., Bender, R., et al. 2002, ApJ, 574, 740
- Valluri et al. (2004) Valluri, M., Merritt, D., & Emsellem, E. 2004, ApJ, 602, 66
- van der Marel (1991) van der Marel, R. P. 1991, MNRAS, 253, 710
- van der Marel et al. (1998) van der Marel, R. P., Cretton, N., de Zeeuw, P. T., & Rix, H.-W. 1998, ApJ, 493, 613
- van der Marel & van den Bosch (1998) van der Marel, R. P. & van den Bosch, F. C. 1998, AJ, 116, 2220
- Verolme et al. (2002) Verolme, E. K., Cappellari, M., Copin, Y., et al. 2002, MNRAS, 335, 517
- Yu & Tremaine (2002) Yu, Q. & Tremaine, S. 2002, MNRAS, 335, 965
Appendix A Fitting parameters for STIS spectra.
| (6583) | (6583) | (6716) | (6716) | (6731) | (6731) | |||||||
| 591-595 | 1204 | 23 | 590 | 35 | 61 | 7 | 77 | 6 | 25 | 5 | 24 | 6 |
| 596 | 1163 | 21 | 561 | 39 | 135 | 16 | 161 | 13 | 42 | 10 | 63 | 11 |
| 597 | 1163 | 16 | 495 | 38 | 143 | 24 | 198 | 24 | 89 | 9 | 77 | 10 |
| 598 | 1139 | 11 | 541 | 29 | 208 | 26 | 288 | 25 | 142 | 10 | 150 | 11 |
| 599 | 1157 | 14 | 750 | 37 | 934 | 71 | 1060 | 72 | 262 | 25 | 347 | 30 |
| 600 | 1178 | 10 | 814 | 30 | 1853 | 109 | 2257 | 113 | 577 | 32 | 701 | 40 |
| 601 | 1117 | 13 | 1044 | 28 | 6873 | 230 | 6210 | 168 | 883 | 78 | 1647 | 93 |
| 602 | 867 | 8 | 1085 | 23 | 5315 | 107 | 4187 | 94 | 766 | 31 | 1096 | 37 |
| 603 | 837 | 8 | 646 | 21 | 1081 | 55 | 1140 | 51 | 311 | 16 | 387 | 20 |
| 604 | 882 | 6 | 422 | 16 | 269 | 25 | 325 | 20 | 158 | 8 | 156 | 10 |
| 605 | 905 | 7 | 391 | 16 | 169 | 18 | 224 | 15 | 117 | 7 | 129 | 9 |
| 606 | 917 | 8 | 434 | 18 | 200 | 14 | 220 | 12 | 107 | 8 | 110 | 9 |
| 607 | 917 | 10 | 431 | 21 | 134 | 11 | 150 | 10 | 79 | 6 | 80 | 8 |
| 608 | 894 | 14 | 407 | 32 | 82 | 9 | 93 | 6 | 44 | 7 | 41 | 8 |
| 609 | 870 | 11 | 331 | 23 | 67 | 8 | 78 | 8 | 39 | 5 | 37 | 6 |
| 610 | 842 | 14 | 333 | 32 | 51 | 8 | 54 | 7 | 39 | 5 | 16 | 6 |
| 592-596 | 1172 | 15 | 548 | 29 | 83 | 6 | 387 | 5 | 167 | 4 | 152 | 5 |
| 597 | 1111 | 24 | 598 | 46 | 133 | 17 | 161 | 13 | 43 | 11 | 59 | 12 |
| 598 | 1118 | 12 | 594 | 24 | 257 | 15 | 268 | 12 | 65 | 9 | 92 | 10 |
| 599 | 1159 | 10 | 569 | 22 | 356 | 22 | 421 | 22 | 131 | 9 | 184 | 11 |
| 600 | 1163 | 9 | 516 | 24 | 532 | 51 | 553 | 41 | 172 | 15 | 216 | 18 |
| 601 | 1168 | 8 | 521 | 21 | 551 | 49 | 622 | 40 | 215 | 13 | 251 | 15 |
| 602 | 1119 | 12 | 615 | 32 | 576 | 70 | 585 | 53 | 214 | 12 | 211 | 14 |
| 603 | 1018 | 20 | 592 | 47 | 292 | 80 | 396 | 57 | 195 | 12 | 194 | 15 |
| 604 | 946 | 7 | 428 | 16 | 197 | 18 | 251 | 16 | 124 | 7 | 145 | 9 |
| 605 | 948 | 6 | 351 | 15 | 154 | 14 | 162 | 12 | 99 | 6 | 86 | 7 |
| 606 | 942 | 7 | 359 | 18 | 137 | 11 | 162 | 10 | 77 | 7 | 77 | 8 |
| 607 | 954 | 7 | 304 | 18 | 88 | 8 | 99 | 7 | 62 | 5 | 64 | 6 |
| 608 | 935 | 9 | 289 | 27 | 57 | 8 | 80 | 8 | 35 | 5 | 48 | 6 |
| 609 | 923 | 14 | 325 | 28 | 57 | 8 | 61 | 7 | 29 | 5 | 10 | 5 |
| 610 | 929 | 16 | 344 | 31 | 36 | 6 | 46 | 6 | 21 | 4 | 28 | 5 |
| 592-596 | 1130 | 11 | 453 | 27 | 72 | 6 | 76 | 5 | 39 | 4 | 32 | 4 |
| 597 | 1094 | 12 | 450 | 32 | 145 | 13 | 140 | 20 | 54 | 8 | 65 | 9 |
| 598 | 1075 | 6 | 348 | 17 | 154 | 11 | 183 | 9 | 56 | 7 | 88 | 8 |
| 599 | 1062 | 9 | 409 | 23 | 161 | 24 | 231 | 20 | 98 | 8 | 125 | 10 |
| 600 | 1050 | 10 | 622 | 27 | 469 | 29 | 476 | 28 | 134 | 11 | 192 | 13 |
| 601 | 1001 | 11 | 730 | 35 | 580 | 32 | 657 | 34 | 149 | 12 | 222 | 15 |
| 602 | 914 | 11 | 718 | 33 | 633 | 35 | 629 | 34 | 144 | 13 | 226 | 16 |
| 603 | 888 | 9 | 481 | 24 | 373 | 36 | 328 | 28 | 123 | 9 | 116 | 10 |
| 604 | 885 | 8 | 406 | 21 | 196 | 19 | 214 | 17 | 108 | 7 | 77 | 8 |
| 605 | 879 | 10 | 431 | 25 | 160 | 17 | 170 | 16 | 87 | 8 | 62 | 9 |
| 606-610 | 867 | 8 | 458 | 17 | 82 | 5 | 92 | 5 | 45 | 3 | 46 | 4 |
| 592-595 | 1099 | 22 | 515 | 45 | 38 | 6 | 58 | 5 | 12 | 4 | 15 | 5 |
| 596-598 | 1101 | 17 | 512 | 37 | 86 | 9 | 94 | 7 | 34 | 6 | 45 | 6 |
| 599-600 | 1090 | 14 | 489 | 35 | 106 | 11 | 134 | 9 | 33 | 6 | 60 | 8 |
| 601-602 | 1077 | 11 | 498 | 24 | 123 | 10 | 166 | 9 | 48 | 6 | 63 | 7 |
| 605-606 | 994 | 9 | 360 | 23 | 78 | 8 | 110 | 7 | 38 | 5 | 48 | 6 |
| 607-610 | 980 | 11 | 372 | 26 | 46 | 5 | 53 | 5 | 23 | 3 | 31 | 4 |
| 592-594 | 1095 | 11 | 342 | 27 | 49 | 6 | 50 | 4 | 24 | 3 | 28 | 4 |
| 595-596 | 1100 | 15 | 468 | 30 | 81 | 9 | 85 | 7 | 38 | 5 | 39 | 6 |
| 597-598 | 1079 | 18 | 519 | 41 | 85 | 10 | 95 | 8 | 35 | 6 | 24 | 7 |
| 599-600 | 1018 | 19 | 549 | 37 | 96 | 11 | 115 | 9 | 38 | 6 | 41 | 7 |
| 601-602 | 1017 | 20 | 541 | 37 | 90 | 10 | 97 | 8 | 30 | 5 | 37 | 7 |
| 603-605 | 921 | 21 | 548 | 41 | 86 | 9 | 81 | 7 | 29 | 5 | 27 | 6 |
| 606-610 | 811 | 15 | 383 | 33 | 34 | 5 | 42 | 4 | 16 | 3 | 18 | 3 |