The Star Formation Epoch of the most Massive Early-Type Galaxies11affiliation: Based on observations obtained at the W. M. Keck Observatory, which is operated jointly by the California Institute of Technology and the University of California. 22affiliation: Based on observations with the NASA/ESA Hubble Space Telescope, obtained at the Space Telescope Science Institute, which is operated by AURA, Inc., under NASA contract NAS 5–26555.
Abstract
We present new spatially-resolved Keck spectroscopy of early-type galaxies in three galaxy clusters at . In two companion papers (van der Marel & van Dokkum 2006a,b) we construct dynamical models of the galaxies and compare their modeled ratios and dynamical structure to local samples. Here we focus on the fundamental plane (FP) relation, and combine the kinematics with structural parameters determined from Hubble Space Telescope (HST) images. The galaxies obey clear FP relations, which are offset from the FP of the nearby Coma cluster due to passive evolution of the stellar populations. The data are combined with published data for eleven additional clusters at , to determine the evolution of the mean ratio of cluster galaxies with masses M⊙, as implied by the FP. We find , stronger evolution than was previously inferred from smaller samples. The observed evolution depends on the luminosity-weighted mean age of the stars in the galaxies, the initial mass function (IMF), selection effects due to progenitor bias, and other parameters. Assuming a normal IMF but allowing for various other sources of uncertainty, we find for the luminosity-weighted mean star formation epoch. The main uncertainty is the slope of the IMF in the range : we find for a top-heavy IMF with slope . The ratios of the cluster galaxies are compared to those of field early-type galaxies at . Assuming that progenitor bias and the IMF do not depend on environment we find that the present-day age of stars in massive field galaxies is 4.1 % 2.0 % ( Gyr) less than that of stars in massive cluster galaxies. This relatively small age difference is surprising in the context of expectations from “standard” hierarchical galaxy formation models, and provides a constraint on the physical processes that are responsible for halting star formation in the progenitors of today’s most massive galaxies.
Subject headings:
cosmology: observations — galaxies: evolution — galaxies: formation1. Introduction
Recent studies of near-infrared selected samples have uncovered a large population of red, massive galaxies at (e.g., Labbé et al. 2003; Franx et al. 2003; van Dokkum et al. 2003; Daddi et al. 2004; Yan et al. 2004; Papovich et al. 2006). Red galaxies dominate the high-mass end of the mass function at (van Dokkum et al. 2006) and are highly clustered (Daddi et al. 2003; Grazian et al. 2006; Quadri et al. 2006). Most of these objects are too faint in the rest-frame ultra-violet to be selected as Lyman break galaxies (e.g., Förster Schreiber et al. 2004; Reddy et al. 2005). The most straightforward interpretation of these newly-found objects is that they are progenitors of today’s massive early-type galaxies.
Interestingly, a large fraction of these galaxies appear to have very high star formation rates, based on modeling of their spectral energy distributions, (stacked) X-ray emission, infrared emission, submm emission, and spectra (e.g., Förster Schreiber et al. 2004; Rubin et al. 2004; Daddi et al. 2004; Labbé et al. 2005; Knudsen et al. 2005; Papovich et al. 2006; Webb et al. 2006). A similar or smaller fraction is best-fit by passively evolving models with little ongoing star formation (e.g., Labbé et al. 2005; Papovich et al. 2006; Kriek et al. 2006b). These results suggest that by we are entering the star formation epoch of massive early-type galaxies.
An important question is whether the properties of early-type galaxies at intermediate redshift are consistent with this interpretation. Furthermore, detailed studies of early-type galaxies in different environments may identify descendants of particular populations of massive galaxies at . For example, it may be that the passively evolving galaxies at are progenitors of cluster early-type galaxies whereas the star-forming galaxies are progenitors of early-type galaxies in groups.
One of the most sensitive tools for determining the star formation epoch of early-type galaxies is the redshift evolution of the fundamental plane (FP) relation (Djorgovski & Davis 1987), as it reflects evolution in the ratios of galaxies and has very low scatter. The FP has been studied extensively in the past decade, both in clusters (e.g., van Dokkum & Franx 1996; van Dokkum et al. 1998a; Wuyts et al. 2004; Fritz et al. 2005; Holden et al. 2005; Jørgensen et al. 2006) and in the field (e.g., Treu et al. 1999, 2002, 2005a; van Dokkum et al. 2001; Rusin et al. 2003; van de Ven et al. 2003; van der Wel et al. 2004, 2005; di Serego Alighieri et al. 2005). The results from these papers can be summarized as follows: 1) the ratios of the most massive cluster and field early-type galaxies evolve slowly and regularly, indicating early formation of their stars; and 2) there is evidence that low mass galaxies evolve faster than high mass galaxies, both in the field and in clusters, suggesting that they have younger stellar populations. The interpretation of the first result is complicated by the small number of clusters that have been studied so far, uncertainties in the initial mass function (IMF), and by selection effects due to progenitor bias: if the morphologies of galaxies change with time the sample of high-redshift early-type galaxies is only a subset of the sample of nearby early-type galaxies, leading to biased age estimates (see van Dokkum & Franx 2001). The interpretation of the second result is complicated by the fact that large corrections for selection effects need to be made (see Treu et al. 2005a, 2005b; van der Wel et al. 2005), and that galaxies are assumed to undergo no structural or dynamical changes with redshift.
The goal of the present paper is to better constrain the star formation epoch of massive field and cluster galaxies, using the FP. We present spatially resolved spectroscopic data from Keck and high-quality photometric data from the Hubble Space Telescope (HST) for a sample of early-type galaxies in three clusters at . The FPs of the three clusters are presented and discussed, and combined with literature data on the nearby Coma cluster, a sample of nearby galaxies drawn from the Sloan Digital Sky Survey (SDSS), and eleven clusters at . The evolution of the ratio derived from this large sample is used to constrain the star formation epoch of massive cluster galaxies. We combine the cluster sample with recently published samples of field galaxies, and determine the age difference between massive field and cluster galaxies using a self-consistent modeling approach which is different from previous studies. In two companion papers (van der Marel and van Dokkum 2006a,b; hereafter vdMvD06a,b) we utilize our spatially-resolved data to construct detailed dynamical models for the sample galaxies. The results are compared to those for local samples, providing an independent method of deriving ratio evolution, and allowing us to validate the many assumptions that enter into analyses based on the FP. The dynamical models also yield a normalized measure of the rotation rate [akin to ] of the sample galaxies, providing a method to identify S0 galaxies that have been visually misclassified as ellipticals, based on their kinematics.
The structure of the present paper is as follows. The analysis of the spectroscopic and photometric data for the three clusters is described in § 2 and § 3. In § 4 the FPs of the three clusters are presented and discussed. In § 5 results for the three clusters are combined with literature data on 11 additional distant clusters and two local samples, and the evolution is determined from this large sample. Detailed information on the transformations of all the literature data to our system are given in an Appendix. The measured evolution of the ratio is interpreted in § 6. In this Section the implications for the star formation epoch of massive cluster galaxies are discussed, and the cluster data are compared to previously published data for field early-type galaxies. The main results are summarized and discussed in § 7. We assume , , and km s-1 Mpc-1 where needed.
2. Spectroscopy
2.1. Cluster Selection
Galaxies were selected from the Smail et al. (1997) [MORPHS] catalogs of the galaxy clusters 3C 295, CL 0016+16, and CL 1601+42. These three clusters were selected based on their visibility at the time of our Keck observations, and because they are among the most S0-deficient clusters in the MORPHS sample. The MORPHS sample itself was not selected according to strict criteria. Properties of the three clusters are listed in Table 1. They span a range of a factor of in X-ray luminosity. 3C 295 and CL 1601+42 have very high measured velocity dispersions, possibly indicating substructure along the line-of-sight. The dominant galaxy in 3C 295 is a strong radio source. All MORPHS clusters have been observed with the HST WFPC2 camera, and bright galaxies in the WFPC2 fields were visually classified by the MORPHS team (Smail et al. 1997; Dressler et al. 1997).
TABLE 1
Cluster Propertiesa
| 3C 295 | CL 0016+16 | CL 1601+42 | |
| 0.460 | 0.546 | 0.538 | |
| 3.20 | 5.88 | 0.35 | |
| (km s-1) | 1670 | 1703 | 1166 |
| F555W (ks) | — | 12.6 | — |
| F702W (ks) | 12.6 | — | 16.8 |
| F814W (ks) | — | 16.8 | — |
| E fractionc | 0.51 | 0.58 | 0.33 |
| S0 fractionc | 0.21 | 0.15 | 0.12 |
| S fractionc | 0.28 | 0.27 | 0.55 |
a Taken from Smail et al. (1997)
b 0.33.5 keV; ergs s-1
c Morphological fractions from Dressler et al. (1997)
2.2. Galaxy Selection and Observations
The sample selection was largely constrained by the geometry of the Keck Low Resolution Imager and Spectrograph (LRIS) masks. Priority was given to visually-classified E and E/S0 galaxies with (3C 295 and CL 1601+42) or (CL 0016+16). For each cluster two masks were designed. The individual slits were tilted in order to optimally align them with the major axes of the galaxies, within the range allowed by geometrical restrictions. Some galaxies are contained in both masks; for those objects we used position angles on the sky that are offset by 90 degrees, or the same position angle if the slit could be aligned with the major axis in both masks. A large, bright S0/Sb galaxy was included in one of the 3C 295 masks, to test whether rotation can be reliably measured for an “obvious” disk galaxy. Remaining space in the multi-slit masks was used to observe candidate lensed galaxies and random fainter objects in the WFPC2 field. These secondary “filler” objects are not discussed in this paper.
The three clusters were observed with LRIS on 2001 18–19 June. Conditions were variable, with part of the first night lost to clouds. The seeing varied from during the run. For CL 0016+16 and CL 1601+42 exposures were obtained for both masks; for 3C 295 only one mask was observed. The red arm of LRIS was used with the 900 lines mm-1 grating blazed at 5500 Å. The wide slits provide a spectral resolution (as measured from sky emission lines) km s-1. The observed wavelength range is different for each object (as it depends on its position in the multi-slit mask), but is typically 3500–4800 Å in the rest-frame. Total exposure times were 5400 s per mask for 3C 295 and CL 0016+16, and 9000 s per mask for CL 1601+42. The exposures were split into individual 1800 s exposures to facilitate cosmic-ray removal. The telescope was not moved in the slit-direction between successive exposures, as this would have moved the objects out of the (tilted) slitlets. Calibration exposures (dome flats, arc lamps) were obtained in daytime. Dome flats were taken at a range of zenith angles.
2.3. Reduction
The reduction followed standard procedures for multi-slit spectroscopic data (see, e.g., Kelson et al. 2000b; van Dokkum & Stanford 2003). Each slitlet in the masks was treated as a separate long slit spectrum. Bias was subtracted by fitting a low order polynomial to the overscan regions. The ccd was read out using two amplifiers; the bias of each amplifier was fitted separately. Two bad columns were linearly interpolated. The dome flats were used to flat field the data. Before flat fielding, the dome flat exposures were divided by a polynomial fit in the and spatial directions, as the illumination of the ccd is different from that of the night sky emission.


Bright cosmic rays were removed from each slitlet in the following way. A first order approximation of the sky emission lines was subtracted by fitting a low order polynomial. This step reduced the intensity of the lines but did not remove them completely because most slits are tilted. The sky line residuals and the galaxy spectra were largely removed by subtracting the median of the exposures. Remaining residuals were removed by fitting a polynomial, first in the spatial direction and then in the wavelength direction. This three-step procedure proved to be much more effective in removing the light of galaxies and night sky emission than simply subtracting the median. Cosmic rays were identified by comparing the counts to a noise model generated from the subtracted median image and the polynomial fits. Pixels deviating more than 4 were flagged as cosmic ray hits.
Sky subtraction of tilted slits is difficult, as the standard fitting procedures require that sky lines are fairly well aligned with columns. Straightening the sky lines before subtracting them has the disadvantage of introducing aliasing effects due to the relatively large pixels of the LRIS ccd, which are very difficult to remove. More complex procedures have been developed which circumvent these problems (e.g., Kelson 2003); however, as we are working in a wavelength region mostly blueward of the ubiquitous OH lines and the galaxies are relatively bright, we found that an iterative approach provided satisfactory results. At this point in the reduction we subtracted sky lines by simply fitting a low order polynomial in the spatial direction, masking the galaxy spectrum and any other objects in the slit. While not completely removing the lines, this step greatly reduces the aliasing effects that occur when resampling the lines after wavelength calibration.
Wavelength calibration was done using arc lamp exposures, with all lamps on (Hg, Ne, Ar, Cd, and Zn). Line identification was done separately for each row, as the solution is a strong function of position for these tilted slits. The 6300.4 O i sky line was used to apply small corrections to the zeropoints of the wavelength solutions. The S-distortion of the spectra was determined by fitting the wavelength dependence of the position of the galaxy spectra. Two-dimensional polynomials were fitted to the measured positions of the sky lines and galaxy spectra, and these were used to rectify the spectra. In this procedure the spectra are resampled only once. After rectification, remaining sky line residuals were removed by fitting a polynomial (masking the galaxy spectra), and remaining faint cosmic rays were removed with L.A.Cosmic (van Dokkum 2001).
Spectra of the 27 target objects are shown in Fig. 1. They were created by averaging the central five rows (), and have not been weighted, smoothed or binned. The sampling is km s-1 pixel-1, and km s-1. The S/N varies from to per Å. Note that the spectra are not flux-calibrated.
2.4. Redshifts
Redshifts were determined using the cross-correlation program xcsao in IRAF or, in one case, from emission lines. A nearby early-type galaxy was used as the template in the cross-correlation. The redshifts are listed in Table 2 along with the Smail et al. (1997) morphological classifications. Of 27 observed galaxies 25 are at the redshift of the cluster. Of those 25, 24 have an early-type spectrum without strong emission lines. The exception is 3C 295–2014, which shows broad emission lines superposed on an early-type spectrum. The presence of AGN features in this object is not surprising as it hosts the bright radio source 3C 295, the namesake of the cluster.
The two galaxies with deviant redshifts are 3C 295–47 and CL 1601–270. 3C 295–47 is an emission-line object at . The lines are strong and narrow: the [O iii] line has a rest-frame equivalent width Å, and is unresolved at our resolution of km s-1. The galaxy resembles the Compact Narrow Emission Line Galaxies described by Guzman et al. (1996). CL 1601–270 is a field early-type galaxy km s-1 removed from the mean recession velocity of CL 1601+42. These galaxies are not included in the subsequent Figures and analysis. We note that galaxy CL 1601–270 is included in the modeling of vdMvD06a,b.
2.5. Velocity Dispersions
Internal velocity dispersions were determined from direct fits of the galaxy spectra to template star spectra. The fitting methodology is explained in detail elsewhere (see, e.g., van Dokkum & Franx 1996; Kelson et al. 2000b; van Dokkum & Stanford 2003). Briefly, the template stars were broadened such that their spectral resolution matches the instrumental resolution of the observations. Residuals of night sky lines, Balmer absorption lines and (in the case of 3C 295–2014) emission lines were masked in the fits. The wavelength region used in the fit was 4100 Å – 4650 Å; changing the fitting region has a negligible effect on the measured dispersions. For consistency with previous work (e.g., van Dokkum & Franx 1996) a K0 giant star was adopted as the template star. Varying the template star and the continuum filtering produces % variations in the dispersions.
For each galaxy (except 3C 295–47) velocity dispersions were measured from the unweighted average spectrum of the five central rows, corresponding to a square aperture. For consistency with previous work the measured dispersions were corrected to the equivalent of a diameter aperture at the distance of the Coma cluster, using the empirical logarithmic correction given by Jørgensen, Franx, & Kjærgaard (1995b). For the correction is approximately %. Corrected dispersions are listed in Table 2. The median random error is 8 %, and in every case the error is less than 15 %.
2.6. Spatially Resolved Kinematics
In vdMvD06a we present dynamical models of the galaxies, derived from spatially-resolved kinematics and photometry. Among other parameters, these models provide ratios of the galaxies free of many of the assumptions that enter the FP analysis. The radial profiles of velocity and velocity dispersion were determined in the following way. Velocity dispersion measurements were made at 7 positions along the slit: the average of rows ; the average of rows ; row ; the central row 0; row +1; the average of rows ; and the average of rows . As the pixel size is these positions correspond to , , , , , , and from the center of the galaxy. Radial velocities were measured using xcsao, as in some cases velocities can still be measured when the S/N is too low to measure dispersions. Dispersions were deemed unreliable when the random error exceeds %; velocities were discarded when the Tonry & Davis (1979) R-value is lower than 3. The resulting profiles are shown in vdMvD06a.
3. Photometry
3.1. WFPC2 Images
The three clusters were observed with WFPC2 on HST as part of the MORPHS cluster program. Details of the observations and data characteristics are given in Smail et al. (1997). 3C 295 and CL 1601+42 were observed in one band () only; CL 0016+16 was observed in two filters ( and ). Total exposure times are listed in Table 1.
We obtained the raw data from the HST archive. For each cluster, the exposure time was divided over two positions offset by . The shifts are not integer numbers of pixels, and rather than combining the two positions we reduced each pointing separately. This procedure has the advantages that no interpolation is required, and that we can assess the uncertainties in derived parameters from two independent datasets, with different sub-pixel sampling. The IRAF crrej task was used to combine individual frames at each position. Remaining cosmic rays and hot pixels were removed using L.A.Cosmic.
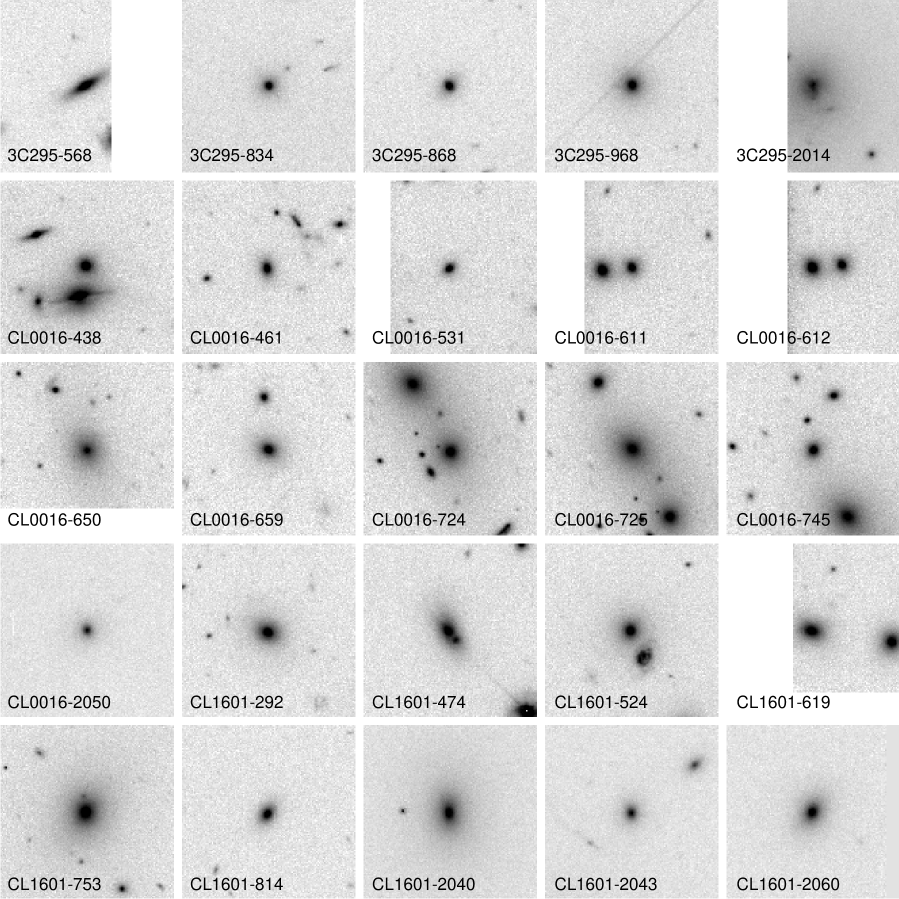
Images of the 25 cluster galaxies are shown in Fig. 2. As expected, most of the galaxies have very regular morphologies with no obvious spiral arms or other finestructure. There are three notable exceptions: 3C 295–568 is the S0/Sb galaxy added to test our ability to measure rotation curves; 3C 295–2014 (the central cluster galaxy) has structure in its core, very likely associated with its active nucleus; and CL 1601–474 consists of two overlapping galaxies. Both components of CL 1601–474 show morphological disturbances, strongly suggesting this is a merger in progress. The object is flagged as “interaction/merger?” in the Smail et al. (1997) catalog. Interestingly the galaxy has an early-type spectrum, similar to the red mergers in the cluster MS 1054–03 (Tran et al. 2005a).
3.2. Structural Parameters
3.2.1 Fitting
The galaxy images were fitted with two-dimensional models, created by convolving -law light distributions with point spread functions (PSFs). A separate PSF was used for each object, as the WFPC2 PSF depends on the position of the object on the chip. The PSFs were generated with the Tiny Tim 6.1a software (Krist 1995). The fitting procedure is described in van Dokkum & Franx (1996). Fit parameters in the minimalization are the position, the effective radius , the surface brightness at the effective radius , the position angle, the ellipticity, and the sky value. Nearby objects and the edges of ccds were masked in the fits. We inspected the residual images, created by subtracting the best fitting models from the data, to assess the quality of the fit. In most cases the model provides a good fit to the data; exceptions are the S0/Sb galaxy 3C 295–568 and the active nucleus 3C 295–2014.
We empirically determined the errors in the fitted parameters by comparing the values derived from the two independent pointings, as the formal errors from the fit do not include the effects of undersampling. The results are shown in Fig. 3.2.1. The uncertainties in and are highly correlated, and as is well known the correlation is almost parallel to the relation (solid line) which enters the FP (see, e.g., Jørgensen, Franx, & Kjærgaard 1995a; van Dokkum & Franx 1996; Kelson et al. 2000a). Not surprisingly the correlation is also well described by the expected relation for total flux conservation (; broken line). The rms uncertainty in a single measurement is in , in , and in the FP combination . These uncertainties are negligible compared to the random errors in the velocity dispersions, and also to the systematic errors in the photometric calibration (see § 3.2.2).
![[Uncaptioned image]](/html/astro-ph/0609587/assets/x4.png)
Comparison of effective radii and surface brightnesses measured from two independent HST pointings. The errors in the two parameters are highly correlated. The broken line is the relation , and the solid line is the relation which enters the fundamental plane.
3.2.2 Calibration
Measured effective radii were converted to arcseconds using a pixel scale of pixel-1 for the Wide Field camera, and pixels-1 for the Planetary Camera. They were converted to kpc using our adopted cosmology. We note that the analysis in § 5 depends on the value of but not on the Hubble constant (see, e.g., van Dokkum et al. 1998a).
Surface brightnesses were converted to the HST Vega system using the appropriate zeropoints for each of the WFPC2 chips, as obtained from the WFPC2 Data Handbook,111See http://www.stsci.edu/instruments/wfpc2/Wfpc2_dhb/WFPC2_longdhbcover.html. and corrected for Galactic extinction using the Schlegel, Finkbeiner, & Davis (1998) maps. The extinction is highest in the CL 0016+16 field ( mag in the band). We did not correct for the long vs. short anomaly, as our fields are not very crowded, or the position-dependent charge transfer efficiency (CTE), as the backgrounds are relatively high.
For a meaningful comparison of galaxies observed at different redshifts the photometry has to be transformed to a common rest-frame band. At the observed band is close to the rest-frame band (denoted ). Following the methodology of van Dokkum & Franx (1996) we derived the following transformations from observed to rest-frame magnitudes:
| (1) | |||||
| (2) | |||||
| (3) |
for 3C 295, CL 0016+16, and CL 1601+42 respectively. For the synthetic band we used the Bessell (1990) filter. This filter is very similar to the Buser & Kurucz (1978) filter, which is used by Bruzual & Charlot (2003) for their stellar population synthesis calculations.
Using templates from Coleman, Wu, & Weedman (1980) we find that the transformations are independent of spectral type to . However, the colors that enter the transformations are obviously a strong function of spectral type. Measured colors are only available for CL 0016+16 (Smail et al. 1997), as the other clusters were observed in only one filter. For 3C 295 and CL 1601+42 we used synthetic colors derived from a redshifted Coleman et al. (1980) E/S0 template, as the measured colors for CL 0016+16 are a good match to this template. We find for 3C 295, and for CL 1601+42.
The uncertainties in the calibration are a combination of uncertainties in the WFPC2 zeropoints ( mag), the long-short anomaly and CTE effects ( mag), the extinction ( mag), and the conversion to rest-frame magnitudes. The uncertainty introduced by the lack of measured colors is only a few percent for CL 1601+42, as the color term is small. However, the effect can be substantial for the lower redshift cluster 3C 295: using an Sb/c template rather than an E/S0 template gives magnitudes that are mag brighter. Hence we estimate that the typical uncertainty mag for this cluster. We assume that the systematic errors are uncorrelated, and can be added in quadrature (see, e.g., Freedman et al. 2001). The combined calibration errors in the surface brightnesses are mag for 3C 295 and mag for CL 0016+16 and CL 1601+42.

4. The Fundamental Plane
The Fundamental Plane is an empirical relation between the effective radii , surface brightness at the effective radii , and the velocity dispersions of early-type galaxies of the form
| (4) |
(Djorgovski & Davis 1987). The coefficients and depend on wavelength, sample selection, and fitting method (see, e.g., Bernardi et al. 2003a). Jørgensen, Franx, & Kjærgaard (1996) find and in the band. We define , with the rest-frame band surface brightness at the effective radius in mag arcsec-2, corrected for cosmological surface brightness dimming. We note that for an r1/4-law fit the relation between and , the average surface brightness within the effective radius, is given by .
4.1. Edge-on Projection
The edge-on projections of the FPs in the three clusters are shown in Fig. 3. Solid circles are E and E/S0 galaxies, the solid triangle is an S0 galaxy, the open square is a merger system, and the open circle is the S0/Sb galaxy that was added to test whether we can measure rotation curves. Small dots are galaxies in the nearby Coma cluster from Jørgensen et al. (1996) (see § A.1).
The FP is well defined in each cluster: the elliptical galaxies in the clusters qualitatively follow very similar relations as the Coma galaxies. The FPs are offset with respect to Coma because of passive luminosity evolution of the stellar populations in the galaxies (see, e.g., van Dokkum & Franx 1996). The S0/Sb galaxy 3C 295–568 and the merger CL 1601–474 are outliers. The spiral galaxy falls below the relation defined by the other galaxies in 3C 295, consistent with results for spiral galaxies in the cluster CL 1358+62 (Kelson et al. 2000c). The merging galaxy falls above the CL 1601+42 relation, possibly because its velocity dispersion is overestimated due to the presence of light from its companion in the slit. Both galaxies were excluded from the analysis in § 5.

4.2. Scatter and Tilt of the Fundamental Plane
The galaxy samples in the individual clusters are too small to reliably determine the scatter in the FP. Hence the data for the three clusters are combined. For each galaxy the residual from the FP was calculated using
| (5) |
This procedure assumes that the intrinsic cluster-to-cluster scatter in the zeropoint of the FP is small compared to the galaxy-to-galaxy scatter within the clusters. The redshift term compensates for differential luminosity evolution over the redshift range spanned by the clusters, and the zeropoint is that of the Coma cluster (see § 5).
The scatter is calculated using the biweight estimator and its uncertainty is determined from bootstrap resampling. For the full sample of E and E/S0 galaxies (excluding the merger CL 1601–474) the scatter is in . This scatter is slightly higher than that measured in local clusters; e.g., Jørgensen et al. (1996) find an rms scatter of in . We use Monte Carlo simulations to determine whether the measured scatter can be fully explained by measurement errors (which are dominated by the errors in ). The errors imply an expected scatter of , and we conclude that the intrinsic scatter in this sample is in .
We investigate the cause of this scatter in Fig. 4, which shows the relation of the residuals from the FP with effective radius, velocity dispersion, and mass. Masses were determined using
| (6) |
The masses are approximate, as the constant in Eq. 6 depends on the details of the galaxy model, such as the brightness profile and the internal dynamical structure. There are clear systematic trends in the sample which are not present in the Coma sample. The residuals correlate with velocity dispersion and with mass: a Spearman rank test gives a probability of % that and are correlated, and a probability of % that and are correlated. Correlations with and are not significant according to the Spearman rank test. When the sample is limited to galaxies having km s-1 the observed scatter in reduces to ; galaxies with give a scatter of . Both values are consistent with the scatter due to measurement errors alone, and we conclude that the intrinsic scatter in the full sample of E/S0 galaxies is caused by the galaxies with the lowest masses.
Similar correlations were found by Wuyts et al. (2004) for a cluster at and by Jørgensen et al. (2006) for two clusters at and . Furthermore, recent studies of field early-type galaxies at have found the same qualitative trends (Treu et al. 2005b; van der Wel et al. 2005; di Serego Alighieri et al. 2005). The usual interpretation of these trends is that they are due to a combination of selection effects and evolution in the “tilt” of the FP (see, e.g., Treu et al. 2005a). The evolution in the tilt is taken as evidence for differential evolution in the ratio for galaxies of different mass, resulting from an underlying age-mass relation (with low mass early-type galaxies being younger than high mass early-type galaxies – see, e.g., Treu et al. 2005a; van der Wel et al. 2005). In vdMvD06b we show that these observed trends may be in part due to structural or kinematic evolution of low mass galaxies, as opposed to evolution of their ratios. In the following we restrict the discussion to galaxies with masses . As shown in vdMvD06b FP evolution is an unbiased measure of evolution for galaxies in this mass range.
Finally, we note that Kelson et al. (2000c) and Moran et al. (2005) do not find evidence for a change in the tilt of the FP for the clusters CL1̇358+62 at and CL 0024+16 at respectively, despite the use of large, high quality datasets. We also note that Wuyts et al. (2004) and Moran et al. (2005) report an increased intrinsic scatter in the FP compared to nearby clusters even for high mass galaxies, which is not seen in our sample or in CL 1358+62 (Kelson et al. 2000c). The available evidence suggests that the FPs of intermediate redshift clusters show a range of properties when studied in detail, perhaps due to the stochastic nature of the growth of clusters (see, e.g., Tran et al. 2005b; Moran et al. 2005). Studies of individual clusters should therefore be interpreted with caution.
5. Evolution of the Mean M/L Ratio
5.1. Procedure
Evolution of the zeropoint of the FP can be interpreted as a systematic change of the mean ratio with redshift. The conversion of zeropoint offsets to offsets in ratio assumes that early-type galaxies form a homologous family and that the FP is a manifestation of an underlying relation between the ratio of galaxies and other parameters (e.g., Faber et al. 1987). Starting from the empirical FP relation and assuming and , this underlying relation is
| (7) |
(e.g., Kelson et al. 2000c). The Jørgensen et al. (1996) -band coefficients imply that is largely a function of mass: . Different coefficients imply different relations; e.g., using a large sample of galaxies drawn from the Sloan Digital Sky Survey (SDSS) Bernardi et al. (2003a) find that correlates with effective radius with little or no dependence on .
Rather than determine relations between and other observables we follow the usual practice of determining the evolution in directly from the fundamental plane offset with respect to :
| (8) |
This procedure assumes that the observed change in intercept of the FP is caused by evolution of the ratio and that the coefficients and do not depend on the redshift. In vdMvD06b it is demonstrated that FP evolution thus defined yields an unbiased measure of evolution for galaxies with velocity dispersions km s-1 or masses . In practice we use the Coma cluster of galaxies to define the zeropoint (see Appendix A). This choice is arbitrary, as adding a constant to all value of does not change the results of our subsequent analysis in any way.
The coefficient for each cluster is determined by calculating the residual from the FP for each early-type galaxy with :
| (9) |
The cluster offset is the biweight mean (Beers, Flynn, & Gebhardt 1990) of the distribution of . For consistency with Jørgensen et al. (1996) we use and in Eqs. 8 and 9. As we show later the results are only very weakly dependent on the values of these parameters. For each cluster a random error and a systematic error is determined. The random error is the formal uncertainty in the biweight mean, or the expected uncertainty due to the errors in the individual measurements, if the latter exceeds the former. As discussed in § 3.2.1 random errors in the velocity dispersions dominate over those in the structural parameters. The minimum random error in is therefore approximately , with the average random uncertainty in the velocity dispersion and the number of galaxies in the sample. Systematic errors are described for each cluster individually below.
5.2. Other Clusters
Including the three clusters presented here there are now more than a dozen clusters in the redshift range 0.2 to 1.3 for which FP measurements have been made. Furthermore, at low redshift the SDSS has provided important new information unhampered by uncertainties in peculiar motions and small number statistics. We combine published data with our own to compile a sample consisting of the Coma cluster, the SDSS sample, and fourteen distant clusters with homogeneous FP measurements. With one exception, the criteria for including distant clusters are 1) published data for individual galaxies, and 2) sufficient information to bring the data to a consistent system (i.e., colors, aperture corrections, etc). The exception is RX J1226+33 at : data of individual galaxies in that cluster are not yet published, but they were provided to us by I. Jørgensen. Details on the individual clusters and the derivation of systematic uncertainties are given in Appendix A, and the offsets are listed in Table 3. The uncertainties include neither the propagation of uncertainties in and , nor the propagation of uncertainties in distance due to cosmic variance in (i.e., the expansion factor having somewhat different value when averaged over small scales than when averaged over large scales). This simplification is justified by the fact that these uncertainties are generally not the dominant uncertainty in the analysis (see vdMvD06b).
TABLE 3
Offsets
| Sample | ||||
|---|---|---|---|---|
| Coma | 0.024 | 16 | 0.000 | 0.029 |
| SDSS, | 0.109 | 171 | 0.031 | |
| Abell 2218 | 0.176 | 8 | 0.037 | |
| Abell 665 | 0.183 | 5 | 0.040 | |
| Abell 2390 | 0.228 | 5 | 0.065 | |
| CL 1358+62 | 0.327 | 16 | 0.029 | |
| CL 0024+16 | 0.391 | 6 | 0.040 | |
| 3C 295 | 0.456 | 2 | 0.053 | |
| CL 1601+42 | 0.539 | 8 | 0.043 | |
| CL 0016+16 | 0.546 | 7 | 0.032 | |
| MS 2053–04 | 0.583 | 8 | 0.056 | |
| MS 1054–03 | 0.831 | 12 | 0.040 | |
| RX J0152–13 | 0.837 | 13 | 0.048 | |
| RX J1226+33 | 0.892 | 5 | 0.056 | |
| RDCS 1252–29 | 1.237 | 4 | 0.116 | |
| RDCS 0848+44 | 1.276 | 2 | 0.069 | |
| SDSS, | 0.114 | 1519 | 0.031 | |
| Field | 0.380 | 8 | 0.058 | |
| — | 0.468 | 10 | 0.061 | |
| — | 0.563 | 10 | 0.071 | |
| — | 0.747 | 10 | 0.064 | |
| — | 0.563 | 10 | 0.071 | |
| — | 0.747 | 10 | 0.064 | |
| — | 0.844 | 10 | 0.077 | |
| — | 0.851 | 10 | 0.053 | |
| — | 0.951 | 10 | 0.105 | |
| — | 1.016 | 10 | 0.052 | |
| — | 1.110 | 9 | 0.055 |
5.3. Observed Evolution and Scatter
The observed evolution of the ratio of massive cluster galaxies is shown in Fig. 5.3. There is a clear relation, with galaxies in clusters at high redshift having lower ratios than those at low redshift, consistent with previous studies of smaller samples (e.g., van Dokkum & Franx 1996; van Dokkum et al. 1998a; Kelson et al. 1997; Holden et al. 2005). The best-fitting linear function has a slope
| (10) |
and is indicated in Fig. 5.3. This evolution is stronger than inferred from previous studies that were based on smaller samples. For example, van Dokkum & Stanford (2003) find a slope of and Holden et al. (2005) find . This difference is largely due to sample size: if we limit the sample to the six clusters from van Dokkum & Stanford or the seven clusters from Holden et al., we find slopes of and respectively, consistent with their results. We also note that our treatment of systematic errors is different from previous studies, which leads to slightly different fits (with different quoted uncertainties), even for the same data.
![[Uncaptioned image]](/html/astro-ph/0609587/assets/x7.png)
Redshift evolution of the mean ratio of cluster galaxies with masses in our composite sample. The solid line shows the best fitting linear function, with slope . Dotted lines indicate the uncertainty in the slope of the relation.
The quoted uncertainty in the fit does not include all sources of systematic error. We first investigate the effects of the choice of coefficients of the FP (which have some uncertainty; see, e.g., Bernardi et al. 2003a; Cappellari et al. 2006). Varying from to produces best fitting slopes ranging from to and varying from to gives slopes in the range to . We conclude that the precise FP coefficients do not have a large effect on the derived redshift evolution.
Another source of uncertainty is the selection of the clusters. Some are selected in the optical (e.g., CL 1601+42 and CL 0016+16), others in X-rays (e.g., MS 2053–04 and MS 1043–03). Furthermore, the low redshift Coma cluster and Bernardi et al. sample may not be representative for the descendants of the (very massive) high redshift clusters in the sample. The data are insufficient to investigate the evolution of subsamples selected by X-ray luminosity, mass, or other parameters. However, we can assess the effects of removing datapoints, and determine whether the fit is driven by some individual clusters. Removing the Bernardi sample changes the best fitting slope by to . Removing Coma changes the slope by . Removing both Coma and the Bernardi sample changes the slope by . The latter test effectively transfers the low redshift comparison point to the very rich clusters Abell 665, Abell 2218, and Abell 2390, which may be appropriate for the descendants of massive clusters like MS 1054–03 at . All these changes are very small, and well within the formal uncertainty in the fit. The cluster with the largest effective weight in the fit is RDCS 0848+44 at : removing this cluster changes the slope by to . The large influence of this single cluster highlights the importances of obtaining more FP measurements for cluster galaxies at .
The sample is sufficiently large to determine the scatter in the best-fitting linear relation. The of the fit is 20.4 with 14 degrees of freedom, which implies that a linear function is an adequate description of the data and that the scatter can be explained by the measurement uncertainties. The maximum allowed intrinsic cluster-to-cluster scatter can be determined by requiring that , which for 14 degrees of freedom corresponds to a one-sided probability . Iteratively adding uncertainty due to intrinsic scatter in quadrature to the errors listed in Table 3 we find that for an additional uncertainty of . The 90 % confidence upper limit on the intrinsic cluster-to-cluster scatter is therefore in .
6. Implications
6.1. The Star Formation Epoch of Massive Cluster Galaxies
The observed evolution of the ratio of early-type galaxies depends on cosmological parameters, the star formation histories of the galaxies, their initial mass function (IMF) and metallicity, possible changes in dust content with redshift, and selection effects. Although the dependence on cosmological parameters can, in principle, be exploited (see, e.g., Pahre, Djorgovski, & de Carvalho 1996; van Dokkum et al. 1998a; Jørgensen et al. 1999; Lubin & Sandage 2001), we assume here that the evolution of galaxies and their stellar populations is currently more uncertain than the values of and (which are the relevant parameters). We also assume that dust is either absent in early-type cluster galaxies or non-evolving over the redshift range . The star formation history is parameterized with a single age for the entire stellar population. This is almost certainly incorrect as most early-type galaxies likely have extended and complex star formation histories at early times (e.g., Nagamine et al. 2005; Knudsen et al. 2005; Papovich et al. 2006). However, as shown by, e.g., van Dokkum et al. (1998b) the evolution of a complex stellar population can be well approximated by that of a single-age stellar population of the same luminosity-weighted age, provided that star formation has ceased Gyr before the epoch of observation.
Figure 6.1 shows the predicted age-dependence of the ratio for different assumptions about the IMF, the metallicity, and the implementation of horizontal branch stars in the population synthesis code. Solid lines are various Bruzual & Charlot (2003) models, using the Salpeter (1955) and Chabrier (2003) IMFs and [Fe/H] ranging from Solar to . Broken lines are various models of Maraston (2005), whose implementation of the late stages of stellar evolution differs from that of Bruzual & Charlot (2003). The Maraston models that are shown are for Salpeter (1955) and Kroupa (2001) IMFs, metallicities ranging from Solar to , and four different implementations of the horizontal branch. All models were normalized in order to emphasize the predicted rate of evolution rather than the absolute ratios at any given time (which vary greatly between the models).
The predictions are very similar, demonstrating that the predicted evolution is not very dependent on the metallicity, IMF, or particulars of the stellar population synthesis code. An important caveat is that the Salpeter (1955), Kroupa (2001), and Chabrier (2003) IMFs, while different, were all derived from Galactic data, and the IMF of the (progenitors of) early-type galaxies may have been weighted more toward very massive stars (see, e.g., Larson 1998). We will return to this issue in § 7.
![[Uncaptioned image]](/html/astro-ph/0609587/assets/x8.png)
Evolution of the ratio of a single age stellar population, with arbitrary scaling. Solid lines are Bruzual & Charlot (2003) models with different metallicities and IMFs. Broken lines are Maraston (2005) models with different metallicities, IMFs, and implementation of horizontal branch stars. The predicted evolution is very similar in all models. The red line is the best-fitting powerlaw to a Solar metallicity, Salpeter (1955) IMF Bruzual & Charlot (2003) model.
As first shown by Tinsley (1980) the predicted evolution of the ratio of a single-age stellar population can be approximated by a powerlaw of the form
| (11) |
with the formation time of the stars. It can be deduced from the data shown in Fig. 6.1 that for any individual model this approximation is accurate to a few percent over the age range . Fitting powerlaws to all these models gives values of in the range 0.93–1.01. A Solar metallicity Bruzual & Charlot (2003) model with a Salpeter (1955) IMF gives a value of 0.97, and in the following we take . We note that the synthetic filter adopted by Bruzual & Charlot (the Buser & Kurucz [1978] filter) is very similar to the Bessell (1990) filter which we use.
As emphasized by Franx (1993) and van Dokkum & Franx (2001) the observed evolution of the ratio may underestimate the true evolution because of selection effects. If galaxies undergo morphological evolution and transform from late-type galaxies into early-type galaxies at moderate redshift (see, e.g., Dressler et al. 1997) the youngest progenitors of today’s early-type galaxies drop out of the sample at high redshift. This “progenitor bias” leads to biased age estimates, as we trace only the oldest galaxies and not the full population of all progenitor galaxies. The significance of the effect can be estimated from the observed evolution of the early-type galaxy fraction in clusters and from the observed scatter in the color-magnitude relation and FP (see van Dokkum & Franx 2001). The maximum effect on the evolution of the ratio occurs if late-type galaxies are continuously transformed into early-type galaxies and the scatter in the color-magnitude relation is entirely due to age variations. In that extreme case the observed luminosity evolution underestimates the true evolution by . The true effect is probably smaller than the maximum value, especially given recent evidence that the evolution of the early-type galaxy fraction out to is weakest for the most massive objects (Holden et al. 2006). We conservatively assume , which encompasses the full range of possibilities.
With these assumptions and approximations the only free parameter is the time of formation of the stars (or the corresponding redshift ). We determined the most likely value and its associated uncertainty using Monte Carlo simulations. In each simulation, each data point listed in Table 3 was perturbed by a value drawn from a Gaussian distribution with a dispersion equal to the uncertainty. Next, progenitor bias was taken into account by decreasing all the measured ratios by , with drawn from a top-hat probability distribution bounded by zero and . Finally, Eq. 11 was fit to the perturbed data to obtain , with the value of drawn from a top-hat distribution bounded by and . From 1000 simulations we find that the mean luminosity weighted formation redshift of the stars in massive cluster early-type galaxies , where the uncertainties indicate the 68 % confidence interval. The best fitting model is shown in Fig. 6.1. Ignoring progenitor bias (i.e., setting ) gives .
![[Uncaptioned image]](/html/astro-ph/0609587/assets/x9.png)
Evolution of the mean ratio of massive cluster galaxies with time. Open symbols are the same datapoints as shown in Fig. 5.3. Solid symbols with errorbars are offset by to account for progenitor bias (see text). The solid line shows the best fitting model for a Salpeter-like IMF, which has a formation redshift of the stars . The broken line shows a model with a top-heavy IMF (slope ) and a formation redshift (see § 7).
6.2. Comparison to Field Galaxies
6.2.1 Data
Several recent studies of the fundamental plane of field early-type galaxies have found that the most massive field galaxies out to have similar ratios as the most massive cluster galaxies (e.g., Treu et al. 2005a; van der Wel et al. 2005). However, di Serego Alighieri, Lanzoni, & Jørgensen (2006) find that massive cluster galaxies are much older than massive field galaxies, based on a comparison of data from Treu et al. (2005a) (for field galaxies) and Jørgensen et al. (2006) (for cluster galaxies) at . Here we quantify the difference between field and cluster early-types with using our sample of fourteen distant clusters and self-consistent modeling of the field and cluster data.
The field samples of van Dokkum et al. (2001), van Dokkum & Ellis (2003), Treu et al. (2005b), and van der Wel et al. (2005) are used. Details are given in Appendix B. Masses and offsets in ratio were calculated in the same way as for the cluster samples (see § 5.1). The sample comprises 87 galaxies with , ranging in redshift from 0.32 to 1.14. The sample was divided in bins of 10 galaxies (with the lowest and highest redshift bins containing 8 and 9 galaxies respectively), and the central redshift and ratio of each bin were determined using the biweight estimator. The datapoints are listed in Table 3 and shown in Fig. 6.2.2, along with the cluster data (not corrected for progenitor bias). The low redshift point is determined from the Bernardi et al. (2003a) sample (see Appendix A). The ratios of massive field and cluster galaxies are very similar.
6.2.2 Modeling Approach
The evolution of field and cluster galaxies can be described by
| (12) | |||||
| (13) |
The standard approach for determining the star formation epoch of field galaxies is the same as for cluster galaxies: the rate of evolution of the ratio is used to determine the luminosity-weighted star formation epoch , and is a free parameter in the fit (see, e.g., Treu et al. 2002, 2005a, 2005b; van der Wel et al. 2005; di Serego Alighieri et al. 2005). However, this approach is not self-consistent when the evolution of field galaxies is compared to that of cluster galaxies. If field galaxies are younger than cluster galaxies, their mean ratio evolves faster and is offset from that of cluster galaxies. A self-consistent model which describes the evolution of field and cluster galaxies has , and has three rather than four free parameters (, , and ).
The contrast between self-consistent models and standard models is illustrated in Fig. 6.2.2. The standard approach (broken blue lines) allows models which have different formation redshifts for field and cluster galaxies to go through the same point at some redshift, in practice (see, e.g., Treu et al. 2005b). The implication is that the difference in ratio between field and cluster galaxies changes sign at . This is not impossible, as it may be that field galaxies have a different dust content, IMF, metallicity, or progenitor bias than cluster galaxies. However, this would mean that we live at a very special time, namely the only time in the past or future of the universe when one or more of these effects exactly cancel the difference in ratio resulting from the age difference between field and cluster galaxies. It would also imply that , as differences in would in most models be accompanied by differences in the rate of evolution. The approach followed in this paper is illustrated by the solid blue lines in Fig. 6.2.2: differences in age result in a different rate of evolution and an offset in ratio, such that the models converge at rather than intersect at the present age of the Universe.
![[Uncaptioned image]](/html/astro-ph/0609587/assets/x10.png)
Evolution of the mean ratio of field galaxies with from the literature (blue open symbols) compared to that of cluster galaxies with (red solid symbols). Thin horizontal lines show the range of redshifts covered in each bin. No corrections for progenitor bias were applied. The red line shows the best fitting model to the cluster galaxies. The broken blue line shows a fit to the field galaxies only, and the solid blue line shows a self-consistent fit to the field galaxies given a model for the cluster galaxies (see § 6.2). The age difference between massive field and cluster galaxies is small at %.
![[Uncaptioned image]](/html/astro-ph/0609587/assets/x11.png)
Illustration of different ways to model the evolution of the ratio of field galaxies. The red line shows the evolution of a stellar population formed at , appropriate for cluster galaxies. Blue lines show the evolution of field galaxies with (top) and (bottom) respectively. Broken blue lines illustrate the standard fitting approach, which allows models to intersect at . Solid blue lines show the self-consistent modeling approach adopted in the present study.
6.2.3 Results
We determine the star formation epoch of field galaxies given a model for cluster galaxies ( and ). For simplicity we ignore progenitor bias: the relative age of cluster and field galaxies is insensitive to this bias as long as it is similar for both populations. Taking for cluster galaxies and fixing the zeropoint of the model we find for field galaxies, or an age difference of % at the present day. Note that the quoted error does not include the uncertainty in the fit to cluster galaxies. Changing the amount of progenitor bias leads to negligible changes in this result, as long as the bias is the same for field and cluster galaxies.
The significance of this difference is assessed using Monte Carlo simulations, which take the uncertainty in the fit to the cluster galaxies into account. In each simulation the ratios of cluster and field galaxies were perturbed by values drawn from Gaussian distributions with dispersions equal to the uncertainties. Next the formation redshift of cluster galaxies was determined, with the zeropoint of the model a free parameter in the fit. The formation redshift of field galaxies was also determined, with the zeropoint of the model fixed to the value that was derived from the cluster galaxies. Finally, the age difference was calculated from the formation redshifts. From 1000 simulations we find that the age difference between massive field and cluster galaxies is 4.1 % 2.0 %. Cluster galaxies are older than field galaxies in 98 % of the simulations.
7. Discussion and Conclusions
In this paper we presented new measurements of kinematics and structural parameters in three distant galaxy clusters. In vdMvD06a,b the spatially-resolved photometric and kinematic profiles of the galaxies are used to measure the evolution of the ratio independent of many assumptions that enter the FP analysis. In the present study we focused on the FP, and the implications for the star formation epoch of the most massive galaxies in clusters and in the field.
We find that the stars in massive early-type galaxies in clusters have a mean luminosity weighted formation redshift . The implied ages are somewhat younger than most previous studies, which were based on smaller samples (e.g., Holden et al. 2005). The quoted error reflects a combination of uncertainties in the data points, the stellar population synthesis models, and the significance of progenitor bias. In particular, varying the amount of progenitor bias from zero to the maximum allowed by the van Dokkum & Franx (2001) models [ in )] leads to a range in of . A special form of progenitor bias is “dry” merging, i.e., (nearly) dissipationless mergers of early-type galaxies (e.g., Tran et al. 2005b; van Dokkum 2005; Bell et al. 2006; De Lucia et al. 2006). Numerical simulations suggest that these mergers preserve the edge-on projection of the FP relation (e.g., González-García & van Albada 2003; Boylan-Kolchin, Ma, & Quataert 2006; Robertson et al. 2006), which would imply that our analysis is insensitive to this effect.
The main source of uncertainty that our analysis does not (fully) take into account is the form of the IMF. The rate of evolution, as parameterized by in our analysis, is very dependent on the logarithmic slope of the IMF in the range . Tinsley (1980) finds , where is the slope of the IMF, and the more recent Worthey (1994) models give . Although we explored the values of for most commonly used IMFs (Salpeter 1955; Kroupa 2001; Chabrier 2003) these are all very similar in the region around one Solar mass. These IMFs are probably appropriate for star formation in present-day disk galaxies, but may not be applicable to (the progenitors of) early-type galaxies. As is well known the large mass of heavy elements observed in the hot gas of massive clusters, the abundance ratios of early-type galaxies, numerical simulations of star formation at very high redshift, and other lines of evidence suggest that the IMF may have been top-heavy at early times (see, e.g., Worthey, Faber, & Gonzalez 1992; Larson 1998; Schneider et al. 2002, and references therein). The top-heavy IMF preferred by Nagashima et al. (2005) has (where is the Salpeter [1955] slope), which implies . This value of gives a best fitting formation redshift of , higher than the range derived for Salpeter-like IMFs. This model is shown by the broken line in Fig. 6.1. We note that our observations probe a very different range of stellar masses than the abundance studies ( versus ), and that a top-heavy IMF does not necessarily imply an overall change in the slope but could instead be caused by a time-varying characteristic mass (Larson 1998).
Interestingly, there is some indirect evidence for a top-heavy IMF from the combination of our data with recent results for galaxies at higher redshifts. Although many massive galaxies at are still in the process of forming stars (see § 1), there is also a population with very low specific star formation rates and strong Balmer/4000 Å breaks (e.g., Kriek et al. 2006a,b). These objects formed most of their stars at redshifts or beyond, inconsistent with the star formation epoch that we derive for Salpeter-like IMFs but in agreement with our results for a top-heavy IMF. Alternative explanations are also possible; e.g., the apparently old galaxies may be “rejuvenated” at later times (see, e.g., Treu et al. 2005b), or they could simply be the oldest objects in a wide distribution of progenitor galaxies.
The age difference between massive field and cluster galaxies is better constrained than their absolute ages, as it is less affected by the uncertainty in the IMF. Our self-consistent modeling approach gives different constraints than the standard approach, as it has less free parameters. Assuming that progenitor bias is similar for massive cluster and field galaxies, they have a Salpeter-like IMF, and they have the same metallicity and dust content at a given mass, we find that massive field galaxies are younger than massive cluster galaxies, but that the difference is small at % (or Gyr). If a top-heavy IMF with is assumed for both field and cluster galaxies the age difference is 3.0 % 1.5 %.
We note that the quoted errors do not include systematic errors in the comparison of field and cluster galaxies, which are difficult to quantify. Possible sources of such errors are differences in dynamical structure that deviate from pure homology, selection effects induced by the magnitude limits of the field samples (although these effects are more relevant for low mass galaxies; see Treu et al. 2005, van der Wel et al. 2005), a difference in and/or (which would reflect differences in the IMF or the metallicity), and a difference in the amount of progenitor bias. We tested the effect of a difference in progenitor bias by assuming that cluster early-type galaxies are not affected by it whereas the ratios of field early-type galaxies need to be corrected by . In that case the age difference increases by a factor of two, to %. The importance of progenitor bias is bounded by the observed scatter in the color-magnitude relation of early-type galaxies (van Dokkum & Franx 2001). In clusters this scatter remains low all the way to (Mei et al. 2006), but it is not yet clear whether this also applies to massive field early-type galaxies (see, e.g., Ferreras et al. 2005).
The small age difference we find is consistent with most, but not all, previous studies. It is consistent with the high redshift field FP studies of Treu et al. (2005b) and van der Wel et al. (2005), the analysis of a sample of gravitational lenses by Rusin & Kochanek (2005), and with studies of the local Mg2 – relation and FP by Bernardi et al. (1998, 2003a, 2006). However, other studies find larger age differences (always in the sense that field galaxies are younger than cluster galaxies). For nearby massive early-type galaxies, Thomas et al. (2005) and Clemens et al. (2006) find age differences of 1.5 – 2 Gyr from complex models which include age, metallicity, -enhancement, and (in the case of Clemens et al.) Carbon-enhancement as free parameters. Such large age differences are inconsistent with our analysis at . Perhaps most importantly, our results are not in agreement with the recent study of di Serego Alighieri et al. (2006), who compare the ratios of field galaxies at from Treu et al. (2005b) and di Serego Alighieri et al. (2005) to that of galaxies in two clusters with mean redshift from Jørgensen et al. (2006). For galaxies with masses di Serego Alighieri et al. (2006) find a very large age difference of 3.5 – 4 Gyr (their Fig. 4). The source of the discrepancy between their results and ours is, at least in part, due to the cluster data that are used in the comparison to field galaxies. As discussed in Appendix A the ratios of the galaxies in the Jørgensen et al. (2006) study need to be corrected downward by a factor . Applying this offset to the cluster galaxies in Figs. 1 and 2 of di Serego Alighieri et al. (2006) brings them in line with the field galaxies.222See also the erratum published by di Serego Alighieri et al. (2006) in response to our discovery of this discrepancy. Their revised conclusions are consistent with those presented here.
The small age difference between massive field and cluster early-type galaxies that we find is remarkable in the context of “standard” hierarchical models, which had predicted that early-type galaxies in clusters have much older stellar populations than those in the general field (e.g., Baugh, Cole, & Frenk 1996; Kauffmann 1996; Kauffmann & Charlot 1998). Specifically, as shown in van Dokkum et al. (2001), the models of Kauffmann et al. (1999) and Diaferio et al. (2001) predicted a systematic offset between field and cluster galaxies of in at all redshifts, clearly at odds with observations. The reason for this environmental dependence in these models is that gas cooling and subsequent star formation continues as long as a galaxy is the central galaxy in its halo. Star formation terminates when a galaxy becomes a satellite in a larger halo, which naturally leads to a large population of “red and dead” galaxies in clusters and blue star forming galaxies in the field. This inability of standard models to produce red field galaxies is well known, and among proposed solutions is to prevent cooling by postulating that the gas is heated by a central active galactic nucleus (AGN) (e.g., Bower et al. 2006; Kang, Jing, & Silk 2006; Croton et al. 2006). The recent study of De Lucia et al. (2006) incorporates such AGN feedback in a very large cosmological simulation. In their simulation, the median star formation epoch for elliptical galaxies with masses , in good agreement with our results. Furthermore, judging from their Fig. 7 the difference in age between ellipticals in halos of and is only Gyr, consistent with our study. We note that this success does not necessarily imply that the models can reproduce the observed evolution of the FP. Building on the semi-analytical models of Baugh et al. (2005) and Bower et al. (2006), Almeida, Baugh, & Lacey (2006) find that evolution in the radii of early-type galaxies compensates for the evolution in their ratios, such that the zeropoint of the FP is approximately constant with redshift – inconsistent with the observations.
Taken at face value, the age difference between field and cluster galaxies is Gyr, which should be fairly easily detectable at . Interestingly, this number agrees reasonably well with the age difference that Steidel et al. (2005) find comparing Lyman break galaxies in the general field to those in a proto-cluster at . It is also qualitatively consistent with the finding that red galaxies at cluster more strongly than blue galaxies (Quadri et al. 2006).
References
- (1)
- (2) Almeida, C., Baugh, C. M., & Lacey, C. G. 2006, MNRAS, submitted (astro-ph/0608544)
- (3)
- (4) Baugh, C. M., Cole, S., & Frenk, C. S. 1996, MNRAS, 283, 1361
- (5)
- (6) Baugh, C. M., Lacey, C. G., Frenk, C. S., Granato, G. L., Silva, L., Bressan, A., Benson, A. J., & Cole, S. 2005, MNRAS, 356, 1191
- (7)
- (8) Beers, T. C., Flynn, K., & Gebhardt, K. 1990, AJ, 100, 32
- (9)
- (10) Bell, E. F., Naab, T., McIntosh, D. H., Somerville, R. S., Caldwell, J. A. R., Barden, M., Wolf, C., Rix, H.-W., et al. 2006, ApJ, 640, 241
- (11)
- (12) Bernardi, M., Nichol, R. C., Sheth, R. K., Miller, C. J., & Brinkmann, J. 2006, AJ, 131, 1288
- (13)
- (14) Bernardi, M., Renzini, A., da Costa, L. N., Wegner, G., Alonso, M. V., Pellegrini, P. S., Rité, C., & Willmer, C. N. A. 1998, ApJ, 508, L143
- (15)
- (16) Bernardi, M., Sheth, R. K., Annis, J., Burles, S., Eisenstein, D. J., Finkbeiner, D. P., Hogg, D. W., Lupton, R. H., et al. 2003a, AJ, 125, 1866
- (17)
- (18) Bernardi, M., Sheth, R. K., Annis, J., Burles, S., Eisenstein, D. J., Finkbeiner, D. P., Hogg, D. W., Lupton, R. H., et al. 2003b, AJ, 125, 1817
- (19)
- (20) Bessell, M. S. 1990, PASP, 102, 1181
- (21)
- (22) Blakeslee, J. P., Holden, B. P., Franx, M., Rosati, P., Bouwens, R. J., Demarco, R., Ford, H. C., et al. 2006, ApJ, 644, 30
- (23)
- (24) Bower, R. G., Benson, A. J., Malbon, R., Helly, J. C., Frenk, C. S., Baugh, C. M., Cole, S., & Lacey, C. G. 2006, MNRAS, 370, 645
- (25)
- (26) Boylan-Kolchin, M., Ma, C.-P., & Quataert, E. 2006, MNRAS, 534
- (27)
- (28) Bruzual, G. & Charlot, S. 2003, MNRAS, 344, 1000
- (29)
- (30) Buser, R., & Kurucz, R. L. 1978, A&A, 70, 555
- (31)
- (32) Cappellari, M., Bacon, R., Bureau, M., Damen, M. C., Davies, R. L., de Zeeuw, P. T., Emsellem, E., Falcón-Barroso, J., et al. 2006, MNRAS, 366, 1126
- (33)
- (34) Chabrier, G. 2003, PASP, 115, 763
- (35)
- (36) Clemens, M. S., Bressan, A., Nikolic, B., Alexander, P., Annibali, F., & Rampazzo, R. 2006, MNRAS, 649
- (37)
- (38) Coleman, G. D., Wu, C.-C., & Weedman, D. W. 1980, ApJS, 43, 393
- (39)
- (40) Croton, D. J, Springel, V., White, S. D. M., De Lucia, G., Frenk, C. S., Gao, L., Jenkins, A., Kauffmann, G., et al. 2006, MNRAS, 365, 11
- (41)
- (42) Daddi, E., Röttgering, H. J. A., Labbé, I., Rudnick, G., Franx, M., Moorwood, A. F. M., Rix, H. W., van der Werf, P. P., & van Dokkum, P. G. 2003, ApJ, 588, 50
- (43)
- (44) Daddi, E., Cimatti, A., Renzini, A., Vernet, J., Conselice, C., Pozzetti, L., Mignoli, M., Tozzi, P., et al. 2004, ApJ, 600, L127
- (45)
- (46) De Lucia, G., Springel, V., White, S. D. M., Croton, D., & Kauffmann, G. 2006, MNRAS, 366, 499
- (47)
- (48) Diaferio, A., Kauffmann, G., Balogh, M. L., White, S. D. M., Schade, D., & Ellingson, E. 2001, MNRAS, 323, 999
- (49)
- (50) di Serego Alighieri, S., Lanzoni, B., & Jørgensen, I. 2006, ApJ, 647, L99
- (51)
- (52) di Serego Alighieri, S., Vernet, J., Cimatti, A., Lanzoni, B., Cassata, P., Ciotti, L., Daddi, E., Mignoli, M., et al. 2005, A&A, 442, 125
- (53)
- (54) Djorgovski, S. & Davis, M. 1987, ApJ, 313, 59
- (55)
- (56) Dressler, A., Oemler, A. J., Couch, W. J., Smail, I., Ellis, R. S., Barger, A., Butcher, H., Poggianti, B. M., et al. 1997, ApJ, 490, 577
- (57)
- (58) Faber, S. M., Dressler, A., Davies, R. L., Burstein, D., Lynden-Bell, D., Terlevich, R., Wegner, G. 1987, in Nearly Normal Galaxies, ed. S. M. Faber (New York: Springer), 175
- (59)
- (60) Ferreras, I., Lisker, T., Carollo, C. M., Lilly, S. J., Mobasher, B. 2005, ApJ, 635, 243
- (61)
- (62) Förster Schreiber, N. M., van Dokkum, P. G., Franx, M., Labbé, I., Rudnick, G., Daddi, E., Illingworth, G. D., Kriek, M., et al. 2004, ApJ, 616, 40
- (63)
- (64) Franx, M. 1993, PASP, 105, 1058
- (65)
- (66) Franx, M., Labbé, I., Rudnick, G., van Dokkum, P. G., Daddi, E., Förster Schreiber, N. M., Moorwood, A., Rix, H., et al. 2003, ApJ, 587, L79
- (67)
- (68) Freedman, W. L., Madore, B. F., Gibson, B. K., Ferrarese, L., Kelson, D. D., Sakai, S., Mould, J. R., et al. 2001, ApJ, 553, 47
- (69)
- (70) Fritz, A., Ziegler, B. L., Bower, R. G., Smail, I., & Davies, R. L. 2005, MNRAS, 358, 233
- (71)
- (72) Fukugita, M., Ichikawa, T., Gunn, J. E., Doi, M., Shimasaku, K., & Schneider, D. P. 1996, AJ, 111, 1748
- (73)
- (74) Gómez, P. L., Hughes, J. P., & Birkinshaw, M. 2000, ApJ, 540, 726
- (75)
- (76) González-García, A. C. & van Albada, T. S. 2003, MNRAS, 342, L36
- (77)
- (78) Grazian, A., Fontana, A., Moscardini, L., Salimbeni, S., Menci, N., Giallongo, E., de Santis, C., Gallozzi, S., et al. 2006, A&A, 453, 507
- (79)
- (80) Guzman, R., Koo, D. C., Faber, S. M., Illingworth, G. D., Takamiya, M., Kron, R. G., & Bershady, M. A. 1996, ApJ, 460, L5
- (81)
- (82) Holden, B. P., van der Wel, A., Franx, M., Illingworth, G. D., Blakeslee, J. P., van Dokkum, P., Ford, H., Magee, D., et al. 2005, ApJ, 620, L83
- (83)
- (84) Holden, B. P., Franx, M., Illingworth, G. D., Postman, M., Blakeslee, J. P., Homeier, N., Demarco, R., et al. 2006, ApJ, 642, L123
- (85)
- (86) Holtzman, J. A., Burrows, C. J., Casertano, S., Hester, J. J., Trauger, J. T., Watson, A. M., & Worthey, G. 1995, PASP, 107, 1065
- (87)
- (88) Hudson, M. J., Lucey, J. R., Smith, R. J., Schlegel, D. J., & Davies, R. L. 2001, MNRAS, 327, 265
- (89)
- (90) Jørgensen, I., Bergmann, M., Davies, R., Barr, J., Takamiya, M., & Crampton, D. 2005, AJ, 129, 1249
- (91)
- (92) Jørgensen, I., Chiboucas, K., Flint, K., Bergmann, M., Barr, J., & Davies, R. 2006, ApJ, 639, L9
- (93)
- (94) Jørgensen, I., Franx, M., Hjorth, J., & van Dokkum, P. G. 1999, MNRAS, 308, 833
- (95)
- (96) Jørgensen, I., Franx, M., & Kjærgaard, P. 1992, A&AS, 95, 489
- (97)
- (98) Jørgensen, I., Franx, M., & Kjærgaard, P. 1995a, MNRAS, 273, 1097
- (99)
- (100) Jørgensen, I., Franx, M., & Kjærgaard, P. 1995b, MNRAS, 276, 1341
- (101)
- (102) —. 1996, MNRAS, 280, 167
- (103)
- (104) Kang, X., Jing, Y. P., & Silk, J. 2006, ApJ, 648, 820
- (105)
- (106) Kauffmann, G. 1996, MNRAS, 281, 487
- (107)
- (108) Kauffmann, G. & Charlot, S. 1998, MNRAS, 297, L23
- (109)
- (110) Kauffmann, G., Colberg, J. M., Diaferio, A., & White, S. D. M. 1999, MNRAS, 303, 188
- (111)
- (112) Kelson, D. D. 2003, PASP, 115, 688
- (113)
- (114) Kelson, D. D., Illingworth, G. D., van Dokkum, P. G., & Franx, M. 2000a, ApJ, 531, 137
- (115)
- (116) —. 2000b, ApJ, 531, 159
- (117)
- (118) —. 2000c, ApJ, 531, 184
- (119)
- (120) Kelson, D. D., van Dokkum, P. G., Franx, M., Illingworth, G. D., & Fabricant, D. 1997, ApJ, 478, L13
- (121)
- (122) Knudsen, K. K., van der Werf, P., Franx, M., Förster Schreiber, N. M., van Dokkum, P. G., Illingworth, G. D., Labbé, I., Moorwood, A., et al. 2005, ApJ, 632, L9
- (123)
- (124) Kriek, M., van Dokkum, P., Franx, M., Forster Schreiber, N., Gawiser, E., Illingworth, G., Labbe, I., Marchesini, D., et al. 2006, ApJ, 645, 44
- (125)
- (126) Kriek, M., van Dokkum, P., Franx, M., Quadri, R., Gawiser, E., Herrera, D., Illingworth, G., Labbé, I., et al. 2006, ApJ, in press (astro-ph/0608446)
- (127)
- (128) Krist, J. 1995, in ASP Conf. Ser. 77: Astronomical Data Analysis Software and Systems IV, Vol. 4, 349
- (129)
- (130) Kroupa, P. 2001, MNRAS, 322, 231
- (131)
- (132) Labbé, I., Franx, M., Rudnick, G., Schreiber, N. M. F., Rix, H., Moorwood, A., van Dokkum, P. G., van der Werf, P., et al. 2003, AJ, 125, 1107
- (133)
- (134) Labbé, I., Huang, J., Franx, M., Rudnick, G., Barmby, P., Daddi, E., van Dokkum, P. G., Fazio, G. G., et al. 2005, ApJ, 624, L81
- (135)
- (136) Larson, R. B. 1998, MNRAS, 301, 569
- (137)
- (138) Le Borgne, J. F., Pello, R., & Sanahuja, B. 1992, A&AS, 95, 87
- (139)
- (140) Lubin, L. M. & Sandage, A. 2001, AJ, 122, 1084
- (141)
- (142) Maraston, C. 2005, MNRAS, 362, 799
- (143)
- (144) Mei, S., Holden, B. P., Blakeslee, J. P., Rosati, P., Postman, M., Jee, M. J., Rettura, A., et al. 2006, ApJ, 644, 759
- (145)
- (146) Moran, S. M., Ellis, R. S., Treu, T., Smail, I., Dressler, A., Coil, A. L., & Smith, G. P. 2005, ApJ, 634, 977
- (147)
- (148) Nagamine, K., Cen, R., Hernquist, L., Ostriker, J. P., & Springel, V. 2005, ApJ, 627, 608
- (149)
- (150) Nagashima, M., Lacey, C. G., Okamoto, T., Baugh, C. M., Frenk, C. S., & Cole, S. 2005, MNRAS, 363, L31
- (151)
- (152) Pahre, M. A., Djorgovski, S. G., & de Carvalho, R. R. 1996, ApJ, 456, L79+
- (153)
- (154) Papovich, C., Moustakas, L. A., Dickinson, M., Le Floc’h, E., Rieke, G. H., Daddi, E., Alexander, D. M., Bauer, F., et al. 2006, ApJ, 640, 92
- (155)
- (156) Quadri, R., van Dokkum, P., Gawiser, E., Franx, M., Marchesini, D., Lira, P., Rudnick, G., Herrera, D., et al. 2006, ApJ, in press (astro-ph/0606330)
- (157)
- (158) Reddy, N. A., Erb, D. K., Steidel, C. C., Shapley, A. E., Adelberger, K. L., & Pettini, M. 2005, ApJ, 633, 748
- (159)
- (160) Robertson, B., Cox, T. J., Hernquist, L., Franx, M., Hopkins, P. F., Martini, P., & Springel, V. 2006, ApJ, 641, 21
- (161)
- (162) Rubin, K. H. R., van Dokkum, P. G., Coppi, P., Johnson, O., Förster Schreiber, N. M., Franx, M., & van der Werf, P. 2004, ApJ, 613, L5
- (163)
- (164) Rusin, D., Kochanek, C. S., Falco, E. E., Keeton, C. R., McLeod, B. A., Impey, C. D., Lehár, J., et al. 2003, ApJ, 587, 143
- (165)
- (166) Rusin, D., & Kochanek, C. S. 2005, ApJ, 623, 666
- (167)
- (168) Salpeter, E. E. 1955, ApJ, 121, 161
- (169)
- (170) Schlegel, D. J., Finkbeiner, D. P., & Davis, M. 1998, ApJ, 500, 525
- (171)
- (172) Schneider, R., Ferrara, A., Natarajan, P., & Omukai, K. 2002, ApJ, 571, 30
- (173)
- (174) Sirianni, M. J. J., Benítez, N., Blakeslee, J. P., Martel, A. R., Meurer, G., Clampin, M., de Marchi, G., Ford, H. C., et al. 2005, PASP, 117, 1049
- (175)
- (176) Smail, I., Dressler, A., Couch, W. J., Ellis, R. S., Oemler, A. J., Butcher, H., & Sharples, R. M. 1997, ApJS, 110, 213 [MORPHS]
- (177)
- (178) Steidel, C. C., Adelberger, K. L., Shapley, A. E., Erb, D. K., Reddy, N. A., & Pettini, M. 2005, ApJ, 626, 44
- (179)
- (180) Thomas, D., Maraston, C., Bender, R., & Mendes de Oliveira, C. 2005, ApJ, 621, 673
- (181)
- (182) Tinsley, B. M. 1980, Fundamentals of Cosmic Physics, 5, 287
- (183)
- (184) Tonry, J. & Davis, M. 1979, AJ, 84, 1511
- (185)
- (186) Tran, K.-V. H., van Dokkum, P., Franx, M., Illingworth, G. D., Kelson, D. D., & Schreiber, N. M. F. 2005a, ApJ, 627, L25
- (187)
- (188) Tran, K.-V. H., van Dokkum, P., Illingworth, G. D., Kelson, D., Gonzalez, A., & Franx, M. 2005b, ApJ, 619, 134
- (189)
- (190) Treu, T., Ellis, R. S., Liao, T. X., & van Dokkum, P. G. 2005a, ApJ, 622, L5
- (191)
- (192) Treu, T., Ellis, R. S., Liao, T. X., van Dokkum, P. G., Tozzi, P., Coil, A., Newman, J., Cooper, M. C., et al. 2005b, ApJ, 633, 174
- (193)
- (194) Treu, T., Stiavelli, M., Casertano, S., Moller, P., & Bertin, G. 1999, MNRAS, 308, 1037
- (195)
- (196) —. 2002, ApJ, 564, L13
- (197)
- (198) van der Marel, R. P., & van Dokkum, P. G. 2006a, ApJ, submitted [vdMvD06a] (astro-ph/0611571)
- (199)
- (200) van der Marel, R. P., & van Dokkum, P. G. 2006b, ApJ, submitted [vdMvD06b] (astro-ph/0611577)
- (201)
- (202) van der Wel, A., Franx, M., van Dokkum, P. G., & Rix, H.-W. 2004, ApJ, 601, L5
- (203)
- (204) van der Wel, A., Franx, M., van Dokkum, P. G., Rix, H.-W., Illingworth, G. D., & Rosati, P. 2005, ApJ, 631, 145
- (205)
- (206) van de Ven, G., van Dokkum, P. G., & Franx, M. 2003, MNRAS, 344, 924
- (207)
- (208) van Dokkum, P. G. 2001, PASP, 113, 1420
- (209)
- (210) —. 2005, AJ, 130, 2647
- (211)
- (212) van Dokkum, P. G. & Ellis, R. S. 2003, ApJ, 592, L53
- (213)
- (214) van Dokkum, P. G., Förster Schreiber, N. M., Franx, M., Daddi, E., Illingworth, G. D., Labbé, I., Moorwood, A., Rix, H., et al. 2003, ApJ, 587, L83
- (215)
- (216) van Dokkum, P. G. & Franx, M. 1996, MNRAS, 281, 985
- (217)
- (218) —. 2001, ApJ, 553, 90
- (219)
- (220) van Dokkum, P. G., Franx, M., Kelson, D. D., & Illingworth, G. D. 1998a, ApJ, 504, L17
- (221)
- (222) —. 2001, ApJ, 553, L39
- (223)
- (224) van Dokkum, P. G., Franx, M., Kelson, D. D., Illingworth, G. D., Fisher, D., & Fabricant, D. 1998b, ApJ, 500, 714
- (225)
- (226) van Dokkum, P. G., Quadri, R., Marchesini, D., Rudnick, G., Franx, M., Gawiser, E., Herrera, D., Wuyts, S., et al. 2006, ApJ, 638, L59
- (227)
- (228) van Dokkum, P. G. & Stanford, S. A. 2003, ApJ, 585, 78
- (229)
- (230) Webb, T. M. A., van Dokkum, P., Egami, E., Fazio, G., Franx, M., Gawiser, E., Herrera, D., Huang, J., et al. 2006, ApJ, 636, L17
- (231)
- (232) Worthey, G. 1994, ApJS, 95, 107
- (233)
- (234) Worthey, G., Faber, S. M., & Gonzalez, J. J. 1992, ApJ, 398, 69
- (235)
- (236) Wuyts, S., van Dokkum, P. G., Kelson, D. D., Franx, M., & Illingworth, G. D. 2004, ApJ, 605, 677
- (237)
- (238) Yan, H., Dickinson, M., Eisenhardt, P. R. M., Ferguson, H. C., Grogin, N. A., Paolillo, M., Chary, R.-R., Casertano, S., et al. 2004, ApJ, 616, 63
- (239)
- (240) Ziegler, B. L., Bower, R. G., Smail, I., Davies, R. L., & Lee, D. 2001, MNRAS, 325, 1571
- (241)
Appendix A Literature Data for Cluster Galaxies
In addition to the three clusters discussed in this paper we used eleven additional distant clusters in the analysis. We also included the Coma cluster and a sample of SDSS galaxies in the nearby universe. Here we describe the various transformations that were applied to bring the published data to our system. We also describe sources of systematic uncertainty for each cluster. In most cases morphological information is available; only early-type galaxies with masses were included in the calculation of the offsets.
A.1. Coma (Abell 1656)
The value of in Eq. 8 is set to that of the nearby Coma cluster. This choice is arbitrary, as adding a constant to all values of does not change our results in any way. We use the sample of Jørgensen et al. (1996). Structural parameters measured in the band are given in Jørgensen et al. (1995a), and velocity dispersions corrected to a radius aperture are listed in Jørgensen et al. (1995b). The listed surface brightnesses are corrected from the average brightness within the effective radius to that at the effective radius: . Effective radii are converted from arcseconds to kpc by adopting a Hubble flow velocity km s-1 (see vdMvD06b).
Restricting the sample to early-type galaxies with we find . The value of is zero by definition, with a random uncertainty of . The systematic uncertainty in is a combination of several factors. Zeropoint uncertainties in the band photometry give (Jørgensen, Franx, & Kjærgaard 1992), and the uncertainty in implies . A comparison of studies by different authors gives (see Hudson et al. 2001, and vdMvD06b); this uncertainty includes (and may be dominated by) systematic differences in the methodology for deriving structural parameters and velocity dispersions. As discussed in vdMvD06b several other systematic uncertainties cancel in the comparison to the distant clusters. For example, the uncertainty in the Hubble constant cancels because we are only concerned with the evolution of the ratio and not with the absolute value. Also, as discussed in van Dokkum & Franx (1996) our methodology for measuring velocity dispersions of galaxies in distant clusters mimics that of Jørgensen et al. in the nearby universe. The combined systematic error is , and assuming that the random and systematic errors can be added in quadrature we obtain .
A.2. The Bernardi Sample
Bernardi et al. (2003a) have studied the fundamental plane relation of galaxies in the SDSS. This sample has several advantages over previous studies: it is large (the total sample comprises 8661 objects), does not suffer from uncertainties due to peculiar velocities (both because they average out over the large volume probed by the data and because of the relatively high typical redshift of ), has very homogeneous spectroscopy and multi-band photometry, probes a large range of environments, and spans a range in redshift so that in principle evolutionary effects can be studied within the sample. An important drawback specific to this sample is that the magnitude-selection causes significant biases which need to be taken into account (Bernardi et al. 2003a); such biases are less important (although not absent) for cluster samples as all galaxies are at the same distance. Furthermore, as noted by, e.g., Cappellari et al. (2006) the coefficients and that Barnardi et al. derive do not appear to be consistent with most other studies of the FP; the cause for this discrepancy is unclear at present.
Velocity dispersions and structural parameters in the rest-frame band were obtained from Table 3b of Bernardi et al. (2003b). Effective radii were converted to our cosmology. Rest-frame band surface brightnesses were converted to the rest-frame band using the transformation
| (A1) |
with on the Vega system and and on the AB system. For consistency this transformation was derived using the same method and band filter curve as Eq. 1, with the only difference that the redshift was set to zero (i.e., the and filters were not redshifted). Fukugita et al. (1996) give ; for the typical colors of galaxies in the sample this transformation is consistent with ours to mag. The colors cannot be obtained by simply taking the difference as the surface brightness was evaluated within a different radius in each band. Therefore we first corrected the surface brightnesses to a common radius using the measured effective radii of the galaxies (see van der Wel et al. 2005). Finally we applied the transformation . We note that the uncertainty in this procedure is ultimately determined by the difference between the observed band and the final rest-frame band. In this case, the observed band is the band and the final rest-frame band is the band, and at these are very well matched.
Bernardi et al. (2003b) corrected their velocity dispersions to an aperture of radius , which for almost all galaxies is significantly smaller than the aperture at the distance of Coma that we adopted. We first retrieved the dispersions as measured through the SDSS fibers using the measured effective radii (in arcsec) and Eq. 1 of Bernardi et al. (2003b). Then we corrected these measured dispersions to a aperture at the distance of Coma using the redshifts of the galaxies and the prescription of Jørgensen et al. (1995b).
FP offsets were determined for all galaxies in the sample with local density , using , , and . Following Bernardi et al. (2003b) (their Fig. 10) and Bernardi et al. (2003a) (their Fig. 9) galaxies with were excluded. As discussed extensively in Bernardi et al. (2003a) average ratios inferred from these data need to be corrected for selection effects. Fitting to the values listed in their Fig. 7 gives and . Extrapolating to the band using Eq. A1 gives . Bernardi et al. determined the effect for the full sample, and not for the subsample of galaxies with that is relevant here. Selection effects will be less important for the massive galaxies, but it is not clear by how much. We assume that the effect is half that of the full sample, and conservatively assign an uncertainty which encompasses the full range of possibilities:
| (A2) |
Given the uncertainty in the redshift evolution within the Bernardi et al. sample we evaluate the average offset at one redshift only. We chose , as selection effects do not play a large role at that redshift and the local galaxy densities are not well determined for (Bernardi et al. 2003b). In practice we select the 171 galaxies with , , and . The average redshift of this sample is .
The value of the offset is listed in Table 3. The random uncertainty is only . The uncertainty in the photometric transformation is taken to be the difference between the Fukugita et al. (1996) transformation and ours (). The uncertainty due to selection effects is . Bernardi et al. (2003b) estimate that the systematic uncertainty in the velocity dispersions is %, implying in . Adding all uncertainties in quadrature gives for the total error in the offset.
For the analysis in § 6.2 we also determined the offset in low-density regions, selecting all 1519 galaxies with , , and . The average redshift of this sample is 0.1093. The offset (corrected for selection effects) is listed in Table 3. The random error is and the systematic error is the same as derived for the high-density sample. The difference between the high- and low-density offset is in , or 0.08 magnitudes if it is interpreted as a difference in surface brightness at fixed and . This difference appears to be consistent with the trends shown in Fig. 9 of Bernardi et al. (2003a) for this redshift range.
A.3. Abell 2218
Abell 2218 is a well-studied very rich cluster at (Le Borgne, Pello, & Sanahuja 1992). Its FP has been analyzed in two independent studies, Jørgensen et al. (1999) and Ziegler et al. (2001). Jørgensen et al. (1999) give velocity dispersions and two sets of structural parameters, one derived from HST images and one derived from ground-based data. Their velocity dispersions have already been corrected to the aperture at the distance of Coma. The ground-based structural parameters were corrected from the observed band to the rest-frame band using the listed colors:
| (A3) |
and corrected from to . The structural parameters measured from the HST F702W images were transformed by Jørgensen et al. to the band, and we use Eq. A3 to transform the surface brightness to rest-frame .
Ziegler et al. (2001) obtained independent spectroscopy for galaxies in Abell 2218, and give velocity dispersions which were corrected to the same radius aperture at the distance of Coma as we use. They used the same HST imaging as Jørgensen et al. (1999), but derive their own structural parameters from the images. We transformed their listed rest-frame Gunn surface brightnesses from pc-2 to mag arcsec-2 using their Eq. 7, and then converted them back to observed magnitudes using their Eq. 1. In this conversion we used the listed and magnitudes after applying extinction corrections of 0.083 mag in and 0.048 mag in . The surface brightnesses were transformed from to and corrected to rest-frame using Eq. A3.
Combining all information there are three measurements of the FP: 1) dispersions and HST structural parameters from Jørgensen et al. (1999); 2) dispersions and ground-based structural parameters from Jørgensen et al. (1999); and 3) dispersions and HST structural parameters from Ziegler et al. (2001). The two sets of dispersions and the two sets of ground-based data are independent. We determined the offset for all three cases and compared the results. The offsets agree very well: differences are approximately in . Rather than take the average of the three determinations we use the zeropoint from measurement 2): it falls between the other two and it is the one used in the analysis of the Jørgensen et al. (1999) paper. Apart from a systematic uncertainty of 0.02 due to the differences between the three determination there is also an uncertainty introduced by the fact that all structural parameters were measured in redder bands than the redshifted band. This uncertainty stems from color gradients and the dependence of the FP parameters on passband, and is estimated at 0.05 mag. The combined systematic uncertainty is 0.029 in .
A.4. Abell 665
The FP in Abell 665 (; Gómez, Hughes, & Birkinshaw 2000) was studied by Jørgensen et al. (1999). As for Abell 2218 there are two sets of structural parameters, one from HST imaging and the other from ground-based imaging. Contrary to Abell 2218 there are also two sets of color measurements: one directly measured from the ground and the other transformed from HST colors. We applied the same transformations as for Abell 2218, and compared the FP relations derived from ground-based data to the FP derived from HST data. The difference is in , consistent with the expected uncertainties due to the color transformations. The final offset was calculated from the HST measurements in Jørgensen et al. (1999). As for Abell 2218 the total systematic uncertainty is estimated at in .
A.5. Abell 2390
Fritz et al. (2005) present the FP relation in Abell 2390 at . We corrected the listed velocity dispersions to our fiducial aperture following Jørgensen et al. (1995b), using as the extraction aperture. The listed rest-frame Gunn surface brightnesses were converted back to observed WFPC2 magnitudes using (see Fritz et al. 2005). We converted to and transformed to the (COSMIC camera) band using
| (A4) |
(Holtzman et al. 1995). The colors were determined from the listed and aperture magnitudes. These are not corrected for extinction; we applied corrections of 0.476 mag to and mag to (see Fritz et al. 2005). Rest-frame surface brightnesses were determined using
| (A5) |
Based on listed zeropoint uncertainties the uncertainty in the photometric transformations is estimated at mag.
In contrast to our own measurements of the FP in distant clusters no effort was made to determine parameters in the same way as the Jørgensen et al. studies at low redshift. There is therefore a systematic uncertainty of % in the velocity dispersions, which is caused by possible differences in the fitting region, choice of templates, and fitting methodology. This corresponds to an uncertainty of in . Combined with a 0.05 mag uncertainty due to the transformations and the fact that the FP was determined in red rest-frame bands, we estimate that the total systematic uncertainty is 0.037 in .
A.6. CL 1358+62
Kelson et al. (2000a, 2000b, 2000c) provide an extensive analysis of the FP in the cluster CL 1358+62 at in the rest-frame band. Listed velocity dispersions (Kelson et al. 2000b) are already corrected to our fiducial aperture. Listed rest-frame surface brightnesses and colors were back-corrected to the observed ones using the Eqs. in Kelson et al. (2000a). They were then transformed to rest-frame using
| (A6) |
and transformed from to .
The Kelson et al. methodology is essentially identical to ours, and systematic uncertainties in, e.g., spectral continuum filtering cancel. Systematic uncertainties in the dispersions due to possible changes of the spectral templates with redshift are estimated at 2 %. Systematic errors in the photometric transformations are estimated at 0.03 mag. The combined systematic uncertainty is in .
A.7. CL 0024+16
van Dokkum & Franx (1996) present the FP in the cluster CL 0024+16. We use their sample rather than the much larger sample of Moran et al. (2005) because van Dokkum & Franx (1996) use identical techniques to ours, and systematic uncertainties in the velocity dispersions dominate over random uncertainties due to the limited sample size. We note that Moran et al. (2005) find that their data agree with those of van Dokkum & Franx (1996) to within a few percent, both for the velocity dispersions of individual objects in common between the two samples and for the offset in ratio derived from the FP.
Listed velocity dispersions have already been corrected to our fiducial aperture. The listed -band surface brightnesses were corrected to rest-frame using
| (A7) |
The systematic uncertainty stems from the same sources as for CL 1358+62, and is estimated at 0.021 in .
A.8. MS 2053–04 and MS 1054–03
Wuyts et al. (2004) analyze the FP in the two clusters MS 2053–04 () and MS 1054–03 (). The Wuyts et al. study followed initial studies of smaller samples in the two clusters by Kelson et al. (1997) and van Dokkum et al. (1998a) respectively. The listed structural parameters and velocity dispersions are already on our system. However, we update the transformations to rest-frame , as the synthetic filter curve used in Wuyts et al. (2004) is slightly different from the one used in the present study. The updated transformations are
| (A8) |
for MS 2053–04 and
| (A9) |
for MS 1054–03. These transformations are consistent with those given in Wuyts et al. (2004) to within mag for the typical colors of early-type galaxies in these clusters. The systematic uncertainty is taken to be the same as for CL 1358+62.
A.9. RX J0152.7–1357
Imaging and spectroscopic data of RX J0152–13 () and RX J1226+33 () were obtained in the context of the Gemini/HST Galaxy Cluster Project (Jørgensen et al. 2005). Jørgensen et al. (2006) discuss the FP in these clusters, finding that the most massive galaxies in these clusters are offset from the Coma FP by only. This offset is much smaller than had been found previously for the cluster MS 1054–03 at (Wuyts et al. 2004), indicating significant cluster-to-cluster scatter at . Jørgensen et al. (2006) do not provide data for individual galaxies in these clusters, but for RX J0152–13 the FP can be constructed by combining velocity dispersions listed in Table 12 of Jørgensen et al. (2005) with structural parameters measured by Blakeslee et al. (2006). The velocity dispersions ( from Jørgensen et al. [2005]) are already on our system, and no further corrections are required. Effective radii from Blakeslee et al. were circularized by multiplying them by , and converted to kpc. The listed magnitudes ( in Blakeslee et al. [2006]) were converted to surface brightnesses on our system through the transformation
| (A10) |
with in arcsec. Next, surface brightnesses and colors were converted from AB to Vega magnitudes using the Sirianni et al. (2005) ACS zeropoints, and transformed to rest-frame using
| (A11) |
Finally, the offset was derived using the same techniques as for the other clusters. We find , much larger than the Jørgensen et al. (2006) offset. This difference is caused by a combination of two effects: small differences in methodology (e.g., a 0.05 mag difference between the measured Blakeslee et al. [2005] and Jørgensen et al. [2006] surface brightnesses), and an error in the transformation from observed to rest-frame magnitudes. The rest-frame magnitudes in Jørgensen et al. (2006) are too faint by a factor of .333See the erratum published by Jørgensen et al. (2006) in response to our discovery of this discrepancy. I. Jørgensen kindly determined the offset for galaxies with in RX J0152–13 using the Jørgensen et al. (2006) data with our transformation from SDSS and magnitudes to rest-frame , and our zeropoint for the Coma cluster. The offset is . This value is consistent with ours to , when the systematic difference of 0.05 mag between the Blakeslee et al. and Jørgensen et al. methodology is taken into account. Sources of systematic error are the same as for, e.g., Abell 2218 and Abell 665, but we added 0.02 in quadrature to reflect the difference between the Blakeslee et al. and Jørgensen et al. structural parameters.
A.10. RX J1226.9+3332
This cluster is discussed in Jørgensen et al. (2006) together with RX J0152–13. No individual measurements of galaxies are available, but I. Jørgensen determined the offset in ratio using our transformations, Coma zeropoint, and mass selection. A small correction of 0.05 mag was applied to bring the data to the same system as the Blakeslee et al. (2006) photometry (see § A.9). The offset is consistent with the value that is implied by the Jørgensen et al. (2006) study, after correcting their data points by a factor (§ A.9). Sources of systematic uncertainty are the correction to the Blakeslee et al. (2006) system (0.02 in ), systematic uncertainty in the dispersions (0.025), the transformation to rest-frame (0.012), and the photometric zeropoints of the ground-based photometry (0.02). The total systematic uncertainty is 0.040. The random uncertainty is 0.039 in , which brings the total error to 0.056.
A.11. RDCS 1252.9–2927
The FP in the cluster RDCS 1252 was determined by Holden et al. (2005) using four galaxies, all of which have . Listed velocity dispersions are already on our system. The observed surface brightnesses were converted from to and converted to rest-frame using
| (A12) |
where , , and are on the AB system (see Holden et al. 2005). This transformation is slightly different from the one used in Holden et al. (2005), due to the use of a different derivation procedure.444Note that most of the apparent difference between Eq. A12 and the transformation given in Holden et al. (2005) results from the fact that in their equation the surface brightness is on the AB system and the color is on the Vega system. For the typical colors of galaxies in RDCS 1252 the difference in the transformation results in a difference of mag in . The determination of velocity dispersions from the near-UV spectral region may cause systematic errors of 5 % (van Dokkum & Stanford 2003). The total systematic uncertainty is 0.043 in . We note that for this cluster and for RDCS 0848 the random uncertainty exceeds the systematic uncertainty.
A.12. RDCS 0848+4453
The FP for three galaxies in the cluster RDCS 0848 was presented in van Dokkum & Stanford (2003). The listed velocity dispersions are on our system. The F160W surface brightnesses were corrected to rest-frame using
| (A13) |
This transformation is slightly different from Eq. 3 in van Dokkum & Stanford (2003), as we use a slightly different synthetic filter in the present study. For the typical colors of galaxies in RDCS 0848 the two transformations are consistent to mag. The systematic uncertainty is a combination of the uncertainty derived above for CL 1358+62 and a 5 % uncertainty in the dispersions, which originates from the use of the near-UV spectral region. The adopted uncertainty in is 0.038.
Appendix B Literature Data for Field Galaxies
B.1. van Dokkum et al. (2001) and van Dokkum & Ellis (2003)
These studies give structural parameters and velocity dispersions for morphologically-selected early-type galaxies. van Dokkum et al. (2001) give results for 18 galaxies at in the foreground of the rich clusters MS 2053–04 () and MS 1054–03 (). van Dokkum & Ellis studied ten galaxies at in the Hubble Deep Field North (HDF-N). The methodology for deriving velocity dispersions and structural parameters in these studies is identical to ours. Listed surface brightnesses were transformed to rest-frame following the procedures outlined in the cited papers. Note that this transformation is different for each galaxy, as it depends on the redshift. Effective radii were converted to kpc. We determined masses and offsets in ratio in the same way as for individual cluster galaxies (see § 5.1). Eleven of 18 galaxies in the MS 1054–03 field, and four of ten galaxies in the HDF-N, have masses .
B.2. van der Wel et al. (2005)
van der Wel et al. (2005) study a sample of 38 field early-type galaxies in two fields, the Chandra Deep Field South (CDF-S) and the field containing the cluster RDCS 1252 (). The galaxies were selected by a combination of color- and morphological criteria. They span the redshift range , with median 0.97. van der Wel et al. follow the same procedures as we do here for determining structural parameters and velocity dispersions. The listed surface brightnesses (Table 2 in van der Wel et al. 2005) were transformed to the rest-frame band, and effective radii were converted to kpc. Twenty-five galaxies in this sample have .
B.3. Treu et al. (2005a,b)
Treu et al. study a very large sample of 226 visually classified bulge-dominated galaxies in the GOODS HDF-N region. Although Treu et al. use different software and procedures than we do here, a direct comparison between their data and those of van Dokkum & Ellis (2003) (which are on our system) shows that any systematic differences are very small. Specifically, for a subset of the galaxies velocity dispersions were determined using the same software as used in the present study (see § 2.5), and the two sets of measurements agree to % on average (see Treu et al. 2005b). Surface brightnesses were converted to rest-frame following the procedure outlined in Treu et al. (2005b). Next, they were converted from to , and from the AB system to the Vega system. Effective radii were converted to kpc. Treu et al. correct the measured velocity dispersions for aperture effects by applying a fixed correction of . For consistency we correct the measured values to the equivalent of a diameter aperture at the distance of the Coma cluster (see § 2.5).
Masses and offsets in ratio were calculated following the procedures of § 5.1. Of 141 galaxies classified as early-type 25 were excluded because they could be misclassified spirals, as judged from the residuals from an fit (see § 2.1 in Treu et al. 2005b). Of the remaining 116 galaxies, 48 have . These galaxies are at , with median 0.84.
B.4. Comparison of Individual Samples
The total number of field early-type galaxies with is 88. One galaxy was excluded from this sample: object 1 from van Dokkum et al. (2001). This galaxy is at , and as the next lowest redshift is including this object would “artificially” create a very wide bin at low redshift in Fig. 12.555We note that this object follows the trend defined by the other 87 galaxies. In § 6.2 we treat the remaining 87 galaxies as a single sample; here we test whether this approach is warranted, by examining whether there is evidence for systematic differences between the four samples. Data points for individual galaxies are shown in Fig. 5. We determined a mean offset for each sample in the following way. We fitted a linear function to the binned field data listed in Table 3. This function has the form . After subtracting this linear function from the individual data points, the average of the residuals was determined for each of the four literature samples using the biweight estimator. We find the following average offsets in : (van Dokkum et al. 2001); (van Dokkum & Ellis 2003); (van der Wel et al. 2005); and (Treu et al. 2005b). These values are consistent with each other, and we conclude that it is appropriate to treat the four samples as a single, large sample.
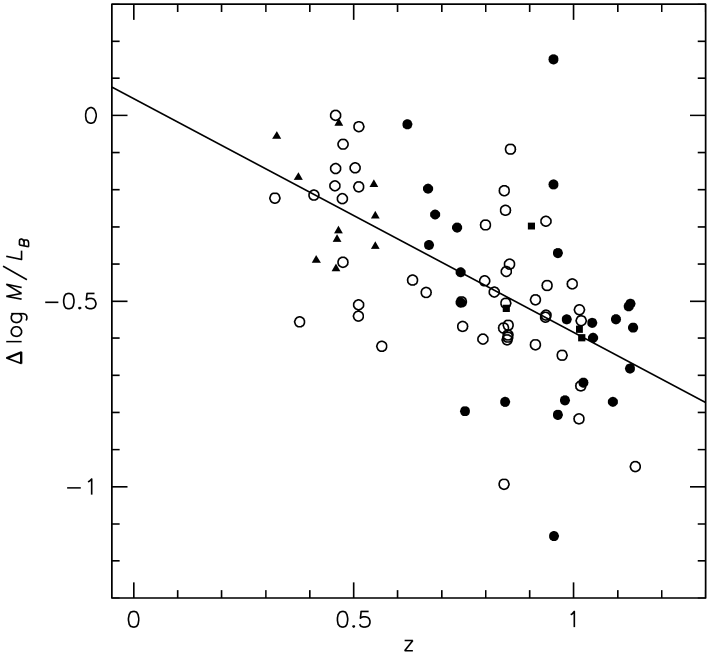
TABLE 2
Galaxy Sample
| IDa | Typea | (km/s)b | d | Remarks | ||||
|---|---|---|---|---|---|---|---|---|
| 3C 295–47 | E/S0 | — | — | — | — | — | Field galaxye | |
| 3C 295–568 | S0/Sb | 152 | 10 | 23.68 | — | Spiral galaxye | ||
| 3C 295–834 | E | 165 | 14 | 21.35 | — | |||
| 3C 295–868 | S0 | 197 | 18 | 22.93 | — | |||
| 3C 295–968 | E | 213 | 12 | 23.64 | — | |||
| 3C 295–2014 | E/S0 | 284 | 22 | 25.33 | — | AGN (3C 295) | ||
| CL 0016–438 | E | 229 | 14 | 22.96 | 2.460 | |||
| CL 0016–461 | E | 268 | 24 | 22.37 | 2.461 | |||
| CL 0016–531 | E | 209 | 21 | 21.98 | 2.443 | |||
| CL 0016–611 | E | 169 | 18 | 22.71 | 2.466 | |||
| CL 0016–612 | E | 279 | 39 | 22.75 | 2.574 | |||
| CL 0016–650 | E/S0 | 172 | 20 | 26.35 | 2.482 | |||
| CL 0016–659 | E | 264 | 27 | 23.13 | 2.441 | |||
| CL 0016–724 | E | 0.5463 | 252 | 17 | 0.462 | 25.46 | 2.582 | |
| CL 0016–725 | E | 0.5389 | 226 | 18 | 0.739 | 26.18 | 2.531 | |
| CL 0016–745 | E | 0.5478 | 124 | 14 | 24.06 | 2.519 | ||
| CL 0016–2050 | E | 0.5536 | 125 | 18 | 23.11 | 2.366 | ||
| CL 1601–270 | S0/E | 0.5098 | 186 | 12 | 22.84 | — | Field early-typee | |
| CL 1601–292 | E | 0.5425 | 179 | 12 | 22.99 | — | ||
| CL 1601–474 | E/S0 | 0.5376 | 313 | 51 | 0.033 | 24.30 | — | Mergere |
| CL 1601–524 | E | 0.5403 | 226 | 16 | 23.50 | — | ||
| CL 1601–619 | E | 0.5392 | 232 | 12 | 24.00 | — | ||
| CL 1601–753 | E | 0.5395 | 281 | 12 | 0.131 | 24.20 | — | |
| CL 1601–814 | E | 0.5409 | 226 | 19 | 22.88 | — | ||
| CL 1601–2040 | E | 0.5439 | 256 | 10 | 23.83 | — | ||
| CL 1601–2043 | E | 0.5407 | 163 | 14 | 23.13 | — | ||
| CL 1601–2060 | E | 0.5430 | 235 | 36 | 23.43 | — |
a From Smail et al. (1997)
b Velocity dispersion corrected to a diameter aperture at the
distance of the Coma cluster.
c Circularized effective radius.
d Surface brightness at the effective radius, in rest-frame ,
corrected for Galactic extinction but not corrected for cosmological
surface britghness dimming.
e Not included in the analysis of the evolution.