Anatomy of HH 111 from CO observations : a bow shock driven molecular outflow
Abstract
We present single-dish and interferometric millimeter line observations of the HH 111 outflow and its driving source. The physical conditions of the protostellar core have been determined from the emission of the millimeter line emission of CO and its isotopomers and CS with the IRAM 30m telescope, and the CO line with the Caltech Submm Observatory. The molecular gas emission reveals a small condensation of cold () and dense gas (). The low-velocity outflowing gas has been mapped with the IRAM Plateau de Bure interferometer. The cold gas is distributed in a hollow cylinder surrounding the optical jet. The formation of this cavity and its kinematics are well accounted for in the frame of outflow gas entrainment by jet bow shocks. Evidence of gas acceleration is found along the cavity walls, correlated with the presence of optical bow shocks. The cavity has been expanding with a mean velocity of on a timescale of , similar to the dynamical age of the optical jet. The separation of the inner walls reaches , which matches the transverse size of the wings in the bow shock. CSO observations of the line show evidence of a high-velocity and hot gas component () with a low filling factor. This emission probably arises from shocked molecular gas in the jet. Observations of the [CI] line are consistent with C-type non-dissociative shocks. Mapping of the high-velocity molecular bullets B1-B3, located beyond the optical jet, with the IRAM PdBI reveals small structures of flattened perpendicular to the flow direction. They are made of cold (), moderate density gas (). We find evidence that the bullets are expanding into the low-density surrounding medium. Their properties are consistent with their being shocked gas knots resulting from past time-variable ejections in the jet.
1 Introduction
Herbig-Haro jets are manifestations of the accretion processes that are involved in the birth of stars, and as such represent a fossil record of the recent activity of their driving sources. The study of jets thus enables us to understand the past history of young stars as they build up their mass. As these jets penetrate their ambient medium, they transfer momentum and accelerate their surroundings and it appears that it is this interaction which causes the ubiquitous molecular outflows. For a recent review on these issues, see Reipurth & Bally (2001).
One of the finest HH jets known is the HH 111 jet, located in the L1617 cloud in Orion (Reipurth 1989). It has a very highly collimated body, with a large number of individual knots, and has large proper motions (300 to ). The jet flows at an angle of only 10o to the plane of the sky (Reipurth, Raga, & Heathcote 1992). Beyond the collimated jet the flow continues, and it is in fact only a minor part of a truly gigantic bipolar HH complex stretching over 7.7 pc (Reipurth, Bally, & Devine 1997a). Optical spectra are discussed by Morse et al. (1993a,b) and Noriega-Crespo et al. (1993). Near-infrared observations have revealed a remarkable symmetry between the optical jet and a near-infrared counterjet, and that a second bipolar flow, HH 121, emerges from the source, suggesting that it is a binary (Gredel & Reipurth 1993, 1994; Davis, Mundt, & Eislöffel 1994, Coppin et al. 1998, Reipurth et al. 2000). The optical jet is co-axial with a major well collimated molecular outflow (Reipurth & Olberg 1991, Cernicharo & Reipurth 1996, Nagar et al. 1997, Lee et al. 2000). Beyond the visible jet, Cernicharo & Reipurth (1996) (henceforth CR) found a set of three high velocity CO bullets, which apparently represent working surfaces that no longer produce optical shock emission. The jet is driven by IRAS 05491+0247, a Class I source with a luminosity of about 25 L⊙, surrounded by cold dust and gas (Reipurth et al. 1993, Stapelfeldt & Scoville 1993, Yang et al. 1997, Dent, Matthews, Ward-Thompson 1998). A small 3.6 cm radio continuum jet was detected around the source by Rodríguez & Reipurth (1994). Recently, infrared images obtained with HST have revealed that another source is located only 3 arcsec from the main one, which itself is a binary judging from the quadrupolar outflows; so altogether it appears that the driving source is part of a hierarchical triple system (Reipurth et al. 1999). In fact, the entire giant jet flow may be a result of the dynamical interactions between the three members of this triple system (Reipurth 2000).
The short blue lobe found by Reipurth & Olberg (1991) appears to be a highly collimated molecular jet about long with a collimation factor of 9 (see their Figs. 2-3-4) in the data of CR. The blue lobe ends at the bow shock P and the optical knots Q,R,S. Nagar et al. (1997) showed an interferometric map at resolution of the line, which allowed them to resolve the structure of the low-velocity gas around the optical jet. The main features of the ionized and molecular gas in HH 111 are summarized in Fig. 1.
In this paper we present single dish and high resolution interferometric observations of the body of HH 111, the protostellar core and the high velocity CO bullets. We characterize the gas kinematics and the physical conditions in the gas and report the detection of a hot temperature component in the outflow. We discuss these results in relation to current theories on the coupling of HH jets and molecular outflows.
We find that the molecular gas entrainment in the outflow is well accounted for in the frame of jet bow shock driven outflows, as modelled by Raga & Cabrit (1993) (henceforth RC93). Preliminary results were reported by Reipurth & Cernicharo (1995) and Cernicharo, Neri & Reipurth (1997).
2 Observations
2.1 Single-Dish Data
The central source and the HH 111 outflow were observed in the millimeter lines of CS and the CO isotopomers with the IRAM-30m telescope in 1990 and 1994. The CO observations have already been presented in CR. For these observations, we used as spectrometer an autocorrelator with 2048 channels and spectral resolution of 37 kHz. The spectral resolution was degraded to . The results are expressed in units of main-beam brightness temperature. The main-beam efficiency was measured to be 0.63 and 0.57 at the frequency of the CS and transitions, respectively.
The CO line at 806.651708 GHz was observed towards the central source and bullet B3 with the Caltech Submm Observatory (CSO) in December 2005. The receiver was tuned in double-side band and the system temperature ranged between 5700 and 7500 K. This allowed us to observe simultaneously the [CI] lines at 809341.97 GHz in the image band. An AOS was used as spectrometer, which provided a kinematical resolution of . At this frequency, the beam size of the telescope is about and the beam efficiency is 0.28. The calibration was checked towards Ori IRc2 in Orion A.
2.2 Interferometric data
The CO emission along the HH 111 outflow was observed with the IRAM Plateau de Bure interferometer (PdBI). A mosaic of 5 fields was performed; the field centers were located at the offset positions (+10″,0), (-10″,+3″), (-30″,+6″),(-50″,+9″) and (-70″,+12″) with respect to the source respectively : (J2000). 0528+134 and 3C120 were used as phase calibrators. An autocorrelator was used as spectrometer, with an element of resolution of 20 kHz, corresponding to a kinematic resolution of at the CO frequency. The IRAM 30m data of the region obtained by CR were used to provide the short spacings and combined with the PdBI visibilities. The combined map is shown in Fig. 5. The synthetic beam is at 2.6 mm and makes a P.A. of deg with respect to North.
The CO emission of the high-velocity bullets B1, B2 and B3 discovered outside the molecular cloud was observed with the IRAM PdBI in 1996. Three fields were observed centered respectively at (B1), (B2), (B3). The same phase calibrators as before were used. The resolution of the autocorrelator was set to 160 kHz, which provided a kinematic resolution of at the CO frequency. The synthetic beam is at 1.3 mm and makes a P.A. of deg with respect to North.
To estimate the fraction of flux missed by the interferometer, we have compared the flux measured at the IRAM 30m telescope with the flux recovered by the interferometer towards bullet B2 in the velocity interval of maximum intensity intensity. At the IRAM 30m, the line intensity peak is , which corresponds to a total flux of , after correcting for the source convolution with the beam and taking into account the antenna efficiency of 10Jy/K at 1.3mm. At the same velocity (), the flux integrated over the reconstructed source was estimated with the “FLUX” procedure and found to be . We conclude that almost all the flux has been recovered by the interferometer.
3 The source

Figure 2 shows the emission of the millimeter lines of CS and the CO isotopomers detected towards the VLA source and two nearby positions offset by in right ascension. In the direction of the VLA source, double-peaked profiles are detected in all lines of various opacities, but the C18O and 13CO (see, e.g., CS and 13CO ). In particular, the maximum of the singly peaked 13CO coincides with the peak of the transition. This allows us to exclude self-absorption as origin of the double peaked profiles detected.
The 13CO interferometric map of HH 111 by Stapelfeldt & Scoville (1993) indicates a North-South velocity gradient in the direction of the core where the powering source of HH 111 has been formed. The CS map of Yang et al. (1997) taken with the Nobeyama interferometer also suggests such a velocity gradient. It has been interpreted by Yang et al. (1997) as due to infalling gas around the exciting source of HH 111. However, the fact that the emission from the CS lines show wings associated with the molecular outflow renders difficult the interpretation of the data. Indeed, the gas kinematics is affected by several different physical processes, as evidenced by the presence of a well defined cavity (see below Sect. 4.3; also CR and Nagar et al. 1997).
We do not detect any spatial shift in the velocity centroid of the molecular emission in the direction perpendicular to the outflow. Hence, the double peaked line profiles are not tracing the collapsing gas of the protostellar envelope, but most likely the interaction of the jet with the ambient gas, constituting the rear part of an expanding cavity around the optical jet. This point is adressed more thoroughly in Sect. 4.
The C18O transition traces the emission of the parental core at . The C18O and 13CO were observed simultaneously by the same receiver (they lie in the same IF band), which offers the advantage of eliminating the uncertainties in the pointing and the relative calibration. Towards the source, we measure main-beam brightness temperatures and for the C18O and the 13CO transitions, respectively. Both transitions are thermalized at the density of the core. Assuming a standard relative abundance ratio , we derive an opacity for the C18O line. Analysis of the C18O transition in the Large-Velocity Gradient approximation yields a gas column density and a temperature of . Hence, the total gas column density of the core is .
The CO to intensity line ratio measured at ambient velocities, between +3.8 and (see Sect. 4.1), is , as expected for gas at and densities of . We therefore adopt a value of in what follows.
The dense gas tracers (CS) peak at in the central core region. The lines are rather bright () and narrow ( less than ). Small wings are detected between 6.5 and (Fig. 2). The emission draws a round condensation of diameter (beam-deconvolved) or . Analysis of the CS and transitions in the Large-Velocity Gradient approximation yields typical densities of and column densities at the brightness peak. The lines are optically thin with and .
Emission in the [CI] line was detected at the velocity of the ambient gas (Fig. 3; note that the [CI] line is in the image band). A gaussian fit to this emission yields an integrated flux of , peak intensity of and a line width of . Such a broad line width implies that the [CI] emission arises from the outflow and not only from the ambient gas. This suggests a gas column density of for a temperature of . The ratio of atomic carbon to carbon monoxide column densities is therefore , a typical value measured in the Orion molecular cloud.
4 The outflow
4.1 Hot gas near the source

No evidence of high-velocity wings was found towards the central source in the low and CO line profiles obtained with the IRAM telescope (CR; see also Fig. 3). CR pointed out that in case the outflowing gas would have a high excitation temperature, much above the 15-20 K estimated from the lowest two transitions, the opacity of the latter would be very low, making them extremely difficult to detect.
Hatchell et al. (1999) showed evidence for warm gas in the range in the HH 111 high-velocity bullets from observations in the CO and transitions. We have observed the central source in the high CO transition at the CSO; the upper energy level lies at above the ground state, and is a much more sensitive probe of warm gas.
The final spectrum is displayed in Fig. 3. The kinematical resolution was degraded to to improve the signal-to-noise ratio. The rms is per velocity channel. We have superposed the spectrum obtained with the IRAM 30m telescope, scaled to match the brightness peak of the line. The HPBW of both telescopes are similar at the concerned frequencies. We detect high-velocity wings both at blue and redshifted velocities, with a signal:noise of and above , respectively. Emission is detected at velocities larger than with respect to the source. These wings are barely seen in the line. The line emission can therefore be divided in 3 velocity intervals : the blueshifted wing (40 to ), the “ambient” gas (3.8 to ), and the redshifted wing (+13 to ).
As illustrated in Fig. 3, the relative intensity of the CO with respect to the is much larger in the wings than in the ambient gas, which indicates highly different physical conditions, in particular a much higher temperature. We have estimated the physical conditions in the high-velocity wings from modelling both lines in the Large-Velocity Gradient approach. We have adopted the CO collisional coefficients determined by Flower (2001) for CO - ortho-H2 collisions in the range -. For temperatures beyond , the collisional coefficients are extrapolated adopting a temperature dependence of . The signal:noise ratio in the wings is not high enough to study the excitation conditions as a function of velocity. Therefore, we consider the emission integrated over the velocity interval assigned to each wing. We obtain a similar line ratio . This value is probably a lower limit as the filling factor of the is probably less than that of the . The LVG calculations show that, in order to account for a line ratio of , the kinetic temperature has to be above at least, and the density larger than a few (see Fig. 3). In this range of density and column density, the transition is thermalized but the is not; the is optically thin while the is optically thick.
The velocity of this hot gas is very large, up to when deprojected. If the emission arises from entrained gas then the density of the hot gas is probably much less than in the cold low-velocity gas, where we estimate (see Sect. 4.2). The density of the hot CO gas is at most a few times , which implies a temperature of about up to or more. Spectroscopic diagnostics in the optical range indicate typical densities of in the jet (Hartigan et al. 1994).
The CO column density of entrained gas in each wing lies in the range . The mass of warm H2 is about per beam, and the associated momentum is , assuming a filling factor of 1. Integrated over the cavity, the mass of warm gas would amount to and the velocity-deprojected momentum would be . The overall momentum carried away in the hot CO gas would be a factor of 10 larger than in the low-velocity cold gas and the high-velocity molecular jet (Nagar et al. 1997; CR). We conclude that the filling factor of the hot component is probably much smaller than 1. For a filling factor of 0.1, the same amount of momentum is carried away by the three components (molecular jet, high-velocity wings, low-velocity “cavity”). As a consequence, the hot CO emission is to arise from a narrow region in/around the optical jet, and the size of the emitting region is a few arcsec. However, we can not exclude that the emission arises from the whole cavity. If so, Kelvin-Helmholtz instabilities should grow along the jet. This has not been observed by HST. As discussed by Reipurth et al. (1997b; hereafter Rei97) the optical jet propagates into a very-low density medium (). Therefore, we favor the hypothesis that the hot CO gas emission comes from the jet itself.
The spectra obtained by CR in the CO line further West in the flow, towards optical knots P to S, show similar line wing profiles, typically wide, with maximum intensity at the ambient gas velocity, plus the signature of the molecular jet detected as a wide isolated velocity component centered at (see panels a and b in Fig. 3). Assuming similar excitation conditions in the jet, i.e. a line intensity ratio of 3, we would expect a line intensity of , which is below the detection limit allowed by our data.

When averaging the line profiles over the low-velocity outflow emission region, between the source and offset , a weak high-velocity component is detected at the level, which peaks at the same velocity as in the jet (see panel c in Fig. 4). Its narrow line width () is consistent with a motion parallel to the optical jet (a spectrum with kinematical resolution is displayed in Fig. 1 of CR). Assuming a minimum excitation temperature of , the mass of this component is and the momentum carried away is about , after correcting for velocity projection effects.
High signal:noise data show that the velocity distribution between the molecular jet and the high-velocity wings is continuous (see e.g. the spectrum obtained near knot S in Fig. 4a). This supports the idea that the high-velocity wings consist of material entrained by/with the jet. ISO observations of molecular outflows have detected the emission of rotational lines of CO, and H2 at temperatures between 500 and (Nisini et al. 2000; Lefloch et al. 2003). In the case of L1448-mm and HH 2, this hot gas emission appears to arise from extreme high-velocity clumps of size along the molecular jet.
As a conclusion, the hot CO high-velocity emission detected in HH 111 probably traces gas that has been accelerated by internal shocks along the jet.
4.2 The physical conditions
The single-dish data allow to determine the physical conditions in the outflowing gas. The CO and line intensity both peak at (Fig. 2). The gas at this velocity extends along the optical jet. The emission maxima are at positions 10 to 20 arcsec away from the exciting source of the HH 111 system; it appears as bright as the main core in the lines of CO and 13CO. In the C18O line, a secondary component at is detected from 30 arcsec to 60 arcsec from the exciting source along the outflow. A weak counterpart is detected at about from the source, which coincides with the red outflow wing. The parameters of the secondary component were obtained from a gaussian fit to the C18O lines, which yields a line width of , a brightness temperature of , and an emission peak at . This implies a column density of provided the kinetic temperature is similar to that of the main core, as discussed above. We have estimated the density in the outflow wings from studying the secondary component in the CS lines. After removing the contribution of the main outflow component to the spectra, we have determined from a gaussian fit main-beam peak temperatures of and for the and lines from a gaussian fit. At a temperature of , this implies a gas density , and a CS column density .
4.3 The PdBI observations
We present in Fig. 5 the velocity channel maps of the CO emission between 0 and , obtained at the PdBI. The maps result from a mosaic of 5 overlapping fields covering . Zero spacing data from the IRAM 30-m telescope has been merged with the PdBI data. The HPBW is and is indicated in the lower-right panel. These observations have a better angular resolution ( a factor of 2), sensitivity and uv coverage than the map of Nagar et al. (1997). We have superposed in white the emission of the optical jet, as observed with HST in (Rei97). The data confirms the presence of a hollow tubular structure with an outer diameter of (), as previously proposed by CR and Nagar et al. (1997). Within to the source, the geometry of the cavity is well fitted by a parabolic law. However, further away from the source, the gas distribution is better described by a hollow conical cylinder (Fig. 6)
The front and rear sides of the cavity are detected between +2 to and +8.5 to , respectively, hence at velocities much lower than the CO outflow (, CR). Line widths in the blueshifted gas are rather large, with at half-power. The walls of the cavity are seen particularly prominent at around ; they present a wider separation as the distance from the source and the velocity increase (see Fig. 6). HST observations in the optical [SII] line indicate that the internal bow shock wings of the jet have a typical diameter of (see Figs. 7-11 in Rei97) so that they fill only partly the molecular gas cavity. The walls extend as far as away from the source (), beyond the HH jet. At , we measure an inner separation of between the walls, which corresponds to an opening angle of . This separation is also the distance between the wings of the bow shock observed in the jet at this position. Emission at extreme velocities of and is detected along the jet main axis, which provides a measurement of the expansion of the cavity around the jet. We derive an average radial expansion velocity of . This implies a kinematical age of for the outermost gas layers in the expanding cavity, at away from the optical jet axis. This is similar to the kinematical age of the optical jet (CR).
The velocity distribution on the rear side of the cavity provides strong constraints on its geometry. The emission of the rear wall of the cavity is detected at about , West of the source, where the outflow propagates at blueshifted velocities (see panel at offset position (20,0) in Fig. 2). The emission of the rear wall is characterized by relatively narrow line widths () and low-velocity motions with respect to the cloud gas, much smaller than those detected on the front side. This implies that the rear side lies close to the plane of the sky, in agreement with the angle of the optical jet to the plane of the sky derived by Reipurth, Raga & Heathcote (1992) and the above opening angle of . The velocity distribution undergoes a positive gradient with increasing distance to the source, up to offset along the jet. As the jet is blueshifted, this positive gradient is naturally explained if the tangential velocity is much larger than the component normal to the wall.
We present in Fig. 7 the CO intensity distribution as a function of velocity in cuts made parallel to the jet direction. Emission from the front cavity walls is detected from to from the jet axis. The location of the front and rear cavity walls is marked with thick white lines, in the cut made along the jet axis (offset ). The velocity shift between the front and the rear wall increases strongly with distance to the source, which implies that the tangential velocity also increases. The velocity field of the front and rear walls is well described by a linear law ; the corresponding fits are displayed in Fig. 7.
The maximum velocity () is observed ahead of the optical jet. A small gas knot is detected at the tip of the jet between offsets (bow shock L) and (knot O) in the panel at (see Fig. 5). A counterpart to this knot is detected in the redshifted gas, at . Emission at a lower velocity () is detected upstream of the knot and off the jet axis (Fig. 5). The whole wall appears to be accelerated along the optical jet up to this knot, as can be seen on the cuts at and in Fig. 7). About downstream of knot O the wings of bow shock P are detected (Fig. 8 in Rei97). Those wings are remarkably extended, , comparable to the width of the inner cavity “hole”. The molecular gas has probably been accelerated in the wings of bow shock P.
Near the source, the gas undergoes a strong acceleration, which terminates at the location of optical knot F, at from the source (Figs. 4-5; Rei97). A symmetrical feature displaying a strong gas acceleration is also detected , which extends up to East of the source. Both components are marked by a white dashed line in Fig. 7.
We suggest that both features are tracing a recent ejection from the protostellar source, associated with knots E-F. This gas component extends from up to from the jet main axis (Fig. 7); hence the ejection takes place inside the large-scale cavity reported above. Indeed, based on STIS spectroscopic data of the jet obtained with HST, Raga et al. (2002) showed good evidence that optical knot F traces an internal working surface resulting from time variability in the ejection velocity, on a scale of .
The velocity field appears much more complex (see panel at in Fig. 7). It can be fitted by a linear law between the source and offset . One can note that the linewidth gets broader with decreasing distance to knot F, in panels at , and along the jet. Between and , the CO emission covers a broader range of velocities. Such broadening could trace gas accelerated by knots E-F, or in previous events like bow shock L.
5 The CO bullets
Beyond the optical bow shock V, CR discovered three CO bullets (hereafter referred to as Bullet 1, 2 and 3, in order of increasing distance from the source) with separations of . No optical emission is associated with these bullets. However, they are perfectly aligned along the direction defined by the optical jet. Whereas the optical knots P and V are tracing shocked material, the molecular bullets B1-2-3 have no heating source. Based on the association of optical knots with some high-velocity bullets, CR proposed that the latter bullets were tracing past shock episodes of HH 111.
5.1 The PdBI observations

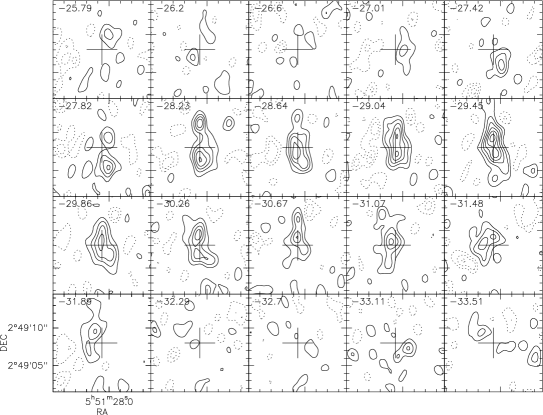
High-angular resolution maps have been obtained with the PdBI interferometer in the CO line (Fig. 8). The emission properties of all three bullets are very similar. The molecular emission from the bullets was marginally resolved by the IRAM 30m-telescope; it allowed to estimate a size of . The much better angular resolution of the PdBI observations allows to resolve the emission. Each bullet is elongated in the North-South direction; the large-scale distribution is well described by an ellipse with typical size (beam-deconvolved) of (). We note that the transverse size of the bullets () matches reasonably well the inner diameter of the cavity around the jet.
Each bullet presents a complex kinematical structure down to arcsec scale (Fig. 9). The line profiles are characterized by a broad plateau, spanning , and a line core of HPFW. To study the gas kinematics in the bullets, we have considered separately the spatial distributions of the blue and red wings (Fig. 10). In all three bullets, the blueshifted component appears to lie (1 beam size) upstream of the redshifted component. It suggests a side-ways expansion of the bullets, which now propagate in a low-density medium, and are oriented at only a small angle out of the plane of the sky.

5.2 The physical conditions
Hatchell, Fuller & Ladd (1999) observed at the JCMT the CO and emission near optical knot P, bow shock V and bullet B3. Under the hypothesis that the levels are populated at LTE and the lines are optically thin, they estimated a kinetic temperature of in the high-velocity ejecta. It is in bullet B3 that these authors derive the highest temperature, around . This is rather unexpected as B3 is the most distant bullet from the source. We note that the transitions observed by the authors are not well suited to trace so high temperature gas. Higher-J transitions of CO are more sensitive probes of the kinetic temperature.
| Bullet | Position | Size | Mass | Density |
|---|---|---|---|---|
| (J2000) | () | () | () | |
| B1 | 05:51:34.9, 02:48:51.1 | 3.1 | 1.5 | |
| B2 | 05:51:31.4, 02:48:57.7 | 2.1 | 0.59 | |
| B3 | 05:51:29.0, 02:49:08.0 | 1.9 | 0.53 |
We have carried out an LVG analysis of the CO line fluxes measured towards B3, based on the data of CR and Hatchell et al. (1999). We have first corrected for the beam dilution, especially critical for the transition, adopting a bullet size of , in agreement with CR and our PdBI observations (see below). We adopted an average line width , from the 30m and PdBI observations. We conclude that it is not possible to reproduce simultaneously all four transitions. The observed flux exceeds by a large factor (about 4) the intensity predicted by the model. It is in fact the high flux measured in this transition which is responsible for the high temperature derived by Hatchell et al. (1999). However, there is no evidence for internal shocks, which would heat the bullet material to such high temperatures. As discussed below, the cooling timescale of this gas is very short, so that its temperature should decrease much below the measured in the optical knots P-V. We conclude that, most likely, the line intensity was highly overestimated. As pointed out by Hatchell et al. (1999), the calibration of the 460 GHz receiver was highly uncertain at the time of the observations.
If we repeat the analysis considering only the first three CO transitions and taking into account the uncertainty in the measured flux (about ), a good agreement is obtained for a CO column density . The best agreement is then obtained for temperatures in the range and H2 densities in the range (see below).
Neufeld, Lepp & Melnick (1993,1995) have studied the radiative cooling of warm molecular gas in various astrophysical environments. Applying their work to the case of the HH 111 bullets, we estimate a typical cooling time of if the temperature of the bullets is as high as . This is approximately the typical flight time between two subsequent molecular bullets (). The distance from bullet V, the last one for which we observe evidence of a shock, to bullet B3 is , that needs about to be crossed, almost three times the CO cooling time.
We conclude that, although the temperature of the bullets inside the molecular cloud is about , the molecular bullets B1-B2-B3 are most likely made of colder gas, at a temperature of typically . Under such physical conditions (, ), the transition is optically thin and has an excitation temperature . This is slightly larger than the value derived by CR () although the other physical parameters (mass, mass transport rate, momentum) are essentially unchanged.
From the above timescale, we estimate a time-averaged mass transport of , whereas Hartigan, Morse & Raymond (1995) derive a mass loss rate of . The similar mass transport rates support the view that the CO bullets are not made of ambient material that has been accelerated to these very high velocities, but are mostly composed of material ejected from the central engine. The momentum carried away by each bullet amounts to .
Raga et al. (1990, 2002) proposed that optical knots form from time variable gas ejections in the jet. Such mechanism leads to the formation of “mini-bows” along the jet. In this framework, the high-velocity CO bullets would trace the previously shocked molecular counterpart of the optical knots. It naturally explains the similar properties observed between the jet and the high-velocity bullets (size, kinematics, momentum). The weak high-velocity component detected between B1 and B2 (see Fig. 6 in CR) traces the molecular “intershock” gas ejected from the central source, between two “eruptions”.
6 Gas entrainment mechanism
6.1 The cavity
The kinematics of the outflowing gas is complex as it bears the signature of several ejection episodes in the optical jet, associated with bow shocks at knots F and L (Rei97; Raga et al. 2002). We also find strong correlation between the low- and high- velocity outflow wings and the jet. It is therefore unlikely that a single fit of any outflow model is able to reproduce the kinematics of the gas observed along the whole flow length. As the ejecta are located inside the cavity, close to the source (within ), we have decided to concentrate on the global properties of the cavity, at larger distance from the source. Our interferometric data have revealed a large cylindrical cavity in which the gas is accelerated following a “Hubble law” , distance along the jet axis.
The formation of such large cavities is easily accounted for by the sweeping up of ambient material as a bow shock propagates into the parental cloud (RC93). In what follows, we show that that such gas entrainment models can indeed account for the molecular outflow emission in HH 111. We first determine the parameters of the “best” model that fits the HH 111 molecular gas distribution.
As shown by RC93, the global shape of the cavity swept-up by an internal bow shock depends on two parameters : the density stratification of the ambient medium and the ratio between the distance of the working surface to the source and the standoff distance between the working surface and the bow shock apex .
For a jet propagating into a medium of density , measuring the distance from the powering source along the jet axis, the following relation holds between the jet cylindrical radius and : . As discussed above and in Sect. 4.3, the shape of the cavity near the source is suggestive of .
The standoff distance between the ejection point in the working surface and the bow shock apex is related to the jet radius via :
| (1) |
where is the solid angle over which mass is ejected (), and are the ejection and jet velocities, respectively (see Eq. 4 in RC93).
In the case of strong working surfaces such as those observed in HH 111, the ratio between the jet and the ambient density is (Raga & Binette 1991) and in the adiabatic case. Hence and , with a typical jet radius of (Rei97).
A simple determination comes from the shape of the cavity computed in the case . The cylindrical radius is typically twice the standoff distance (see for example the top panel of Fig. 3); it is not very sensitive to the actual value of nor the distance of the bow shock to the source. At zeroth order, the diameter of the cavity determined in the outer part is , hence . This simple determination is consistent with the upper limit obtained previously. It is also consistent with numerical simulations, which yield .
Since bow shock V lies at from the source (Rei97), one has . We display in Fig. 6 the shape of the cavity swept-up by a bow shock as predicted for this set of parameters. This model fits nicely the walls of the cavity and the curvature of bow shock V. The agreement is very satisfying at . We have fitted the inner walls of the cavity by straight lines (drawn in dashed dark contours in Fig. 6); the optical jet emission appears to fill exactly the cavity walls up to . Extrapolating the fit up to bow shock V, we find that the separation of the walls at that position is . It matches well the size of the bow shock in the optical line (see top panel in Fig. 6), as expected for freely expanding shocked material.
For values of of , the model predicts that the velocity vs position along the axis is almost exactly linear over the whole flow length, except close to the source. This is again consistent with the Position-Velocity diagram derived from our interferometric maps (see Fig. 7).
The situation is more complex closer to the source : molecular gas emission is still detected beyond the fit, so that the agreement between the fit and the actual shape of the cavity is not very good. Several factors may contribute to this. In particular, several ejections have taken place recently, which are now observed as knots E to L. Since this part of the cavity has experienced the crossing of two more bow shocks (P and L), the walls have been transferred additional momentum. This could contribute to our detection of entrained gas at further distances from the jet axis.
These results differ somewhat from the previous conclusions of Nagar et al. (1997). Based on their interferometric map of the line emission, these authors interpreted the velocity field and the spatial distribution of the molecular gas as evidence for an outflow entrained by a wide-angle radial wind, as modelled by Shu et al. (1991, 1995). The modelling of the Position-Velocity diagram of the emission along the jet is indeed in good agreement with the predictions of radial-wind driven outflows (Li & Shu 1996). As pointed out by Cabrit et al. (1997), a simple fit to the Position-Velocity distribution of the outflowing gas does not allow to discriminate between jet-driven and wide-angle wind models, when the inclination with respect to the plane of the sky is low.
We note that the physical conditions close to the source (less than ) play an important role in constraining the parameters of the wide-angle wind fitted by Nagar et al. (1997). As can be seen on their Fig. 5, it appears that at larger distances the radius of the cavity is constant rather than parabolic-like, as claimed by the authors, and the match between the observed velocity profile and the fit is less satisfying.
In our opinion, the strong ejection activity near the source prevents conclusions about the role of a wide-angle wind in driving molecular gas, as these ejecta are very efficient at transferring momentum to the ambient material. Interferometric observations at a higher angular resolution than the data presented here are required to investigate the relation the optical shocked knots hold to the molecular gas, and how the dynamics of the cavity is affected.
However, the formation of the large-scale cavity observed up to bow shock P is well explained in the frame of the model of RC93. The jet entrains ambient molecular material swept-up in the propagation of bow shocks, which disturb the ambient gas at large distances from the jet axis. Our observations indicate that bow shock V played a major role in shaping the global cavity.
6.2 The hot gas component
Our observations of the CO 7-6 emission bring evidence for hot outflowing gas in the cavity which is missed by observations of the low-J transitions, due to the extremely low opacity of the latter. This is evidenced by the maximum radial velocity detected in the outflow wings in the and transitions ( and , respectively). It is therefore necessary to take into account the thermal structure of the outflow to discriminate between the various gas acceleration mechanisms that have been proposed.
The hot gas component occupies probably a much smaller region than the low-velocity cold gas, with a typical size of the emitting region of a few arcsec. The emission likely arises from shocked gas in the jet, a conclusion supported by the high velocities and temperature measured in this gas. High signal:noise spectra obtained further downstream in the jet show a continuous velocity distribution between the molecular jet and the high-velocity wings, and support a close association between both phenomena. [CI] observations do not show any evidence of CO dissociation close to the source; hence, the gas is probably accelerated in C-type, rather than J-type shocks, along the jet.
Averaging the CO signal over the cavity reveals a faint molecular jet signature at , consistent with the velocity of the molecular features (bullets) detected further downstream (Fig. 4). The presence of such a hot component shows that there is no clear velocity separation between the outflowing gas and the jet itself (see Fig. 4, and lower panel of Fig. 1 in CR). Interferometric observations with the SMA in the CO transition would allow to determine the location of the emission. Observations of the high-J CO lines with the Herschel Space Observatory would allow to clarify the physical conditions in the outflowing gas.
7 Conclusions
We have presented single-dish and interferometric line observations of the HH 111 outflow and its driving source. The physical conditions of the protostellar core were determined from the emission of the millimeter lines of CO and its isotopomers, the millimeter lines of CS, all of them observed with the IRAM 30m telescope, and the CO line observed with the CSO. The molecular gas emission reveals a small condensation of cold () and dense gas ().
The low-velocity outflowing gas has been mapped with the IRAM Plateau de Bure interferometer. It is distributed in a hollow cylinder that surrounds the optical jet. The formation of this cavity and its kinematics are well accounted for in the frame of the model of RC93. The jet entrains ambient molecular material swept-up in the propagation of bow shocks, which disturb the ambient gas at large distances from the jet axis. Our observations indicate that bow shock V played a major role in shaping the global cavity. The gas velocity is found to vary almost linearly with distance to the source over the whole flow length, except close to the source. The cavity has been expanding with a mean velocity of on a timescale of , similar to the dynamical age of the optical jet. The separation of the inner walls reaches near knots P and S, which corresponds to the transverse size of the wings in these bow shocks.
The more recent ejections detected close to the source are still efficient at transferring momentum to the ambient material. Regions of strong gas acceleration are detected along the jet, which are correlated with the optical bow shocks at knots F and L.
Observations of the high-excitation line CO reveal high-velocity outflowing gas ( after deprojection) near the central source. This high-velocity component is hot () and fills only a small fraction of the beam. We propose that this emission arises from shocked gas in the optical jet.
Emission of the molecular bullets B1-2-3 was mapped with the IRAM PdBI in the CO transition. The emission is distributed in structures of flattened perpendicularly to the jet main axis. Their kinematics is complex but an overall side-ways expanding motion is detected inside all of them. Their physical properties have been reassessed; we find a low temperature for the bullets (), in agreement with the cooling timescale for shocked gas initially heated at temperatures of or beyond, and cooling down while flying freely. Their density lies now in the range . These molecular bullets probably form in the shocks resulting from time-variable ejections in the powering source, in the manner proposed by Raga et al. (2002) to account for the presence of mini bow shocks and knots in the optical jet. In such a scenario, the weak high-velocity molecular jet detected between the molecular bullets represents intershocked gas ejected from the central source.
References
- (1) Cernicharo, J., & Reipurth, B. 1996, ApJ, 460, L57 (CR)
- (2) Cernicharo, J., Neri, R., & Reipurth, B. 1997, in IAU Symp. No. 182 Herbig-Haro Flows and the Birth of Low Mass Stars, eds. B. Reipurth & C. Bertout, Kluwer, p.141
- (3) Coppin, K.E.K., Davis, C.J., & Micono, M. 1998, MNRAS, 301, L10
- (4) Davis, C.J., Mundt, R., & Eislöffel, J. 1994, ApJ, 437, L55
- (5) Dent, W.R.F., Matthews, H.E., & Ward-Thompson, D. 1998, MNRAS, 301, 1049
- (6) Flower, D., 2001, J. Phys B., 34, 2731
- (7) Gredel, R., & Reipurth, B. 1993, ApJ, 407, L29
- (8) Gredel, R., & Reipurth, B. 1994, A&A, 289, L19
- (9) Hartigan, P., Morse, J.A., & Raymond, J., 1994, ApJ, 436, 125
- (10) Hatchell, J., Fuller, G.A., & Ladd, E.F. 1999, A&A, 346, 278
- (11) Lee C.-F., Mundy, L.G., Reipurth, B., Ostriker, E.C., & Stone, J.M. 2000, ApJ, 542, 925
- (12) Lefloch, B., Cernicharo, J., Cabrit, S. et al., 2003, ApJ, 590, L41
- (13) Li, Z.Y., Shu, F.H., 1996, ApJ, 468, 261
- (14) Morse, J.A., Heathcote, S., Cecil, G., Hartigan, P., & Raymond, J.C. 1993a, ApJ, 410, 764
- (15) Morse, J.A., Heathcote, S., Hartigan, P., & Cecil, G. 1993b, AJ, 106, 1139
- (16) Nagar, N.M., Vogel, S.N., Stone, J.M., & Ostriker, E.C. 1997, ApJ, 482, L195
- (17) Nisini, B., Benedettini, M., Giannini, T., et al., 2000, A&A, 360, 297
- (18) Noriega-Crespo, A., Garnavich, P.M., Raga, A.C. 1993, AJ, 106, 1133
- (19) Raga, A.C., Binette, L., Cantó, J., Calvet, N., 1990, ApJ, 364, 601
- (20) Raga, A.C., Cabrit, S., 1993, A&A, 278, 267 (RC93)
- (21) Raga, A.C., Noriega-Crespo, A., Reipurth, B. et al., 2002, ApJ, 565, L29
- (22) Reipurth, B. 1989, Nature, 340, 42
- (23) Reipurth, B., Olberg, M. 1991, A&A, 246, 535
- (24) Reipurth, B., Raga, A.C., & Heathcote, S. 1992, ApJ, 392, 145
- (25) Reipurth, B., Chini, R., Krügel, E. et al., 1993, A&A, 273, 221
- (26) Reipurth, B., & Cernicharo, J. 1995, Rev. Mex. Astron. Astrofí. Ser. de Conf., 1, 43
- Reipurth et al. (1997a) Reipurth, B., Bally, J., & Devine, D. 1997a, AJ, 114, 2708
- (28) Reipurth, B., Hartigan, P., Heathcote, S., et al., 1997b, AJ, 114, 757 (Rei97)
- Reipurth et al. (1999) Reipurth, B., Yu, K.C., Rodríguez, L.F. et al., 1999, A&A, 352, L83
- (30) Reipurth, B., Yu, K.C., Heathcote, S. et al., 2000, AJ, 120, 1449
- (31) Reipurth, B. 2000, AJ, 120, 3177
- (32) Reipurth, B., & Bally, J. 2001, ARAA, 39, 403
- (33) Rodríguez, L.F. & Reipurth, B., 1994, A&A, 281, 882
- (34) Shu, F.H., Ruden, S.P., Lada, C.J., Lizano, S., 1991, ApJ, 370, L31
- (35) Shu, F.H., Najita, J., Ostriker, E.C., Shang, H., 1995, ApJ, 455, L155
- (36) Stapelfeldt, K. & Scoville, N.Z. 1993, ApJ, 408, 239
- (37) Yang, J., Ohashi, N., Yan, J. et al., 1997, ApJ, 475, 683