A Multiwavelength Optical Emission Line Survey of Warm Ionized Gas in the Galaxy
Abstract
We report on observations of several optical emission lines toward a variety of newly revealed faint, large-scale H-emitting regions in the Galaxy. The lines include [N II], [N II], [S II], [O III], and He I obtained with the Wisconsin H-Alpha Mapper (WHAM) toward sightlines that probe superbubbles, high latitude filamentary features, and the more diffuse warm ionized medium (WIM). Our observations include maps covering thousands of square degrees toward the well-known Orion-Eridanus bubble, a recently discovered bipolar superbubble centered in Perseus, plus several classical H II regions surrounding OB stars and hot evolved stellar cores. We use the emission line data to explore the temperature and ionization conditions within the emitting gas and their variations between the different emission regions. We find that in the diffuse WIM and in the faint high latitude filamentary structures the line ratios of [N II]/H and [S II]/H are generally high, while [O III]/H and He I/H are generally low compared to the bright classical H II regions. This suggests that the gas producing this faint wide-spread emission is warmer, in a lower ionization state, and ionized by a softer spectrum than gas in classical H II regions surrounding O stars, the presumed ionization source for the WIM. In addition, we find differences in physical conditions between the large bubble structures and the more diffuse WIM, suggesting that the ionization of superbubble walls by radiation from interior O associations does not account entirely for the range of conditions found within the WIM, particularly the highest values of [N II]/H and [S II]/H.
1 INTRODUCTION
The interstellar medium (ISM) plays a vital role in the ongoing cycle of stellar birth and death and galactic evolution. However, the role of interstellar matter, from how its properties are influenced by stars to how in turn its properties influence star formation, is poorly understood and is arguably the least understood portion of the cycle. Warm diffuse ionized hydrogen has become recognized as a major phase of the ISM of our Galaxy; see, for example, reviews by Kulkarni & Heiles (1987); Cox (1989); Reynolds (1991a); Mathis (2000). This phase consists of regions of warm (104 K), low-density (10-1 cm-3), nearly fully ionized hydrogen that occupy approximately 20% of the volume within a 2 kpc thick layer about the Galactic midplane (e.g., Reynolds, 1991b; Nordgren et al., 1992; Taylor & Cordes, 1993; Haffner et al., 1999). Near the midplane, the rms density of H II is less than 5% that of H I. However, because of its greater scale height, the total column density of interstellar H II along high Galactic latitude sight lines is relatively large, with . One kiloparsec above the midplane, warm H II may be the dominant state of the interstellar medium in the Milky Way. Widespread, diffuse ionized gas is now firmly established as an important constituent of the ISM in external galaxies as well (e.g., Rand et al., 1990; Hunter & Gallagher, 1990; Dettmar, 1992; Walterbos & Braun, 1994; Ferguson et al., 1996; Rossa & Dettmar, 2000; Collins & Rand, 2001; Miller & Veilleux, 2003).
Despite its significance, the origin and physical conditions within the warm ionized medium (WIM) remain poorly understood. In particular, the ubiquitous nature of this gas is difficult to explain. Of the known sources of ionization within the Galaxy, only O stars generate enough power to sustain the WIM (Reynolds, 1992). Therefore, it is generally believed that the O stars, confined primarily to widely separated stellar associations near the Galactic midplane, are somehow able to photoionize a significant fraction of the ISM not only in the disk but also within the halo, 1-2 kpc above the midplane. However, the need to have a large fraction of the Lyman continuum photons from O stars travel hundreds of parsecs through the disk seems to conflict with the traditional picture of H I permeating much of the interstellar volume near the Galactic plane. It has been suggested that extensive cavities in the neutral gas, created either by “superbubbles” of hot gas from supernovae (Norman, 1991), or carved out by O star photons in low-density regions (Miller & Cox, 1993), may extend far above the midplane (Dove & Shull, 1994; Dove et al., 2000). Although the existence of H I superbubbles has long been established (Heiles, 1984), direct observational evidence that cavities are actually responsible for the transport of hot gas and ionizing radiation up into the Galactic halo is very limited. One piece of evidence for such transport has been provided recently by the WHAM H sky survey (Reynolds et al., 2001a, also see §6 below).
The WHAM H sky survey is a velocity-resolved map of diffuse interstellar H emission at angular resolution over the entire northern sky () within approximately km s-1 of the local standard of rest (LSR) (Haffner et al., 2003). The survey maps show H emission covering the sky, with ionized gas associated with large scale loops, filaments, and bubbles superposed on a fainter, diffuse background, as well as the bright classical H II regions near the Galactic plane. Several of the high latitude structures appear to be associated with hot stars and OB associations; however, the diffuse background and many features superposed upon it have no clear association with known ionizing sources. This survey provides the basis for studies of the physical conditions within these newly revealed emission regions and the source of their ionization.
Even though the primary source of ionization is believed to be O stars, the temperature and ionization conditions within the diffuse ionized gas differ significantly from conditions within classical O star H II regions. These conditions have been inferred by using optical line ratios diagnostic techniques. For example, anomalously strong [S II]/H and [N II]/H, and weak [O III]/H emission line ratios (compared to the bright, classical H II regions) indicate a low state of excitation, with few ions present that require ionization energies greater than 23 eV (Reynolds, 1985a; Haffner et al., 1999; Rand, 1997). This is consistent with the small value of He I /H near the midplane, indicating that the ionization fraction of helium is low and suggesting that the spectrum of the diffuse interstellar radiation field that ionizes the hydrogen is significantly softer than that from the average Galactic O star population (Reynolds & Tufte, 1995; Tufte, 1997). In addition, the elevated [N II]/H and [S II]/H ratios in the WIM suggest that this low density diffuse gas is significantly warmer than traditional H II regions and may require spectral processing of the stellar radiation (e.g. Wood & Mathis, 2004) and/or an additional heating source beyond photoionization (Reynolds et al., 1999). Recent observations of [N II]/[N II] have indeed confirmed that the WIM is about 2000 K warmer than H II regions (Reynolds et al., 2001b).
Below we present new WHAM observations of [N II], [S II], [O III], He I and [N II] toward large-scale emission structures as well as individual lines of sight, representing a substantial increase in the number of observations of these diagnostic emission lines in the Galaxy. This is primarily an empirical study. The emission regions examined span a wide range in location, environment, morphology, and scale, and we have compared the line intensity ratios in these different environments in order to explore the variations in physical conditions between them. A more detailed analysis and deeper understanding of all these different regions, the relationships between them, and the reasons for the observed differences will require combining these observations with photoionization models, and is beyond the scope of this work.
We begin with an overview of the relationship between the emission line ratios and the temperature and ionization state of the gas in §2. Our observational techniques and data reduction procedure are discussed in §3. In §4, we present our results for several classical O-star H II regions that form the basis for comparison to the fainter H emission structures. To illustrate the general spectral difference between the H II regions and the WIM, we present in §5 spectra toward one of the H II regions, where the diffuse gas and the classical H II region are along the same line of sight, but at separate radial velocities. Two large bubble-shaped features that each span more than 40∘, the Orion-Eridanus bubble and the Perseus superbubble, are discussed in §6 along with comparisons to the H II regions and the WIM. Observations of high latitude filamentary structures are presented in §7. A direct measure of the temperature of ionized gas, through observations of [N II] and [N II], is discussed in §8, followed by a summary and conclusions in §9.
2 EMISSION LINE RATIOS AND PHYSICAL CONDITIONS
Observations of optical emission lines and their relative strengths is a common diagnostic tool used to assess the physical conditions of ionized gas. The WHAM sky survey has measured the H surface brightness, , which is directly proportional to the emission measure. In the absence of extinction, this relationship is
| (1) |
where is the temperature of the gas in units of 104 K, and is measured in Rayleighs1111 R = /4 photons s-1 cm-2 sr-1 (Haffner et al., 2003).
In the WIM, the collisionally excited lines of [N II] and [S II] are the next brightest optical lines that can be observed with WHAM. Haffner et al. (1999) presented the first velocity resolved maps of these lines in the Galaxy, toward a 40∘30∘ region in Perseus. Radial velocity interval maps showed a strong trend in [N II]/H and [S II]/H, in which these ratios were higher toward regions of low H emission, while [S II]/[N II] remained relatively constant. These line ratio variations can be interpreted as variations in the temperature and ionization state of the gas as follows. Using the standard formulation for the strengths of collisionally excited lines, the [N II]/H intensity ratio can be parameterized as
| (2) |
where the lines strengths are measured in energy units, is the temperature in units of 104 K, N/H is the gas phase abundance by number, and N+/N and H+/H are the ionization fractions of N and H, respectively (Haffner et al., 1999; Osterbrock, 1989). The similar first ionization potentials of N and H (14.5 and 13.6 eV, respectively), along with N-H charge-exchange, mean that in the WIM the ionization fraction of N+/N is expected to be similar to H+/H. The fraction H+/H is observed to be near unity in the WIM (Reynolds et al., 1998; Hausen et al., 2002a), and the high second ionization potential of N (29.6 eV) means that little N is likely to be in the form of N++. This is supported by the weak [O III]/H ratios in the WIM (see below) and by photoionization modeling (e.g., Sembach et al., 2000), which have shown that N+/N over a wide range of input spectra and ionization parameters. As a result, N+/H+ is likely to depend almost entirely on the gas phase abundance of N/H, which we have assumed to be the same for all the emission regions. Using this argument, Haffner et al. (1999) attributed the higher [N II]/H ratios in the WIM to higher temperatures of the gas, which has since been confirmed (see §8). They found in the Perseus spiral arm, for example, an increase in temperature from K close to the Galactic plane up to K at 1 kpc from the midplane.
The observed variations in [S II]/H can also be interpreted as a change in temperature. However, the second ionization potential of S (23.4 eV) is just below the neutral He edge at 24.6 eV. Therefore, a significant fraction of S can be S++, and the ratio of [S II]/H is a combination of both temperature and ionization effects. The ratio of [S II]/[N II], however, is insensitive to temperature because of the nearly identical energies required to excite the lines. This ratio can be parameterized as
| (3) |
with the same conventions as equation 2 (Haffner et al., 1999; Osterbrock, 1989). By assuming that N+/N does not change in the WIM, and adopting a value for the abundances of N and S, equation 3 can be used to estimate S+/S.
A more direct method of measuring the temperature of ionized gas is through observations of multiple emission lines from the same ion. The extremely faint “auroral” line of [N II], along with [N II], are two such diagnostic lines that are within the observational capabilities of WHAM. The ratio of the emissivity of these lines is given simply by
| (4) |
(Osterbrock, 1989). Reynolds et al. (2001b) were the first to detect this auroral line in the warm ionized medium. Along a single sightline toward the Perseus spiral arm, = (130∘, -7.5∘), this ratio was found to be twice as high as observed in traditional O-star H II regions. They concluded that the WIM in this direction is 2000 K warmer than in H II regions, and that the elevated ratios of [N II]/H and [S II]/H in the WIM are in fact due, at least in part, to higher temperatures.
Because the second ionization potential of oxygen is 35 eV, observations of [O III] can provide information about the higher ions. In particular, in regions where [O III]/H is large, the assumption above that N++ is small may not be valid. The ratio of strengths of [O III] and H can be parameterized as
| (5) |
(Osterbrock, 1989; Otte et al., 2002). Reynolds (1985a) searched for [O III] emission in the diffuse WIM along two lines of sight in the Galactic plane, and found that [O III]/H is very low, 0.06. We confirm this result.
A constraint on the hardness of the radiation field is provided by observations of He I. This recombination line is the helium equivalent of Balmer-, and thus is related to the number of He-ionizing photons with eV. The strength of He I relative to H is given by
| (6) |
(Reynolds & Tufte, 1995) and is therefore a measure of the relative flux of helium ionizing photons to hydrogen ionizing photons. In directions at low Galactic latitude (where 10 R), Reynolds & Tufte (1995) and Tufte (1997) found He I/H significantly below that measured for O star H II regions. These observations implied that the spectrum of the diffuse radiation field in the WIM, at least along those low latitude lines of sight, is significantly softer than that from the average Galactic O star population.
We have extended these emission line analyses to many other directions in order to explore the variations in conditions within the different regions of interstellar ionized hydrogen mapped by the WHAM survey. When estimating the physical conditions, we assume that H+/H = 1, and N+/N = 0.8. When estimating electron densities from the emission measure, we assume the gas is at K and completely fills a spherical or cylindrical volume defined by its appearance on the sky. Except where noted, we also assume interstellar gas phase abundances of N/H = (Meyer et al., 1997), S/H = (Anders & Grevesse, 1989), O/H = 3.19 (Meyer et al., 1998), and He/H = 0.1.
3 OBSERVATIONS
All of our observations were obtained with the Wisconsin H-Alpha Mapper (WHAM) spectrometer. WHAM was specifically designed to detect very faint optical emission lines from the diffuse interstellar medium, and consists of a 0.6 m siderostat coupled to a 15 cm dual-etalon Fabry-Perot system (Tufte, 1997; Haffner et al., 2003). It produces a spectrum at a resolution of 12 km s-1 within a 200 km s-1 wide spectral window, integrated over circular, diameter field of view. The spectrometer can be centered on any wavelength between 4800 and 7400 Å. WHAM is located at the Kitt Peak National Observatory in Arizona and is completely remotely operated from Madison, Wisconsin.
The data presented here can be separated into two categories: survey mode observations and pointed mode observations. The large-scale maps of [N II] and [S II] toward the Orion-Eridanus bubble ( 400 deg2) and the Perseus bipolar superbubble ( 2400 deg2) were taken in survey mode, similar to the manner in which the WHAM-NSS data were obtained (see Haffner et al., 2003). For this mode the observations were divided into contiguous ‘blocks’, with each block consisting of up to 49 observations that cover an approximately area of the sky. Each direction within a block was observed once for 60 s in each line, with several blocks observed per night. In addition, spectra of [N II], [N II], [S II], He I, [O III], and were obtained toward a number of individual sightlines in pointed mode to probe selected parts of emission features at a high signal-to-noise ratio. Hereafter, [N II] will refer to the line, unless otherwise indicated. Pointed observations were made by alternating between a given sightline toward a selected feature, an ON direction, and an accompanying, usually nearby, OFF direction. Each pair of observations was observed for 120 s at a time (to get well above the effective 4 readnoise of WHAM’s CCD) with a total ON integration time of a few hours for the faintest lines (e.g., [N II]). The OFF directions were chosen to be as spatially close to the ON direction as possible and to provide the off-source spectrum containing the atmospheric foreground and Galactic background emissions. All of the observations were carried out during clear, dark of the moon nights to avoid the contribution of scattered solar and terrestrial lines in the spectra.
3.1 Removal of Atmospheric Emission Lines
The geocoronal H line, with 5-10 R, is the strongest terrestrial emission line contaminating the Galactic spectra. However, in addition to H, all of the spectra are contaminated by much weaker atmospheric lines, typically 5-7 with R and FWHM km s-1 within the 200 km s-1 spectral window. The positions of these lines, which are largely unidentified, are fixed with respect to a geocentric reference frame. Their strength is observed to vary with both position in the sky and with time during the night, sometimes by up to a factor of two. However, their relative strengths do not appear to change by more than 10% (Haffner et al., 2003; Hausen et al., 2002b).
To remove this faint foreground emission in the survey mode observations, an atmospheric line template was fitted to and then subtracted from each spectrum, in the manner described by Haffner et al. (2003). These templates were constructed by observing the faintest direction in the H sky, in multiple emission lines, for an entire night. This direction is near the Lockman Hole (Lockman et al., 1986), and has a total H intensity of 0.1 R (Hausen et al., 2002b). The average of the all the spectra had a sufficient signal-to-noise ratio to reveal the location, width, and relative intensities of these atmospheric lines. An examination of the changes among individual spectra taken through the night confirmed the terrestrial origin of the lines and provided a measure of their overall strength. Since the relative strengths of the lines appear to be constant, the template was multiplied by a single number, a scaling factor, for each block of survey mode observations. The value of this scaling factor was determined by matching the strengths of atmospheric lines in parts of block-averaged spectra that did not show any Galactic emission. The scaled template was then subtracted from each spectrum in the block.
In pointed mode spectra, the atmospheric lines were removed by subtracting an appropriate OFF from the ON to produce a flat continuum. Past exprience with this technique has shown that the degree to which the atmospheric emission in the OFF spectrum represents the emission in the ON spectrum is usually the dominant source of uncertainty in the resulting Galactic spectrum (e.g., Madsen et al., 2001; Gallagher et al., 2003). The large number of short exposure time observations employed in this study, combined with the alternating ON/OFF observing technique yielded a very good subtraction of the atmospheric lines. Some spectra were sensitive to lines as faint as R. This lower limit is set by random errors in the baseline as well as a slightly incomplete subtraction of the atmospheric lines.
3.2 Intensity Calibration
Intensity calibration involved several steps. The H spectra were calibrated using synoptic observations of a portion of the North America Nebula (NAN), which has an H surface brightness of = 800 R with an uncertainty of (Scherb, 1981; Haffner et al., 2003). All of the other emission line data were calibrated initially by determining the throughput of the spectrometer at the different emission line wavelengths relative to H. These included the quantum efficiency of the CCD, the transmission of the narrowband (FWHM 20Å) interference filters, the transmission of the atmosphere, and a correction for the properties of the WHAM optical train (e.g. coatings, reflections, and transmission of the mirrors and lenses). The corrections for the CCD quantum efficiency and the interference filters were based on data provided by the manufacturers of those systems. The transmission of the atmosphere could not be well determined on a night-by-night basis, due to a lack of observations of a large number of calibration targets taken at a variety of airmasses each night. A few nights, however, were spent observing enough targets to determine the average relative transmission of the atmosphere. We determined an average zenith transmission that ranges from 94% at [S II] to 85% at H. These data agree well with the standard atmospheric transmission curve at Kitt Peak that is included in the popular IRAF data reduction package. We assumed that the relative transmission of the atmosphere was the same for each night of observing and that the atmosphere is plane-parallel.
The correction for the transmission of the WHAM optics was determined empirically by using a combination of H and H observations toward a part of the large H II region surrounding Spica ( Vir), a nearby B1 III star. In the absence of extinction, the photon number ratio of to of warm, low density photoionized gas is 3.94, set by the ‘Case B’ recombination cascade of hydrogen (Osterbrock, 1989; Hummer & Storey, 1987). We assume that the emission from the Spica H II region suffers no extinction because of its proximity ( pc; Perryman et al., 1997), high Galactic latitude (), and the low interstellar hydrogen column density to the exciting star ( cm-2; York & Rogerson, 1976). After applying the CCD, interference filter, and atmospheric corrections mentioned above, we found that the H spectra needed to by multiplied by an additional factor of 1.36 for the ratio of / to be equal to the expected value of 3.94. We assume that this decrease in transmission from the red to the blue is linear with wavelength, and interpolate this correction for the other, redder, emission lines. As a consistency check, fully corrected H and H spectra toward NAN yielded an / ratio of 5.1, consistent with observations of extinction toward stars in the nebula (Cambrésy et al., 2002). The results presented in Madsen & Reynolds (2005) also confirm the validity of this calibration technique. Note that nearly all the results presented here involve comparing line ratios in one emission region with the corresponding ratio in another region. As a result, much of the analysis is insensitive to calibration errors between different wavelengths.
3.3 Measurement Uncertainties
The velocity calibrations of these spectra were derived from observations of bright, narrow emission line HII regions, and are based on the assumption that the emission from all of the lines from an individual H II region are at the same velocity with respect to the local standard of rest (LSR). For H, H, and [S II], relatively bright terrestrial emission lines within the spectra were used to confirm the calibration. The calibrations were also checked against an empirical prediction based on the tunes of the Fabry-Perot etalons (see Madsen, 2004, Chapter 5). The resulting systematic uncertainty is estimated to be typically 2-3 kilometers per second. The uncertainty in the velocity calibration due to random noise in the data is only a few tenths of a kilometer per second.
One of the contributions to the uncertainty in emission line strengths comes from the random errors in measuring the level of the continuum. A least-squares linear fit was used to estimate the continuum level and remove it from each spectrum. However, there is scatter in the residual due to the Poisson statistics of the detected photons as well as from the incomplete subtraction of the atmospheric lines. This scatter introduces an uncertainty when integrating the area under the emission line. In the pointed mode observations, this dominant source of uncertainty was generally R, and in some cases half of that value. The 1 values are listed in Tables 1 through 6. For some observations, the measured line strength is negative, indicating a non-detection. In this case an upper limit to the line strength, equivalent to the 1 uncertainty, is given in the Tables.
In the survey mode spectra, on the other hand, the large area of the sky observed in this mode prohibited an alternating ON/OFF observing technique. Also, these spectra were obtained with considerably shorter total exposure times and often have Galactic emission present across much of the 200 km s-1 spectral window. As a result, the dominant source of uncertainty in this mode is the removal of the atmospheric lines, which in turn depends upon the accuracy of the atmospheric line template and the uncerainty in its scaling factor. We conservatively estimate the uncertainty in the scaling factor to be 30%, based on the visual appearance of the corrected spectra, as well as the values of the different scaling factors used in all of the spectra. The uncertainty varies with position within each spectrum, because the atmospheric lines only appear in certain places in each spectrum. The error bars that appear in the figures below for survey mode data represent this 30% uncertainty in the atmospheric scaling factor.
4 OBSERVATIONS OF CLASSICAL H II REGIONS
The warm ionized medium is thought to be ionized primarily by Lyman continuum photons from hot stars, although the mechanism by which this happens is largely unknown (see §1). Therefore, to investigate the nature of the WIM, it is useful to compare the observed emission line ratios in the faint diffuse emission regions with the corresponding ratios observed in the bright classical H II regions immediately surrounding hot stars. In this section we discuss the results of emission line strengths of H, [N II], [S II], [O III], and He I relative to H for a collection of 13 O-star H II regions, plus two regions of ionized gas surrounding hot evolved stellar cores. Some of these H II regions (immediately surrounding O stars in Orion OB1 and Cas OB6) are associated with much larger extended regions of filaments and loops, allowing us to explore the question of whether the diffuse WIM is the superposition of such extended structures surrounding some O stars and O associations (§§6.1 and 6.2).
Tables 1 and 2 summarize the H II region observations, which were taken in pointed mode. The OFFs were selected based on the H maps from the WHAM-NSS. They were chosen to be as close to the H II region as possible, but in regions where the emission is diffuse and could be considered to be part of the WIM. This selection criteria was somewhat subjective, and many OFFs were tens of degrees away from the H II regions. However, the resulting line intensities are mostly insensitive to the selection of OFFs, because the H II region emission lines are much stronger than those of the background WIM and the atmosphere.
The first column in the top part of Table 1 gives the names of the O-star H II regions from the catalogs of Westerhout (1958), Sharpless (1959), and Sivan (1974). The names and spectral types of the stars or OB associations thought to be creating the H II regions are listed in the second and third columns, respectively. The identification of the ionizing sources come from the angular proximity of the H II regions to stars found in the databases of SIMBAD and the O-star catalog of Maíz-Apellániz et al. (2004), and should not be necessarily considered secure. For the OB associations, the listed spectral type is for the hottest known member of the association. The exciting O stars have been sorted in order of increasing stellar temperature. The bottom two rows of the table provide information about the two H II regions near evolved stellar cores and are also identified by the spectral type of the likely ionizing source. The Galactic coordinates of each observation direction appear in columns 4 and 5. The centroid LSR velocity of the H emission from each H II region is listed in column 6.
Many of the H II regions were observed in H as well as H in order to quantify the extinction to these sources, which lie primarily near the Galactic plane. In photoionized gas at a temperature of K, the ratio of the number of H to H photons emitted is 3.94 (Hummer & Storey, 1987; Osterbrock, 1989), which is only very weakly dependent on temperature () and density. Our observed values of and can then be used to estimate the extinction to the nebulae. Assuming the dust has a total-to-selective extinction ratio , and the wavelength dependence of extinction characterized by Cardelli et al. (1989), we obtain
| (7) |
(Madsen & Reynolds, 2005). These values of are listed in column 7 of Table 1. The uncertainties in are a reflection of the uncertainties in the strength of the H and H lines as discussed in §3.3, with the errors propagated according to equation 7.
For directions in which was determined, the intensity of the observed lines (and its uncertainty) has been adjusted to its extinction-corrected value, using the extinction at other wavelengths determined by Cardelli et al. (1989). A few H II region observations were not observed in H, and hence no value of was derived. Because of the uncertainties in the measurements of , and their relatively low values, we have not corrected the emission from the H II regions that were not observed in H. However, the corrections to the line ratios (Table 2) are not very sensitive to moderate values of , especially for [N II]/H and [S II]/H. For a given value of , the correction factors are , , , and for [O III]/H, He I/H, [N II]/H, and [S II]/H, respectively, using the ratio of optical depths at different wavelengths from Cardelli et al. (1989). Only one of the non-corrected O-star H II regions, S292, which is ionized by the CMa OB1 association, lies near the Galactic plane where the extinction may be significant. Clariá (1974) conducted a photometric study of this star cluster, and found considerable scatter in the visual absorption for member stars of the OB association, with a mean value of mag. If the emission from S292 suffers this same average extinction within the WHAM beam, than the extinction corrected value for is 514 R. The corrections for the line ratios are all smaller than the uncertainties, except for [O III]/H which increases from 0.10 to 0.13. The other two non-corrected O-star H II regions, S264 and S276, are both part of the nearby Orion OB1 association, which has a lower mean interstellar extinction of mag (Witt & Lillie, 1978). The two non-O-star H II regions at the bottom of Table 1 were also not corrected, but they are at very high latitudes, , where the exinction is also likely to be low.
The data in the eighth column of Table 1 lists the intensities of the H line within WHAM’s beam. We note that this measurement is a lower limit for several H II regions that do not fill the beam, as indicated in the Table. We see that these extinction corrected H intensities vary by three orders of magnitude, from 2 R to 3000 R, with the brightest toward the OB association Cas OB6, and the faintest toward the two faint evolved stellar cores.
The line strengths of [N II], [S II], [O III], and He I emission relative to H, (in energy units) are presented in Table 2. For [N II]/H, we find that the average value for the O-star H II regions is 0.27. As will be seen in the following sections, this value is significantly lower than what is generally observed in the WIM, where a typical value of [N II]/H is 0.5, but in some cases exceeds 1.0. In addition, there is no strong trend in [N II]/H with spectral type. If [N II]/H is tracing the electron temperature of the gas, we might expect to see a slight decrease in [N II]/H with decreasing stellar temperature. However, the ionizing radiation from the hottest stars may have a significant flux above 29.6 eV (as suggested by their higher [O III]/H), which can ionize N+ and thus complicate the relationship between electron temperature and [N II]/H (eq. 2). For the three observations taken near the very large H II region ionized by the O7.5III star Per (S220 and Sivan 4), [N II]/H varies by almost a factor of two, from 0.23 to 0.40, with the brightest portion of the region, often referred to as the California nebula, having the highest ratio. The highest [N II]/H ratios are near unity and are associated with the H II regions surrounding the hot stellar cores. These results are presented graphically in Figure 1. The horizontal line in each panel denotes the average value for that particular line ratio.
For [S II]/H, we find an average value of 0.11 for the O-star H II regions. This value is also significantly lower than what is generally found in the WIM, consistent with previous studies. Because of the low ionization potential of S+, [S II]/H is more sensitive to ionization effects that [N II]/H. However we do not see any strong trends in this ratio with spectral type of the ionizing sources. Again, the highest [S II]/H ratios are associated with the regions that surround the hot stellar cores. On the other hand, line ratios that include ions with higher ionization potentials, namely, [O III]/H and He I/H are observed to increase with increasing photospheric temperature of the O star. This is consistent with the gas near the hotter stars being subject to a harder incident spectrum. We find a large scatter in [O III]/H with an average value of [O III]/H of 0.18. Values for He I/H show a strong trend with spectral type, ranging from about 0.011 for S276 (O9.5 V) to 0.037 for S132 (WN6 + O6 I).
The last two rows of the Table 2 summarize the observations toward two hot, evolved stellar cores. These lines of sight are centered on a sub-dwarf B star and a helium-rich DO hot white dwarf. While they are not traditional H II regions, they were included in this study to compare the emission-line characteristics of the faint ionized gas around these very hot but low luminosity stars with the WIM emission. These two H II regions were first noted by Haffner (2001), in a preliminary search of the WHAM-NSS for faint H emission near hot white dwarf and sub-dwarf stars. A more thorough search of the H survey has revealed numerous small () scale H enhancements, many of which are not associated with any known ionizing source (Reynolds et al., 2005). The detection of enhanced H emission around the star PG 1047+003 is the first detection of ionized gas surrounding this sub-dwarf B star. The emission associated with DO star PG 1034+01 near = (248∘,+48∘) has been recently explored by Hewett et al. (2003) and Rauch et al. (2004), who conclude that this region is a high-excitation, planetary-nebula like object. The line ratios, particularly the high values of [N II]/H and [O III]/H, toward both of these regions are consistent with planetary nebula spectra.
We now proceed to compare the spectral characteristics of these classical H II regions with those of the much of larger scale emission features revealed by the WHAM H survey, including the diffuse WIM.
5 THE WARM IONIZED MEDIUM
As mentioned in §§1 and 2, the spectral characteristics of the WIM differ significantly from the classical H II regions. This has been discussed in detail in earlier studies (e.g., Haffner et al 1999). As an illustration of the principal difference between WIM and H II region spectra, we show H, [N II], and [S II] observations toward the O star H II region Sivan 2 in Figure 2. Two radial velocity components are present along this line of sight. Velocity channel maps from the WHAM survey show that the emission near = 0 km s-1 is associated with diffuse foreground emission (i.e., the local WIM). This emission was well separated in velocity from the H II region emission, allowing a direct comparison of the relative intensities of the lines from the two different sources in the same spectrum.
The velocity of each component was determined from a least-squares fit of a sum of Gaussian profiles to the [S II] spectrum. The [S II] spectrum was chosen because of its narrow, well-resolved component profiles and its high signal-to-noise. The resulting component velocities are shown as vertical dashed lines in the Figure. The strength of each component was calculated from a two-component Gaussian fit to each spectrum in which the velocities for each component were fixed as determined from the [S II] spectrum.
These spectra clearly reveal that [N II] 6584/H, [N II] 5775/H, and [S II]/H are significantly higher in the diffuse gas compared to the H II region, with [N II]/H = 0.83 and [S II]/H= 0.38 in the WIM, compared to 0.23 and 0.12, respectively, for the H II region. The [N II]/H data suggest that the temperature of the diffuse gas is 9000 K, compared to 6100 K for the H II region. The high temperature derived for the WIM relative to the H II region, from the [N II]6584/H ratio (§2), is confirmed by observations of the highly temperature sensitive [N II] emission line. These observations show relatively bright [N II] emission for the fainter (in H) WIM component, while the [N II] line is not even detected in the cooler H II region component (see also §8 below).
Additional differences between the H II regions, the WIM, and other faint, large-scale emission features in the H sky are discussed in the following sections. For this paper, the ‘WIM’ refers to the gas that produces the faint, diffuse emission outside the classical H II regions, extended bubbles and superbubbles, and high latitude filamentary structures.
6 H I CAVITIES AND SUPERBUBBLES
One of the basic questions concerning the nature of the WIM is how ionizing photons from O stars are able to travel hundreds of parsecs from the stars. One possibility is the existence of enormous H I-free bubbles surrounding some of the O stars. In §6.1 and §6.2, we examine in detail the faint optical line emission associated with two very extended bubble-like regions which have diameters of 40∘ - 60∘ (up to 2 kpc in extent) and which are ionized by luminous O associations. The line ratios are then compared with ratios in the more diffuse WIM to examine whether the WIM could be a superposition of such regions.
6.1 Orion-Eridanus Bubble
One of the largest networks of interconnected H-emitting structures in the WHAM sky survey appears in the constellations of Orion and Eridanus, shown in Figure 3. The presence of optical and radio-emitting filaments in this general direction has been known for many years. Reynolds & Ogden (1979) carried out velocity resolved emission-line observations of this region, and found that the filaments, loops, and enhanced H emission are all part of an expanding shell of neutral and ionized gas with a diameter of pc. They suggested that Lyman continuum photons from the Ori OB1 association, located near one side of the bubble, travel largely unimpeded through the hot ( K) interior cavity and ionize the inner surface of its surrounding outer shell. They estimated the shell has a density near 1 cm-3, which is significantly higher than the density in the WIM; nevertheless, the large extent of the cavity has produced diffuse and filamentary H covering a region of the sky and up to 34∘ from the OB association. This picture is supported by the detection of diffuse X-ray emission interior to the bubble walls, as well as more recent studies of H I in the region (Burrows et al., 1993; Brown et al., 1995).
The shell is expanding at a velocity of about 20 km s-1, likely as a result of supernova activity; however, Reynolds & Ogden (1979) have shown that the contribution from shocks to the ionization of the walls of the bubble is likely to be negligible. They found that among the most luminous stars within the bubble, Ori, an O9.5 I star, is probably responsible for most of the ionization. It is the only hot star in the cavity that has no discrete H II region around it, implying that most of its ionizing radiation travels unimpeded through the cavity. The Orion-Eridanus bubble, which is significantly brighter in H compared to the more diffuse WIM, is thus an excellent environment in which to study the relationship between traditional H II regions and the warm ionized medium. By comparing the physical conditions within, around, and outside this bubble, we can assess the similarities and differences between gas that is part of a large cavity ionized by a known source and the fainter, diffuse WIM.
6.1.1 Large-Scale Trends
We have observed this bubble along several lines of sight in the emission lines of H, [N II], [S II], [O III], and He I. Superposed on the map of this region, presented in Figure 3, are the approximate locations of the pointed observations. The bubble is outlined approximately by a circle that goes through directions A, 1, 2, 5, 7, and G. Direction 3 is located outside of the boundary and samples diffuse interstellar gas near the Galactic plane. The numbered directions are ordered with increasing distance from the Orion OB1 association, located near Ori and its H II region, which is indicated on the diagram with the letter . A set of seven closely spaced observations were also made that cut across a filament near the lower edge of the bubble, and are labeled A-G. Two directions denoted by ‘X’ were used as OFFs for the reduction of the pointed observation spectra. The OFFs have an H intensity of 0.5 R, and subtracting them from the ONs allows us to isolate emission in the bubble from any background or foreground emission. The green box in Figure 3 indicates a region of the bubble that also was mapped in [N II] and [S II].
Table 3 summarizes our pointed observations of this region, with the name of each direction corresponding to the labels in Figure 3. The columns in the table are similar to those in Tables 1 and 2. However, the fourth column shows the angular distance of each direction from = (206.5∘, -18.0∘), the H flux-weighted center of the bubble, as determined by Reynolds & Ogden (1979) and roughly the center of the Orion OB 1 association. The spectrum toward direction 1 has two emission components; the emission line strengths that appear in the table include the total emission from both components. Also, because of the weak dependence of the line ratios on , and the low extinction to this nearby region ( 0.15 mag; Witt & Lillie, 1978), no extinction correction was applied to the data. As discussed in §3, OFF spectra were subtracted from each of these pointed observations, and all of the results in the table represent ‘background subtracted’ values. This procedure isolates emission that is only associated with the Orion-Eridanus bubble.
A graphical summary of the line ratios is shown in Figure 4. The panel on the left includes the observations that are within or on the boundary of the bubble (1-7), except for direction 3. The panel on the right shows the results for the series of observations that cut across the outermost filament at (A-G), which appears to be an edge-on projection of the cavity’s outer shell. These pointings, spaced about 1∘ apart, begin on one side of the H filament (the side toward the O association), cross the filament, and end just outside the ionized part of the bubble (see §6.1.2). The column density of H I from Hartmann & Burton (1997), is also shown in the panel on the right (green), and indicates the location of the neutral portion of the shell. The name of each observation direction appears above the panels. The data are shown as a function of , the angular distance from the center of the OB1 association, which is useful in order to search for potential changes in the physical conditions of the gas with increasing distance from the ionizing source. The top plot in each panel shows the H intensity toward each direction on a logarithmic scale. The second plot from the top shows the values of [N II]/H and [S II]/H, while the third and fourth plots give [O III]/H and He I/H, respectively. The horizontal line in each plot represents the average value for the ratio in H II regions (Table 2; Figure 1); for [O III]/H, the H II region average, 0.094, is off scale.
For directions 1-7, we see that [N II]/H varies between 0.2 to 0.3, and there is no significant correlation with out to from the association. The ratio is weakly anti-correlated with , with brighter regions of the bubble having lower values of [N II]/H. This is a common behavior seen in these bubble structures and in the WIM, both for the Milky Way and other galaxies (Haffner et al., 1999; Rand, 1998; Collins & Rand, 2001). [N II]/H is near the value of the average H II region, and slightly lower than in the Ori H II region, which appears to reside inside (or perhaps on the wall of) the cavity. The variation in [S II]/H ( 0.15 - 0.25) is larger than for [N II]/H, and there is a very weak trend in which [S II]/H is higher at larger distances from the association, where it becomes larger than the average ratio in classical H II regions. The ratio [S II]/[N II] also increases with , from 0.55 for direction 1 to 0.95 in direction 6. As will be seen later, [N II]/H and [S II]/H in the bubble are generally lower and exhibit less scatter than the ratios observed in the WIM.
The [O III]/H ratio is extremely low throughout the bubble, , with the exception of direction 4 (direction 3 is outside the bubble), and is an order of magnitude below the average value of 0.18 for the H II regions (Table 2). Similarly, the He I/H ratios are low () relative to the H II region average.
Based upon the discussion presented in §4, the [N II]/H and [S II]/[N II] data suggest that the temperature of the ionized gas is between with . In addition, the He I data suggest that He+/He . We can quantify the hardness of the radiation field by assuming from the above He+/He ratio that the volume of the He+ zone along these lines of sight is smaller than the volume of the H+ zone by a factor of 0.3. The ratio of total number of He-ionizing photons (He0) to H-ionizing photons (H0) along the line of sight is then proportional to this volume ratio, specifically (He0)/(H0) 0.03 (Osterbrock, 1989). This corresponds to a star with an effective temperature 35,000 K, equivalent to O8.5 I or O9.5 V or cooler (Vacca et al., 1996). This is consistent with the likely ionizing source of the shell, Ori, which is an O9.5I star, although further analysis using recent stellar atmosphere models is needed to confirm this scenario (Martins et al., 2005). The low He+/He is consistent with the apparently low ionization state of oxygen, where [O III]/H suggests that O++/O 0.04 (exception for direction 4, where O++/O 0.1). Outside the bubble and closer to the Galactic plane (direction 3), He+/He , suggesting that the radiation field outside the shell is significantly harder, consistent with a continuum source with 40,000 K, an O7 star or earlier.
6.1.2 The H II to H I Transition through the Shell
The data on the right panel in Figure 4 show the variation in the line ratios across the outer edge of the bubble, where the hydrogen in the shell is making a transition from fully ionized (on the shell’s inside surface) to completely neutral. Here we see small, but significant trends in the ratios of [N II]/H and [S II]/H across this outer filament, which is a projection enhancement from an edge-on view of the shell. The ratio of [S II]/H follows the variation in [N II]/H very closely, with [S II]/[N II] 1.0, except for the direction inside (A), where [S II]/[N II] 0.7. Interestingly, the data show that this filament is brightest in [N II] and [S II] (is highest in temperature?) at a different location than the brightest part in H, with [N II] and [S II] both peaking about pc further away from the ionizing source(s). The peak brightness of H I is even farther to the outside, near direction G. These trends are also shown in the line ratio maps of this region presented below. Both [O III] and He I are very weak and show no clear trends across the filament.
We note that while there are statistically significant trends in [N II]/H and [S II]/H across the outer edge of the shell, the magnitude of the variations are small. As a result, changes in the physical conditions, as suggested by the line ratios, are not very dramatic. Potential complications introduced by the unknown geometry and multi-phase nature of the bubble could be important when using the observed line ratios to infer changes in the actual physical conditions. For example, small variations in the volume-averaged ionization fractions of both N and S along the lines of sight may complicate our interpretation that [N II]/H is tracing the temperature of the gas. However, the constancy of [S II]/[N II] strongly indicates that the variations in [N II]/H and [S II]/H are dominated by variations in temperature (see eq. 3). If we assume that N+/N = 0.8 everywhere across the shell, then the [N II]/H data suggest that the temperature of the warm ionized gas associated with the edge of this bubble is K toward direction A, falling to 6000 K at the inside edge of the filament, and rising back up to about 6300 K before falling back down to near 6000 K just outside the shell. This apparent rise in temperature toward the backside of the H filament (farther away from the ionizing source) could be due to a slight hardening of the radiation as it penetrates into the shell and just before it is completely absorbed where the shell becomes neutral (Wood & Mathis, 2004).
Figure 5 shows a more comprehensive picture of the [N II] and [S II] emission in this region, obtained in survey mode. The figure contains maps of the H and H I intensity, [N II]/H, [S II]/H, and [S II]/[N II]. The maps were created by integrating the emission lines over their entire profiles, between of the LSR. The blue contours outline the location of strong 21 cm emission from Hartmann & Burton (1997), the outermost, neutral portion of the shell, with the contour levels corresponding to column densities of 5.6, 6, 7, 9, and 11 cm-2. The green circles represent the pointed observations A-G discussed above. This view also includes a large region outside of the shell to higher (more negative than -52∘) Galactic latitude, dominated by the faint, diffuse WIM.
The trends that were found for the pointed directions that traverse the outer edge of the bubble are also apparent in these survey mode observations. However, the maps in Figure 5 reveal that these trends hold across the entirety of the shell edge, and not just for one slice through it. The H map in Figure 5 shows that the ionized gas associated with the edge of the bubble lies a few degrees inside of the neutral H I edge, and decreases in intensity before the peak in H I emission, as was also shown in Figure 4. Also, note the ridge of enhanced [N II]/H and [S II]/H at that runs parallel to, and just between, the H and 21 cm bright parts of the outer shell.
The [N II]/H map shows a striking anti-correlation between the H line strength and the [N II]/H line ratio. For example, the very faint WIM emission outside the bubble at is the “brightest” region in the [N II]/H map. In addition, several individual features inside of the bubble show this anti-correlation, such as the region of depressed H emission near = (187∘, -47∘) and the region of enhanced H emission near = (198∘, -41∘). Interestingly, a spatially coherent depression in [N II]/H follows the shape of the outer edge of the bubble, where the H I is getting brighter (i.e., directions F and G). This suggests a decrease in temperature (or a decrease in N+ relative to H+) in the transition region from H II to H I in this outer shell. The data are consistent with this bubble being a large, hot cavity with the inside walls ionized by hot stars within the cavity, as originally suggested by Reynolds & Ogden (1979).
The [S II]/H map is very similar to the [N II]/H map. We see that the diffuse background is significantly brighter in [S II]/H than the rest of the bubble. We also see a dark filament that is nearly co-spatial with the H I shell. This dark filament is similar to the feature in the [N II]/H map, but seems to be of a higher contrast relative to its surroundings. The [S II]/[N II] map shows that the interior of the shell has an elevated [S II]/[N II] line ratio (i.e., a lower ionization of sulfur) than in the WIM at . We note that the coherent features in both the [N II]/H and [S II]/H maps are well above the noise, although the numerical variation in the ratios is small (67% of the data span a range of 0.10 in the ratio).
The interpretation of these maps is complicated by the presence of the background (WIM) emission. These maps are as they appear in the sky, and no background emission has been subtracted from them as was done for the pointed observations. Because [N II]/H and [S II]/H are relatively high in the background, the faint [N II] and [S II] emission inside and near the edge of the bubble is not a representation of emission from the bubble alone. The average strength of the H, [N II], and [S II] emission in the background is 0.99, 0.35, and 0.26 R, respectively. Therefore, because the [N II]/H and [S II]/H ratios are higher in the background than within the Orion-Eridanus bubble, the values for the actual ratios associated with the bubble features in Figure 5 are slightly lower than that given by the color bars. That is, there is an even greater difference between the ionized gas associated with the bubble and the WIM than these maps indicate.
Another visualization of the data in these maps is presented in Figure 6. Here, the ratios [N II]/H, [S II]/H, and [S II]/[N II] are plotted against H intensity for every direction in Figure 5. The total (random and systematic) uncertainties in the data points are shown in the top two panels, with their origin and magnitude discussed in §3.3. The uncertainty in [S II]/[N II] has been omitted for clarity. The data have been separated by latitude, with observations outside the bubble () shown in red (WIM) and observations inside the bubble () shown in blue. For comparison, the average values of these line ratios for all of the O-star H II regions is shown as a green solid line. Note that the abscissa is on a logarithmic scale. These plots show an increase in [N II]/H and [S II]/H in parts of the map with the faintest H emission outside of the bubble, and that [S II]/[N II] is significantly higher than the average H II region. We also see that the scatter in these ratios at low is similar to the scatter at higher . This scatter is significantly larger than the random uncertainties in the data.
A useful diagram that separates the effects of temperature from the effects of ionization state is shown in Figure 7, where [S II]/H is plotted against [N II]/H, using equations 2 and 3 after the fashion presented in Haffner et al. (1999). The vertical dashed lines represent the expected ratio of [N II]/H for temperatures from 5000 K to 10,000 K. The solid lines represent the expected ratio of [S II]/[N II] for an increasing fraction of S+/S between zero and 1.0. The symbols are the same as Figure 6, except that the ratios for the O star H II regions from §4 have also been added and are shown individually in green. The data suggest that on average, the ionized gas in the bubble (blue) has a larger fraction of S in the form of S+ compared to the H II regions (50% vs. 25%), and is similar to that in the WIM (red). The data also suggest that most of the gas within the bubble is at H II region-like temperatures (6000 K 7000 K), significantly lower than in the fainter, more diffuse WIM gas outside the bubble.
6.1.3 Comparison to the WIM
In summary, at this point we conclude that although the low ionization state of the warm ionized gas in the Orion-Eridanus bubble (i.e., enhanced [S II]/H and low [O III]/H) is similar to that in the fainter, more diffuse WIM, the temperature ([N II]/H) appears to be consistently lower than that in the WIM and close to the value found for the classical H II regions. The lower ionization state of the gas compared to the average classical H II region is probably the result of the late spectral type (soft ionizing spectrum) of the primary ionizing star and the low ionization parameter associated with the dilution of the ionizing radiation as it travels to the distant walls of the cavity. The decrease in ionization parameter could explain the weak rise in [S II]/H with distance from Ori OB1. On the other hand, we find no evidence for the [N II]/H ratio becoming more WIM-like with increasing distance from the O association, even at the outer edge, (at least 250 pc) distant. While there is a small increase in both [N II]/H and [S II]/H at the transition from ionized to neutral gas within the outer shell, [N II]/H never approaches the high values found in the more diffuse ionized gas outside the bubble. Thus it appears that the spectral characteristics of the WIM are not explained by the leakage of O star radiation onto cavity walls like those of the Orion-Eridanus bubble.
6.2 Perseus Superbubble and the Local Foreground
To investigate whether the size of the bubble influences the emission line ratios, we examine next a much larger (2000 pc 800 pc) and fainter superbubble ionized by the Cas OB6 association and covering much of the constellations Perseus, Cassiopeia, and Camelopardalis. We will refer to this enormous structure as the “Perseus superbubble”. Compared to the Orion-Eridanus bubble, this superbubble has nearly nine times the linear extent, 1/10 the H surface brightness, and 1/5 – 1/10 the gas density in its shell (i.e., 0.1 – 0.2 cm-3, comparable to densities in the WIM). Figure 8 shows two velocity interval maps of this region covering about 2400 deg2 from the WHAM sky survey. Most H spectra in this region have two or more components, one centered near = 0 km s-1 and one near km s-1. The map on the left shows foreground H emission from the solar neighborhood at , while the map on the right shows emission from the same piece of sky, but over the velocity interval . The emission at these more negative velocities is from the Perseus spiral arm, 2-2.5 kpc distant, and is dominated by the Perseus superbubble (Reynolds et al., 2001a).
Figure 9 shows the emission line spectra from the pointed observations obtained toward the two sightlines at (130∘, -7.5∘) and (133∘, +18∘), denoted by ‘X’s in Figure 8. These sightlines pass through the bipolar loop structure near the outer boundary of the superbubble. H, [N II], and [S II] spectra appear in the top plots, with H, [O III] and He I spectra on the bottom. Note that the [O III] and He I spectra have been multiplied by the indicated values to facilitate the comparison of the relative strengths of the lines. Several fainter OFF directions, used to remove the atmospheric lines and background emission, were located at near the longitude of the pointed observations.
Each of the sight lines contains two or more distinct components, whose velocities were determined by least-squares fits of a sum of Gaussian profiles to the [S II] spectrum in each direction. The [S II] spectrum was chosen because of its narrow, well-resolved component profiles and its high signal-to-noise. The resulting component velocities are shown as vertical dashed lines in Figure 9, with component identification numbers shown above the top plot. The maps on the left and right in Figure 8 correspond to emission from components 1 and 3, respectively, for (130∘, -7.5∘), and components 1 and 2, respectively, for (133∘, +18∘). Therefore, we identify component 3 toward (130∘, -7.5∘) and component 2 toward (133∘, +18∘) with the Perseus superbubble. Component 1 in each direction is associated with ionized gas near the outer edge of extended H II regions surrounding Per and Cam, respectively. The nature of components 2 and 4 toward (130∘, -7.5∘) is not known.
The strength of each component was calculated from a multi-component Gaussian fit to each spectrum in which the velocities for each component were fixed as determined from the [S II] spectra. A summary of the line strengths and their ratios is presented in Table 4. The columns of the table are the same as for Table 3, except that refers to the angular distance of the pointing from the W4 H II region (Cas OB6), the presumed source of the ionizing radiation for the superbubble. A graphical representation of the data in Table 4 is shown in Figure 10. The layout of Figure 10 is the same as Figure 4, with the solid horizontal lines representing the average line ratios of the O-star H II regions. The H intensity for the W4 H II regions (2800 R) is far off the scale of the plot.
H observations toward (130∘, -7.5∘) suggest that the extinction is generally low, with 0.1, 0.4, 0.7, and 0.9 mag for components 1, 2, 3, and 4, respectively. This implies a maximal correction of 30% for the [O III] data (for component 4), and a much smaller correction for the other lines. No correction has been applied to the data in Figure 9 or Table 4. However, the tips of the upward pointed arrows in Figure 10, for the [O III]/H data, denote the change in this ratio if the above extinction corrections are applied. No extinction correction was applied to the data toward the much fainter direction of (133∘, +18∘), where the uncertainty in the H/H did not allow for an accurate determination of . However, the low extinction for (130∘, -7.5∘), suggests that the correction for the higher latitude direction is likely to be negligible.
Figures 9 and 10 both show significant variations in the relative strengths of the lines, especially toward (130∘, -7.5∘). The emission component identified with the superbubble (component 3) has spectral characteristics similar to the W4 H II region immediately surrounding Cas OB6, that is, significantly lower [N II]/H and [S II]/H, and higher [O III]/H than the other components in this direction. On the other hand, toward (133∘, +18∘) the gas associated with the superbubble (component 2), is more WIM-like, with high [N II]/H and [S II]/H and low [O III]/H compared to W4. In the following section, we explore the variations in [N II] and [S II] using the line ratio maps of this region. These maps reveal subtle differences in ionization conditions within the low velocity foreground gas, within the loops and filaments of the more distant superbubble, and between the superbubble and the WIM.
6.2.1 Foreground Emission
This area of the Galaxy is well suited for emission line studies of the diffuse ionized gas because the presence of two well separated velocity components allows one to probe two potentially different environments in the same spectrum. At radial velocities near the LSR, there are several large classical H II regions, as shown in Figure 8 (left panel). The largest of these are Sivan 3 near (145∘, +15∘) associated with the O9.5 Ia star Cam, Sivan 4 near (155∘, -15∘) associated with the O7.5 III star Per, and an H II region near (130∘, -10∘) associated with the B0.5+sdO star Per.
Maps of , [N II]/H, [S II]/H, and [N II]/[S II] for this relatively nearby gas with 15 km s-1 are shown in Figure 11. Many of the pointed observations toward the classical, relatively bright H II regions reported in §4 are in this map. The map of [N II]/H reveals that the faintest regions of H (i.e., the WIM) are “bright” in [N II]/H, with [N II]/H 0.5, while most of the bright H II regions appear dark, with [N II]/H 0.3. The exception is the 15∘ diameter circular region near (130∘, -10∘). This is the Per H II region, which is ionized by a B0.5+sdO binary system (Haffner et al., 1999). The [S II]/H map is similar to the [N II]/H map, suggesting that the [N II]/H and [S II]/H line ratio variations are dominated by temperature changes (see equations 2 and 3). [S II]/H is high, 0.4, in regions of faint H emission and low, 0.2, toward H II regions. The Per H II region is elevated in [S II]/H, relative to the background, but not as much as it is in [N II]/H. This is shown clearly on the map of [S II]/[N II], where the gas associated with classical H II regions is depressed in [S II]/[N II], especially for Per.
As discussed in §2, features on these ratio maps can be interpreted as changes in the physical conditions of the gas, where [N II]/H follows the temperature of the gas and [S II]/[N II] traces S+/S. These maps thus indicate that the faint, diffuse WIM is significantly warmer and in a lower ionization state (more S is in the form of S+) than in the traditional H II regions. The H II region surrounding the B star Per differs from the other H II regions in that it has a significantly higher temperature (i.e., [N II]/H ratio). This may be due to the hard ionization ionizing radiation from its hot sdO companion.
These variations in line ratios are illustrated in Figures 12 and 13. Figure 12 displays the [N II]/H [S II]/H, and [S II]/[N II] measurements in Figure 11 as function of H intensity. Data points with uncertainties greater than 0.1 in the ratio are omitted. Observations toward the large O-star H II regions are shown in blue, while observations within 6∘ of Per are shown in red. The data points with R are all close to the Per H II region near (160∘, -10∘). A few additional points, near (158∘, 0∘), are associated with an unusually large and old planetary nebula S216 (Reynolds, 1985b), and are in green. All other directions (the WIM) are indicated by black data points. The increase in [N II]/H and [S II]/H with decreasing H intensity is apparent, confirming the trend found by Haffner et al. (1999) for a smaller sample of this region of the sky. We also see that [S II]/[N II] in the fainter gas is elevated compared to regions of brighter emission associated with H II regions.
The scatter in the data points is much larger than the measurement errors, implying real variations in the temperature and ionization state of the gas. These variations are displayed more quantitatively in Figure 13, with the same data points and symbols as Figure 12 and with the same scaling and labels as Figure 7. The [N II]/H data suggest that most of emission from the H II regions is relatively cool (6000 K 7000 K), and that the faintest regions of the WIM extend to temperatures . This diagram also suggests that emission from the Per H II region has a similarly high temperature as the WIM, but with a lower S+/S. The large, evolved planetary nebula S216 (green points) has the highest temperature ( 11,000 K) and a low S+/S ( 0.24), consistent with the high photospheric temperature of its ionizing star (Cudworth & Reynolds, 1985; Tweedy & Napiwotzki, 1992).
6.2.2 Perseus Arm Emission
These spectral characteristics of the WIM and the H II regions in the local gas near the LSR can now be compared to those of the Perseus superbubble in the maps. The emission from the Perseus arm (right panel in Figure 8) shows a remarkable bipolar, closed loop structure centered near (135∘, 0∘) that extends almost 30∘ above and below the Galactic plane (i.e., pc). The W4 star-forming region, ionized by the Cas OB6 association, is located at a distance of 2.2 kpc, and is near the center of this structure close to the Galactic plane. Several observational and theoretical studies have suggested that a large ‘chimney’ has been carved out near the Galactic plane, allowing radiation and hot gas to move out into the Galactic halo (Normandeau et al., 1996; Dennison et al., 1997; Basu et al., 1999; Terebey et al., 2003). The H emission from the large arc-shaped feature above the plane at was explored by Reynolds et al. (2001a), who found that the size and shape of this loop is consistent with a sequence of star-forming events over a period of 107 yr that have carved out a 1 kpc-scale cavity in the ISM. They concluded that the ionized hydrogen in the loop, the upper parts of which are more than 1 kpc from the O stars in Cas OB6, appeared to be produced by ionizing radiation escaping the association. Haffner et al. (1999) mapped the lower part of this region (), in [N II] and [S II]. Here we report on new survey observations of this entire region in [N II] and [S II], as well as pointed observations in two directions along the edge of the structure in H, He I, [O III], and [N II].
The H and [N II] and [S II] line ratio maps of this radial velocity interval are shown in Figure 14. The [N II]/H map reveals that regions of higher H intensity have a lower [N II]/H, and that this anti-correlation holds not only for the large scale features but also for the smaller filamentary structures of the superbubble. The faintest areas of H (e.g., the WIM at ) have the highest [N II]/H ( 0.7). Along the loops, [N II]/H is depressed relative to the regions interior and exterior to the loops. Several smaller filaments in the region show the same detailed anti-correlation of [N II]/H and . As expected, the area within about 5∘ of the W4 H II region has the lowest [N II]/H ratios ( 0.4). Because sightlines toward the loops and filaments contain weak foreground and background emission at the same velocity, [N II]/H from the loops and filaments themselves is even more depressed compared to the adjacent regions than these maps suggest. The lower [N II]/H ratios in the filamentary structures, particularly in the brighter H regions south of the plane where contamination by the fainter WIM along the line of sight is negligible, provides strong evidence that these filaments are not enhancements resulting from folds and edge projections of the ionized outer skin of the superbubble but instead are regions of cooler temperature. Furthermore, the generally lower [N II]/H within the entire superbubble compared to that in the more diffuse WIM at , for example, implies that the WIM cannot be explained entirely by the superposition of regions like the Perseus superbubble.
In the [S II]/H map the contrast between the filaments and the background is not as high. Since the line ratio [S II]/H is a combination of temperature and ionization effects, this decrease in contrast may be due to changes in the ionization fraction of S+/S that ‘wash out’ the temperature effects we see in the [N II]/H map. This is further evidence that the H enhanced filaments and loops are not simply due to geometrical projection effects of an ionized shell and that the ionizations conditions (S+/S) within the superbubble differ from that in the WIM.
Quantitative comparisons between the W4 H II region, the superbubble, and the diffuse WIM outside the boundary of the superbubble are shown in Figures 15 and 16. Data points with uncertainties larger than 0.1 in the ratio are not shown. Observations within 1.5∘ of spectroscopically confirmed members of the Cas OB6 association are shown in green, sightlines through the superbubble, defined as all points with , are shown in red, and the WIM, defined as all points with , are in blue. In general we see that [N II]/H is higher in the diffuse background where is lower. We also see that the brighter regions near W4 have line ratios close to that of the average H II region, while the superbubble tends to have [N II]/H ratios closer to that of the nearby WIM, but weighted to somewhat lower values.
We note one caveat about our analysis of the complicated component structure toward these lines of sight. The method we used to calculate the line strengths, integrating the profiles over fixed velocity intervals, is not ideal for exploring the full range of physical conditions that may be present in the ionized gas in these maps. Most of the spectra in this part of the Galaxy have two components centered near 0 km s-1 and km s-1 (LSR) with line widths of km s-1. However, some spectra have profiles that peak at somewhat different velocities. This is especially true in the region near the southern loop with . Spectra separated by only 1∘ in this area show variations in the component strengths by a factor of 2 and shifts in the velocity centroids of 10 km s-1 or more. Therefore, in some cases a map that covers a fixed radial velocity interval may sample the entire emission component in one part of the map, but only the wing of that component in another part of the map. This complicates the interpretation of the line ratios. A detailed examination of the emission, including a study of the dynamics of the gas, would require Gaussian fits to all of the components in all of the approximately 2400 spectra, which is beyond the scope of this work. Our focus here is limited to the general trends that appear among spatially coherent features in these maps, which are insensitive to these kinematic variations.
6.2.3 The Perseus Superbubble and the WIM
Compared to the smaller and brighter Orion-Eridanus bubble, the Perseus superbubble is clearly more WIM-like. Compare, for example, the distribution of blue points in Figures 6 and 7 (Orion-Eridanus bubble) with the blue points in the corresponding Figures 15 and 16 (Perseus superbubble). Because the surface brightness of the Perseus superbubble is not much brighter than that of the WIM, particularly far from the Galactic plane, searching for a trend in the line ratios with distance from Cas OB6 is problematic. However, a comparison of the background subtracted pointed observation toward (130∘, ∘), which is 10∘ ( 350 pc) from Cas OB6, with that toward (133∘, ∘), which is 17∘ ( 700 pc) from Cas OB6, indicates that the gas in the latter direction is more WIM-like (i.e., higher [N II], [S II]/H and lower [O III]/H) than in the former (see Table 4). Nevertheless, even the most distant parts of the superbubble are still clearly distinguishable from the background WIM, indicating that although this structure does have ratios similar to the WIM in some regions of the sky (e.g., outside the Orion-Eridanus bubble at ), there is still a significant difference (which we interpret primarily as a temperature difference) between this superbubble and the adjacent WIM.
7 HIGH LATITUDE FILAMENTS
There are other regions of the sky that exhibit H enhancements with no identified O stars or O associations as their source of ionization. Many of these are high Galactic latitude filamentary structures that have no visible connection to a superbubble. The emission characteristics of four such regions are examined in detail in this section to determine where they fit empirically with respect to the classical H II regions, superbubbles, and the more diffuse WIM.
7.1 The Northern Filaments
A remarkable, , H filament rises vertically more than 50∘ from the Galactic plane near longitude . As shown in Figure 17, another filament, about 30∘ long, traverses this longer filament at a right angle near latitude. We refer to these as the ‘northern filaments’ to distinguish them from a comparably sized feature on the WHAM survey map near that extends south of the Galactic plane from to . (This ‘southern filament’ was not included in this study because of the complex kinematics of the gas toward and near the filament.) Haffner et al. (1998) examined the region of the northern filaments and found no correspondence of the H emission with observational tracers of any other phases of the interstellar medium. A radial velocity gradient along the length of the vertical filament, from km s-1 near the midplane to km s-1 at the highest latitude, suggests that it is a coherent strand of gas and not simply an enhancement resulting from an increase in geometrical path through the edge of a very low surface brightness shell. They also noted that the lower parts of the filament are at the same longitude as the H II region S292 surrounding the CMa OB 1 association in the Galactic plane, and that the emission from this part of the filament appears at the same radial velocity as the H II region. If the long filament is at the same distance as the OB association ( 1 kpc), then it reaches a vertical height of 1.2 kpc above the plane and has a density near 0.3 cm-3. Haffner et al. (1998) suggest that the diffuse ionized gas in these filaments is not likely to be material that has been ejected from the star-forming region below it. Instead, they argue that the relatively constant H surface brightness along the filament suggests that it is ionized by ambient Lyman continuum radiation.
We obtained spectra of [N II], [S II], [O III], and He I with pointed observations along and near these two filaments. A summary of the results appears in the top ten rows of Table 5. The columns are similar to those in Table 3, except that column 4 is the angular distance of each observation from the S292 H II region near the Galactic midplane. The labels A-F in Figure 17 show the location of the observations listed in the table, and are sorted by increasing distance from S292. The three ‘X’ labels show the location of OFF directions used to remove atmospheric lines and emission from the diffuse background. The removal of the background emission was particularly important for these observations, because the background ( R) is only slightly fainter than the total intensity toward the filamentary structures ( R). The background emission was removed from the pointed observations by choosing the closest of the three OFF directions. However, there is a variation in the strength of the H emission among each of the OFFs, with = R. To assess the impact of this variation on our results, two different background directions were subtracted from the three observations A, B and E. This is reflected in the multiple entries for these observations in Table 5. A graphical summary of our results is shown in Figure 18, which is similar to Figure 4. The open symbols represent the two results obtained by subtracting two different OFF directions from the same pointed observation and thus provide a measure of the uncertainty resulting from the background subtraction. None of the data were corrected for extinction. However, the upward arrows on the data points for the H II region S292 show the shift in these data points if a correction for a visual absorption of is applied to the H II region (see §4) All other data points have shifts smaller than the symbol size.
Observations at A, B, E, and F along the vertical filament show that the H surface brightness of this filament is nearly constant and independent of distance from the midplane, as first noted by Haffner et al. (1998). [N II]/H also shows little systematic variation ( 0.4 - 0.5) along the filament’s length, except for a somewhat elevated value of 0.6 toward direction B. [N II]/H is significantly higher than the average (0.27) for H II regions and similar to what is observed in the diffuse WIM. Similarly, we find that [S II]/H () is significantly higher than the H II regions () and comparable to parts of the WIM. [S II]/[N II] () has significant variations, but is within the scatter of values seen in the WIM and has no trend with distance from the plane. Directions C, D, and E, which sample the cross filament were found to have spectral characteristics similar to those of the vertical filament at the same latitude (Table 5).
In contrast to the other emission lines, [O III]/H shows a very strong trend with distance, with [O III]/H near the midplane, where its value is the same as that toward the H II region S292, falling to 0.025 at B, 24∘( 400 pc) above the midplane, and dropping to values below or at 0.01 for the two highest latitude directions. This implies that O++/O 0.1 at pc, 0.04 at 400 pc, and 0.02 above 700 pc. This is contrasted with the generally observed behavior of [O III] in external galaxies, where the [O III]/H ratios are much higher ( 0.2) and in some cases increase with distance above the plane (Collins & Rand, 2001; Miller & Veilleux, 2003). If the filament is photoionized and its temperature is not changing with height above the plane, as the constant [N II]/H suggests, then these [O III]/H data suggest that an already low flux of photons having 35 eV rapidly diminishes with increasing height above the plane. The He I/H ratio for direction B, while quite uncertain, implies that there are a significant number of He-ionizing photons ( eV) at pc, with He+/He 0.6 0.2. This is higher than what is seen for many H II regions, and implies that the ionizing radiation field at this location has a spectrum that is similar to an O7 star or earlier.
7.2 Observations Toward The High Latitude Arc
We also investigated a much shorter filamentary feature, a 3∘ long arc of H emission located near = (171∘, +57∘) about ∘ away from the faintest directions in the sky in both H and H I (Hausen et al., 2002b; Lockman et al., 1986). A WHAM H sky survey map of the region surrounding this arc is shown in Figure 19. The arc, visible in the top, panel, has an H intensity of about 1 R ( 3 cm-6 pc), approximately 3-4 times brighter than the surrounding H background. The location of the pointed observations is indicated by a circle (the 1∘ WHAM beam is much smaller than this circle). The location of the OFF direction is denoted by an ‘X’.
The H spectrum in the direction of this arc actually consists of two emission components, one associated with the arc at 0 km s-1, and another at km s-1. The lower panel of Figure 19 shows the same piece of sky, but for the velocity interval . Fortuitously, the line of sight through the arc also passes through a faint portion of an intermediate-velocity H I cloud (IVC) known as the IV Arch located approximately pc above the Galactic midplane (Wakker, 2001; Kuntz & Danly, 1996). The brightest H I emission from the IV Arch is across the top of the map near , where its associated H emission is also relatively bright. In H, the IV Arch is typically wide and extends more than 60∘ across the northern Galactic hemisphere. A small section of the IV Arch extends down away from the main section and passes through the direction of the lower velocity high-latitude H arc. The H intensity of the IV Arch in this direction is approximately 0.1 R, making it the faintest H emission structure in this study, with a density of cm-3.
We have observed emission lines of H, [N II], [S II], He I, and [O III] and measured the line strengths for these two velocity components. A summary of the observations appears in the bottom two rows of Table 5.
7.2.1 The Arc
The low velocity arc has [N II]/H = 0.72 and [S II]/[N II] = 0.65, which are comparable to some of the highest values observed in the WIM. The detection of [N II] confirms that these high ratios are primarily a result of an elevated temperature in the gas (see §8). The relatively low [O III]/H ( 0.06) is also consistent with the WIM. However, He I/H () is the highest ratio among all the observations in this study including the classical H II regions. Together, these line ratios suggest that this arc is ionized by a hard radiation source with a low flux that is local to the arc. The very high He I/H ratio is not seen elsewhere in the WIM, and indicate the arc is not a density enhancement ionized only by the diffuse interstellar radiation field. The He I data imply the presence of a hard ionizing spectrum.
A search for a potential ionizing source yielded one candidate, the DA white dwarf WD1026+453. This star has a visual magnitude and is near the arc at (170.92∘, +56.60∘). It is the only spectroscopically confirmed hot star that lies within the arc (in projection) and within the field of view of the pointed observations discussed above. Ultraviolet spectroscopy suggests that the temperature of the star is 35,000 K and that it is at a distance of 200 pc (Vennes et al., 1997). It has also been detected in extreme ultraviolet by ROSAT and EUVE (Pye et al., 1995; Bowyer et al., 1996). H I emission line maps in this region show a slight enhancement in 21 cm line emission at the velocities of the ionized gas on the lower right side of the arc. If we adopt the above distance, the emission measure suggests the density of the gas in the arc is approximately 0.9 cm-3.
The identification of WD1026+453 as the potential ionizing source for the arc raises the question about the contribution from hot evolved stellar cores to the diffuse ionizing radiation field above the Galactic disk. The high He I/H for this region suggests that a future, more comprehensive study of He I emission at high latitudes could provide insights about the role of such stars. On the other hand, the rapid decrease in [O III]/H with latitude along the vertical northern filament strongly suggests that the radiation field, at least in that part of the Galaxy, actually softens with distance from the midplane.
7.2.2 The IV Arch
The detections of [N II] and [S II] in the km s-1 component are the first detections of these diagnostic emission lines from the IV Arch. No corresponding [O III] and He I emission were detected. The very high value of [S II]/[N II] () is unique. We caution that because the H emission in this component is only 0.1 R, the uncertainty in this result is substantial. However, at the 1 limits, for both [N II]/H and [S II]/H, [S II]/[N II] 1.0. These ratios suggest that the temperature of the emitting gas is about 7000 K and that almost all of the S is singly ionized, with S+/S . The abundances that we use to infer these physical conditions (§2) are supported by UV absorption lines studies (Wakker, 2001), which show that the IV Arch has a gas phase abundances similar to that in the local ISM. The ionization state could be unusually low due to the weak flux of ionizing radiation (and thus low ionization parameter) inferred from its very low H surface brightness (0.1 R).
In summary, the northern filaments, the high latitude arc, and the IV Arch are all characterized by high [N II]/H and [S II]/H ratios that are not unlike the ratios observed in the more diffuse WIM.
8 OBSERVATIONS OF [N II]
Many observations show that in faint, diffuse emission regions, the ratio [N II]/H, tends to be significantly larger than in classical H II regions and increases with decreasing H surface brightness. This is a general result that is commonly observed in the Galaxy (e.g., Haffner et al., 1999) as well as in external galaxies (e.g., Collins & Rand, 2001). The interpretation is that ionized gas at lower densities (specifically at n cm-3) is at higher temperatures. Furthermore, this increase in temperature may be beyond what can be attributed to photoionization alone (Reynolds et al., 1999; Wood & Mathis, 2004; Elwert & Dettmar, 2005), which has important implications for the role of other heating processes that may be operating in the WIM. However, the [N II]/H line ratio is a function of several physical parameters, not just temperature. Therefore it is important to test this interpretation of elevated temperatures using other observational information.
As discussed in §2, the ratio [N II]/[N II] provides a direct measure of the electron temperature of the emitting gas. Here we describe our observations of these lines toward a collection of classical O star H II regions as well as sightlines that sample the diffuse WIM. Table 6 summarizes the observations. The first 11 rows show the data for the H II regions, including the five H II regions reported earlier by Reynolds et al. (2001b). The last 6 rows show the data obtained for sightlines that sample the much fainter diffuse ionized medium. One WIM sightline, (130∘, ∘), was reported previously by Reynolds et al. (2001b). For some directions, [N II] was not detected, and only upper limits to the line ratio of [N II]/[N II] are given, as described in §3.3. The temperatures inferred by these line ratios appear in the last two two columns on the right. is the temperature suggested by the [N II]/H ratio; is the temperature inferred from the [N II]/[N II] observations.
These results are shown in Figure 20, where [N II]/[N II] is plotted against [N II]/H. Data for the H II regions have blue symbols and the WIM red symbols. Upper limits to the line ratios are indicated by arrows. The solid black line is the locus of expected ratios of these lines from equations 2 and 4. The dashed lines show the predicted ratios for temperatures between 5000 and 10000 K. For the three WIM sightlines in which [N II] is detected, both of the line ratios are significantly higher than those for classical O star H II regions. This provides convincing confirmation that 1) the WIM is approximately K warmer than classical O star H II regions, and 2) higher [N II]/H intensity ratios are due at least in large part to higher temperatures.
The data points tend to lie preferentially above the expected relationship (solid line). This could be explained if N+/N in the WIM were significantly lower than the assumed value of 0.8. A ratio of N+/N = 0.6 would bring the two temperature diagnostics into average agreement with one another. However, both photoionization modeling (Sembach et al., 2000) and observations of elevated [S II]/H ratios suggest that the WIM, and in particular the WIM nitrogen, is not highly ionized. Another reason could be that the gas phase abundance of nitrogen in the WIM is lower than in the H II regions by a factor of 2, which also seems improbable. The most likely explanation is that there is a range of temperatures in the WIM (Reynolds et al., 2001b), as is indicated by the large scatter in [N II]/H (e.g., Figure 21b). The metastable level of the [N II] line lies higher above ground (about 4 eV) than that of the [N II] line (about 2 eV), which means that [N II] is preferentially produced in regions of higher temperature along the line of sight. The deviation of the points from the solid line can be explained with an appropriate (non-unique) range of temperatures (Reynolds et al., 2001b). The conclusion that variations in [N II]/H trace variations in temperature has also been confirmed by the recent detection and study of [O II] 3727 emission from the WIM (Mierkiewicz et al., 2004).
9 SUMMARY AND CONCLUSIONS
We have presented a large number of new observations of several optical emission lines toward H-emitting features in the Galaxy that span a wide range in surface brightness, angular scale, environment, and morphology. We have explored the relative intensities of these emission lines to infer the physical conditions of the emitting gas, and we have compared these conditions with those of traditional, O star H II regions in an attempt to gain insight into the nature of the WIM and its relationship to hot stars and large-scale bubbles and filaments within the interstellar medium. We found significant variations in the temperature and ionization state among these emission features, revealing that warm ionized gas is heterogeneous in nature. We have strengthened the general assertion that the WIM is warmer and less ionized compared to classical H II regions and found significant variations in temperature and ionization state within the diffuse WIM.
An overview of some of these observations is presented in Figure 21, which shows the diagnostic plots of [N II]/H vs. [S II]/H for various emission regions observed in pointed and survey mode. The dashed vertical and solid sloped lines represent lines of constant temperature and constant S+/S, respectively, and have the same values as in Figures 7, 13, and 16. The range of physical conditions is indicated by the different distributions and by the scatter in the data points. Different types of emission regions occupy different areas of the diagram, and even within a given catagory of emission region, variations can be significant. The classical O star H II regions (except for the two regions ionized by hot stellar cores) show the least variation (Figure 21a), with temperatures between 6000 K and 7000 K and S+/S . In contrast, the faint diffuse WIM (Fig. 21b) has the most variation; that is, it occupies the largest area, with temperatures ranging between 7000 K and 10,000 K and S+/S ranging from about 0.1 to 1. Figure 21b also shows that the mean properties of the WIM can be slightly different in different regions of the Galaxy. For example, in the Perseus arm S+/S in the WIM has an average near 0.25, while in the more nearby gas toward that direction, its average is near 0.6.
From this study, we make the following closing statements:
1. The temperature of diffuse ionized gas is higher in regions of
lower
emission measure. This is implied by the elevated [N II]/H and
[S II]/H ratios toward the relatively faint Perseus
superbubble, high latitude filaments, and diffuse background WIM,
compared to the relatively bright Orion-Eridanus bubble and the even
brighter O star H II regions. The relation between
temperature (traced by [N II]/H) and H intensity also holds within
the diffuse WIM itself (e.g., Figures 6,
12, and 15).
The elevated temperatures in the WIM are confirmed by the
[N II]/[N II] intensity ratios
(Figure 20) and recent observations of [O II]
(Mierkiewicz et al., 2004).
2. The ionization state in diffuse ionized gas is generally lower than that in
classical H II regions.
Several new observations of [O III] and He I indicate that, in general,
the fraction of O++/O and He+/He in the WIM and in the
large bubble structures is low compared to
H II regions, implying a lower ionization state due to a softer
ionizing
radiation field and probably a lower ionization parameter (e.g.,
Figures 10 and 18).
The high ionization of sulfur (i.e., the low values of S+/S) in the WIM of the Perseus arm (Figs. 15, 16, 21b) appears to be an exception to this trend.
The data also suggest that the diffuse low density gas close
to the Galactic plane may be more highly ionized than gas at larger
distances from the plane. In the inner Galaxy, this trend appears to
reverse (Madsen & Reynolds, 2005).
3. Conditions within the WIM vary significantly. The mean
temperature and ionization state can change considerably from one
sight line to the next and even along a single sight line. Moreover,
the mean properties of the WIM change from one
region of the Galaxy to another (e.g., see Fig. 21b).
Within the WIM, values of T and S+/S extend to significantly
higher values than are found within classical H II regions or even
the extended bubbles.
4. High latitude filaments superposed on the faint WIM
have spectral characteristics similar to the WIM. This suggest a
close relationship between these high latitude structures and the more
diffuse background.
5. The Perseus superbubble provides strong evidence that a luminous
O star cluster near the midplane can produce wide-spread, nearly
WIM-like ionization conditions to distances of 1000 pc or more from the ionizing stars.
This superbubble has spectral
characteristics similar to those
observed in portions of the diffuse WIM (Figs. 21b
and d) and quite
different from the spectral characteristics of the bright H II region
that
immediately surrounds its source of ionization, the Cas OB6 star
cluster and other classical H II regions (Fig. 21a
and d;
Table 2). The fact that the smaller, brighter,
denser
Orion-Eridanus bubble has low [N II]/H ratios, similar to those in
classical H II regions, implies that bubble size, gas density within
the ionized shell, and/or the flux and spectrum of the radiation
escaping
O star clusters may be important in setting the conditions
within the ionized gas. For example, the presence of an extra source of
non-ionizing heat can raise the gas temperature in low density
( cm-3)
ionized gas (Reynolds et al., 1999), which could account for the elevated, more
WIM-like temperatures in the low density Perseus superbubble, as
well as the more general relationship between temperature and
emission measure (point 1 above).
6. Filamentary structures within the Perseus superbubble have
physical conditions that
differ from conditions
in the fainter, more diffuse parts of the bubble. This implies
that these
filaments are discrete entities, likely regions of higher density,
and not just directions of increased
pathlength through folds or edge
projections of a shell or sheet. The slightly depressed [N II]/H and
[S II]/H ratios in these filaments, compared to the fainter
superbubble emission adjacent to them,
suggest that they are in fact cooler than the gas along adjacent
sightlines through the superbubble.
In conclusion, we believe that high spectral resolution emission line observations at visible wavelengths open a new window on the study of interstellar matter and processes not available through other techniques at other wavelengths. In particular, the application of nebular line diagnostics to the study of the warm ionized component of the interstellar medium provides an opportunity to understand better, through both observations and modelling, the large-scale effects of hot stars on the ionization and morphology of the interstellar medium within the Galaxy’s disk and halo.
10 ACKNOWLEDGEMENTS
We gratefully acknowledge the anonymous referee for a thorough review which improved the paper. We thank Kurt Jaehnig for his outstanding technical support in the continuing operation of the WHAM instrument. This work was funded by the National Science Foundation through grants AST-0204973 and AST-0401416. GJM acknowledges additional support from the Wisconsin Space Grant Consortium. This research has made use of the SIMBAD database, operated at CDS, Strasbourg, France.
Facilities: WHAM ()
References
- Anders & Grevesse (1989) Anders, E., & Grevesse, N. 1989, Geochim. Cosmochim. Acta, 53, 197
- Basu et al. (1999) Basu, S., Johnstone, D., & Martin, P. G. 1999, ApJ, 516, 843
- Bowyer et al. (1996) Bowyer, S., Lampton, M., Lewis, J., Wu, X., Jelinsky, P., & Malina, R. F. 1996, ApJS, 102, 129
- Brown et al. (1995) Brown, A. G. A., Hartmann, D., & Burton, W. B. 1995, A&A, 300, 903
- Burrows et al. (1993) Burrows, D. N., Singh, K. P., Nousek, J. A., Garmire, G. P., & Good, J. 1993, ApJ, 406, 97
- Cambrésy et al. (2002) Cambrésy, L., Beichman, C. A., Jarrett, T. H., & Cutri, R. M. 2002, AJ, 123, 2559
- Cardelli et al. (1989) Cardelli, J. A., Clayton, G. C., & Mathis, J. S. 1989, ApJ, 345, 245
- Clariá (1974) Clariá, J. J. 1974, A&A, 37, 229
- Collins & Rand (2001) Collins, J. A., & Rand, R. J. 2001, ApJ, 551, 57
- Cox (1989) Cox, D. P. 1989, in IAU Colloq. 120: Structure and Dynamics of the Interstellar Medium, 500
- Cudworth & Reynolds (1985) Cudworth, K., & Reynolds, R. J. 1985, PASP, 97, 175
- Dennison et al. (1997) Dennison, B., Topasna, G. A., & Simonetti, J. H. 1997, ApJ, 474, L31
- Dettmar (1992) Dettmar, R. J. 1992, Fundamentals of Cosmic Physics, 15, 143
- Dove & Shull (1994) Dove, J. B., & Shull, J. M. 1994, ApJ, 430, 222
- Dove et al. (2000) Dove, J. B., Shull, J. M., & Ferrara, A. 2000, ApJ, 531, 846
- Elwert & Dettmar (2005) Elwert, T., & Dettmar, R.-J. 2005, in ASP Conf. Ser. 331: Extra-Planar Gas, 203
- Ferguson et al. (1996) Ferguson, A. M. N., Wyse, R. F. G., Gallagher, J. S., & Hunter, D. A. 1996, AJ, 111, 2265
- Gallagher et al. (2003) Gallagher, J. S., Madsen, G. J., Reynolds, R. J., Grebel, E. K., & Smecker-Hane, T. A. 2003, ApJ, 588, 326
- Haffner (2001) Haffner, L. M. 2001, in ASP Conf. Ser. 231, Tetons 4: Galactic Structure, Stars and the Interstellar Medium, ed. C. E. Woodward, M. D. Bicay, & J. M. Shull (San Francisco: ASP), 345
- Haffner et al. (1998) Haffner, L. M., Reynolds, R. J., & Tufte, S. L. 1998, ApJ, 501, L83
- Haffner et al. (1999) —. 1999, ApJ, 523, 223
- Haffner et al. (2003) Haffner, L. M., Reynolds, R. J., Tufte, S. L., Madsen, G. J., Jaehnig, K. P., & Percival, J. W. 2003, ApJS, 149, 405
- Hartmann & Burton (1997) Hartmann, D., & Burton, W. B. 1997, Atlas of Galactic Neutral Hydrogen (Cambridge; New York: Cambridge University Press)
- Hausen et al. (2002a) Hausen, N. R., Reynolds, R. J., & Haffner, L. M. 2002a, AJ, 124, 3336
- Hausen et al. (2002b) Hausen, N. R., Reynolds, R. J., Haffner, L. M., & Tufte, S. L. 2002b, ApJ, 565, 1060
- Heiles (1984) Heiles, C. 1984, ApJS, 55, 585
- Hewett et al. (2003) Hewett, P. C., Irwin, M. J., Skillman, E. D., Foltz, C. B., Willis, J. P., Warren, S. J., & Walton, N. A. 2003, ApJ, 599, L37
- Hummer & Storey (1987) Hummer, D. G., & Storey, P. J. 1987, MNRAS, 224, 801
- Hunter & Gallagher (1990) Hunter, D. A., & Gallagher, J. S. 1990, ApJ, 362, 480
- Kulkarni & Heiles (1987) Kulkarni, S. R., & Heiles, C. 1987, in ASSL Vol. 134: Interstellar Processes, 87–122
- Kuntz & Danly (1996) Kuntz, K. D., & Danly, L. 1996, ApJ, 457, 703
- Lockman et al. (1986) Lockman, F. J., Jahoda, K., & McCammon, D. 1986, ApJ, 302, 432
- Madsen (2004) Madsen, G. J. 2004, PhD thesis, University of Wisconsin–Madison
- Madsen & Reynolds (2005) Madsen, G. J., & Reynolds, R. J. 2005, ApJ, 630, 925
- Madsen et al. (2001) Madsen, G. J., Reynolds, R. J., Haffner, L. M., Tufte, S. L., & Maloney, P. R. 2001, ApJ, 560, L135
- Maíz-Apellániz et al. (2004) Maíz-Apellániz, J., Walborn, N. R., Galué, H. Á., & Wei, L. H. 2004, ApJS, 151, 103
- Martins et al. (2005) Martins, F., Schaerer, D., & Hillier, D. J. 2005, A&A, 436, 1049
- Mathis (2000) Mathis, J. S. 2000, ApJ, 544, 347
- Meyer et al. (1997) Meyer, D. M., Cardelli, J. A., & Sofia, U. J. 1997, ApJ, 490, L103
- Meyer et al. (1998) Meyer, D. M., Jura, M., & Cardelli, J. A. 1998, ApJ, 493, 222
- Mierkiewicz et al. (2004) Mierkiewicz, E. J., Roesler, F. L., Harlander, J. M., Reynolds, R. J., & Jaehnig, K. P. 2004, in Ground-based Instrumentation for Astronomy. Edited by Alan F. M. Moorwood and Iye Masanori. Proceedings of the SPIE, Volume 5492, pp. 751-766 (2004)., 751–766
- Miller & Cox (1993) Miller, W. W., I., & Cox, D. P. 1993, ApJ, 417, 579
- Miller & Veilleux (2003) Miller, S. T., & Veilleux, S. 2003, ApJ, 592, 79
- Nordgren et al. (1992) Nordgren, T. E., Cordes, J. M., & Terzian, Y. 1992, AJ, 104, 1465
- Norman (1991) Norman, C. A. 1991, in IAU Symp. 144, The Interstellar Disk-Halo Connection in Galaxies, ed. H. Bloemen (Dordrecht: Kluwer), 337–344
- Normandeau et al. (1996) Normandeau, M., Taylor, A. R., & Dewdney, P. E. 1996, Nature, 380, 687
- Osterbrock (1989) Osterbrock, D. E. 1989, Astrophysics of gaseous nebulae and active galactic nuclei (Mill Valley, CA: University Science Books)
- Otte et al. (2002) Otte, B., Gallagher, J. S., & Reynolds, R. J. 2002, ApJ, 572, 823
- Perryman et al. (1997) Perryman, M. A. C., Lindegren, L., Kovalevsky, J., Hoeg, E., Bastian, U., Bernacca, P. L., Crézé, M., Donati, F., Grenon, M., van Leeuwen, F., van der Marel, H., Mignard, F., Murray, C. A., Le Poole, R. S., Schrijver, H., Turon, C., Arenou, F., Froeschlé, M., & Petersen, C. S. 1997, A&A, 323, L49
- Pye et al. (1995) Pye, J. P., McGale, P. A., Allan, D. J., Barber, C. R., Bertram, D., Denby, M., Page, C. G., Ricketts, M. J., Stewart, B. C., & West, R. G. 1995, MNRAS, 274, 1165
- Rand (1997) Rand, R. J. 1997, ApJ, 474, 129
- Rand (1998) —. 1998, ApJ, 501, 137
- Rand et al. (1990) Rand, R. J., Kulkarni, S. R., & Hester, J. J. 1990, ApJ, 352, L1
- Rauch et al. (2004) Rauch, T., Kerber, F., & Pauli, E.-M. 2004, A&A, 417, 647
- Reynolds (1985a) Reynolds, R. J. 1985a, ApJ, 298, L27
- Reynolds (1985b) —. 1985b, ApJ, 288, 622
- Reynolds (1991a) Reynolds, R. J. 1991a, in IAU Symp. 144: The Interstellar Disk-Halo Connection in Galaxies, 67–76
- Reynolds (1991b) —. 1991b, ApJ, 372, L17
- Reynolds (1992) —. 1992, ApJ, 392, L35
- Reynolds et al. (2005) Reynolds, R. J., Chaudhary, V., Madsen, G. J., & Haffner, L. M. 2005, AJ, 129, 927
- Reynolds et al. (1999) Reynolds, R. J., Haffner, L. M., & Tufte, S. L. 1999, ApJ, 525, L21
- Reynolds et al. (1998) Reynolds, R. J., Hausen, N. R., Tufte, S. L., & Haffner, L. M. 1998, ApJ, 494, L99
- Reynolds & Ogden (1979) Reynolds, R. J., & Ogden, P. M. 1979, ApJ, 229, 942
- Reynolds et al. (2001a) Reynolds, R. J., Sterling, N. C., & Haffner, L. M. 2001a, ApJ, 558, L101
- Reynolds et al. (2001b) Reynolds, R. J., Sterling, N. C., Haffner, L. M., & Tufte, S. L. 2001b, ApJ, 548, L221
- Reynolds & Tufte (1995) Reynolds, R. J., & Tufte, S. L. 1995, ApJ, 439, L17
- Rossa & Dettmar (2000) Rossa, J., & Dettmar, R.-J. 2000, A&A, 359, 433
- Scherb (1981) Scherb, F. 1981, ApJ, 243, 644
- Sembach et al. (2000) Sembach, K. R., Howk, J. C., Ryans, R. S. I., & Keenan, F. P. 2000, ApJ, 528, 310
- Sharpless (1959) Sharpless, S. 1959, ApJS, 4, 257
- Sivan (1974) Sivan, J. P. 1974, A&AS, 16, 163
- Taylor & Cordes (1993) Taylor, J. H., & Cordes, J. M. 1993, ApJ, 411, 674
- Terebey et al. (2003) Terebey, S., Fich, M., Taylor, R., Cao, Y., & Hancock, T. 2003, ApJ, 590, 906
- Tufte (1997) Tufte, S. L. 1997, PhD thesis, University of Wisconsin–Madison
- Tweedy & Napiwotzki (1992) Tweedy, R. W., & Napiwotzki, R. 1992, MNRAS, 259, 315
- Vacca et al. (1996) Vacca, W. D., Garmany, C. D., & Shull, J. M. 1996, ApJ, 460, 914
- Vennes et al. (1997) Vennes, S., Thejll, P. A., Galvan, R. G., & Dupuis, J. 1997, ApJ, 480, 714
- Wakker (2001) Wakker, B. P. 2001, ApJS, 136, 463
- Walterbos & Braun (1994) Walterbos, R. A. M., & Braun, R. 1994, ApJ, 431, 156
- Westerhout (1958) Westerhout, G. 1958, Bull. Astron. Inst. Netherlands, 14, 215
- Witt & Lillie (1978) Witt, A. N., & Lillie, C. F. 1978, ApJ, 222, 909
- Wood & Mathis (2004) Wood, K., & Mathis, J. S. 2004, MNRAS, 353, 1126
- York & Rogerson (1976) York, D. G., & Rogerson, J. B. 1976, ApJ, 203, 378
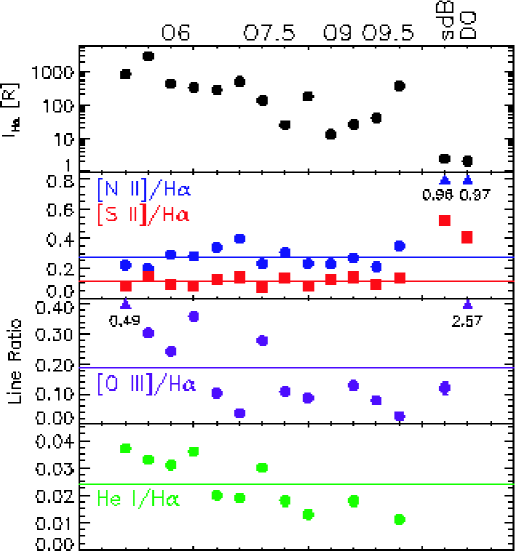
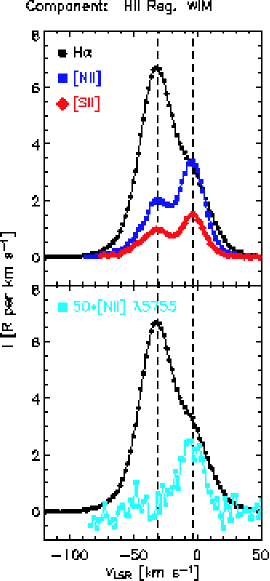
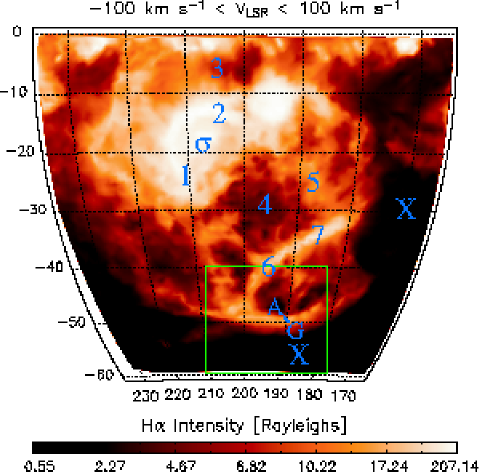
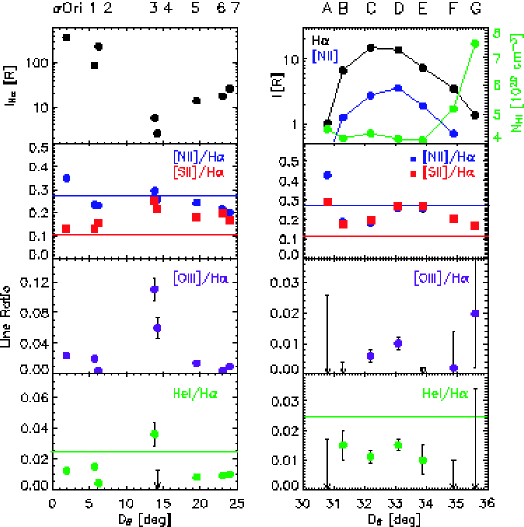
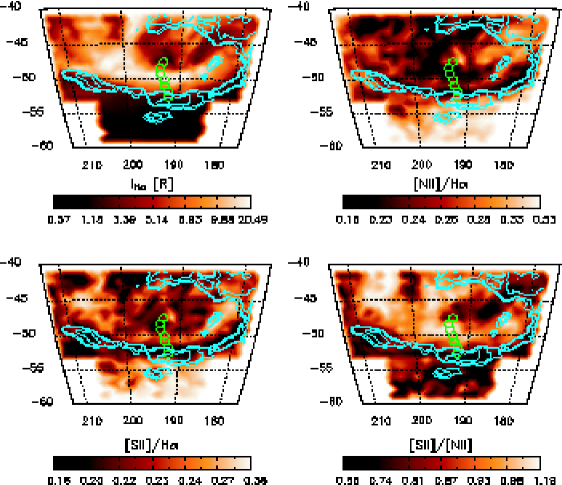
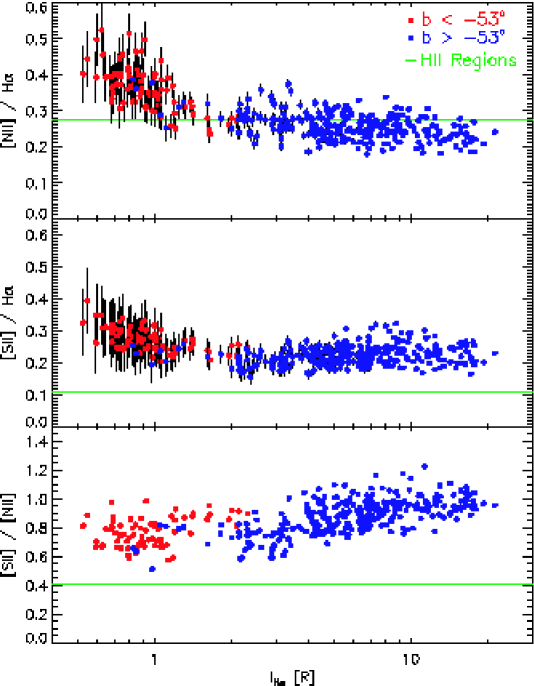
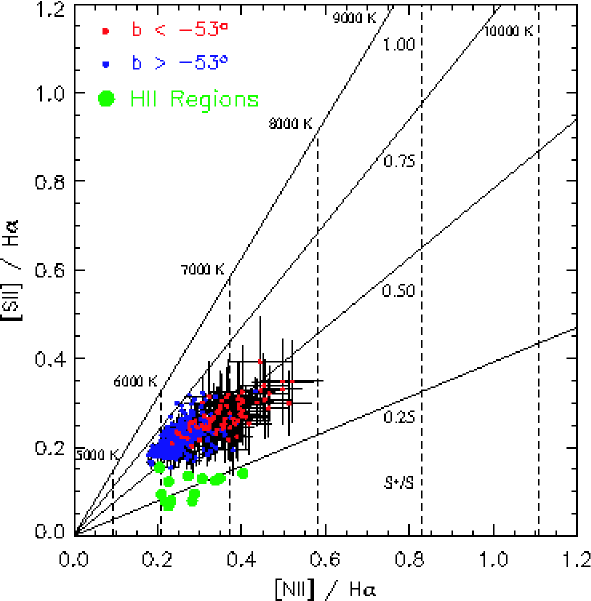
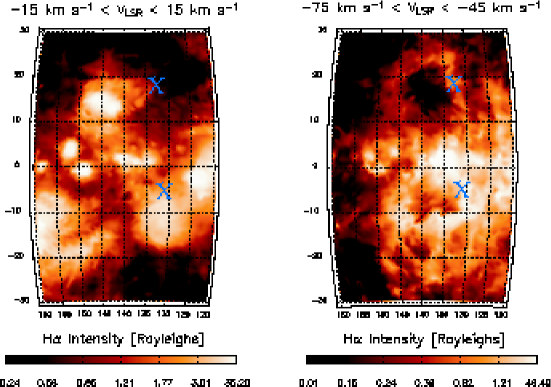

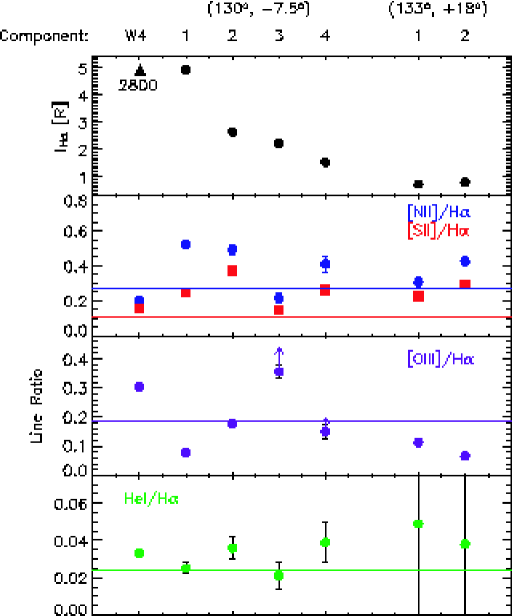
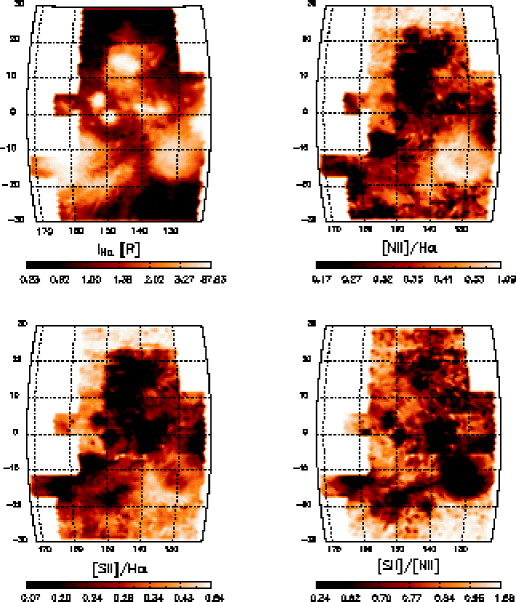
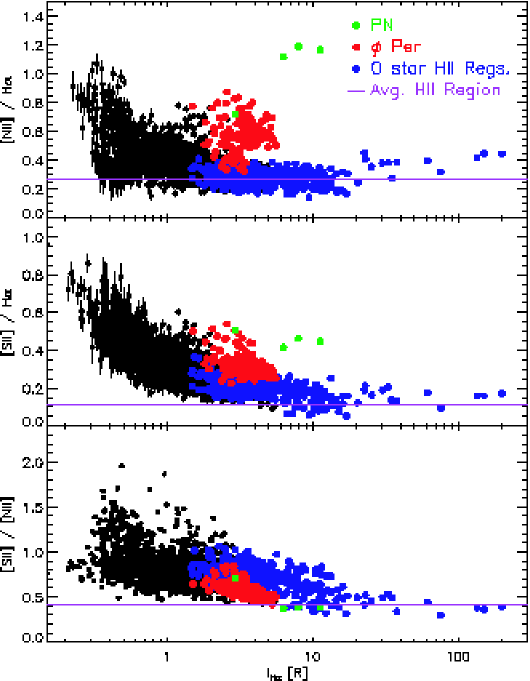
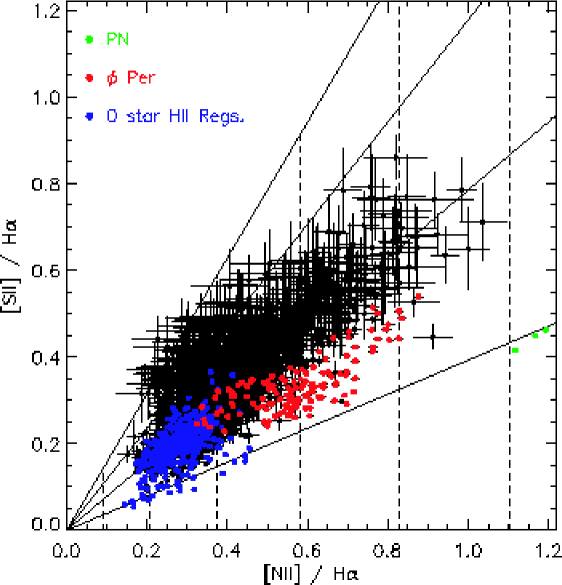
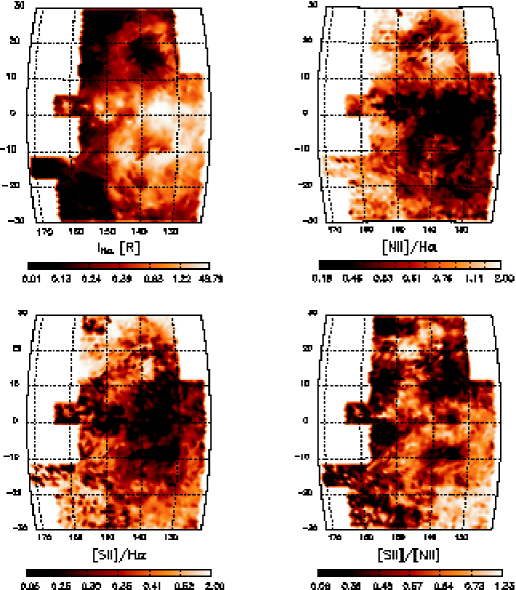
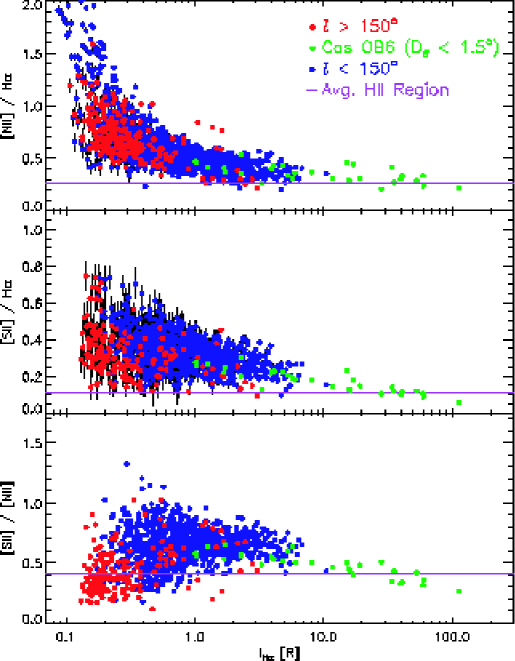
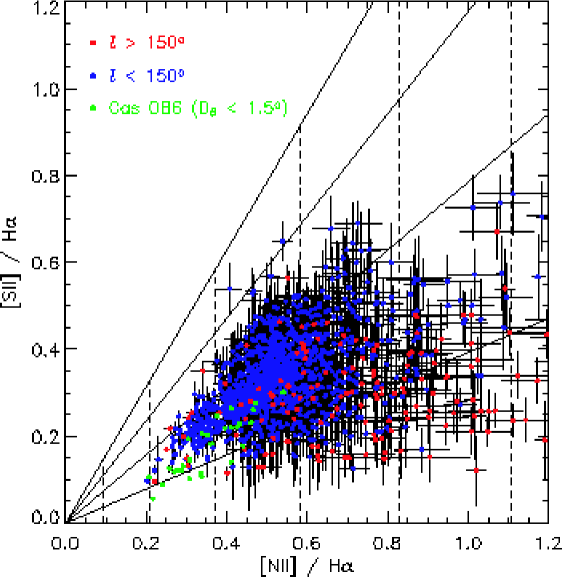
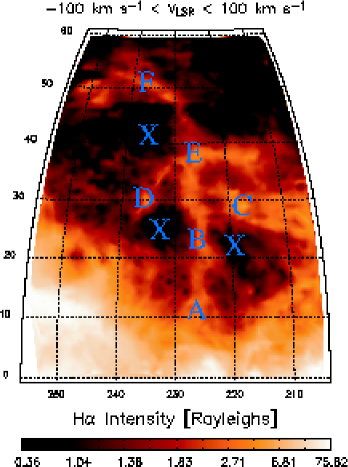
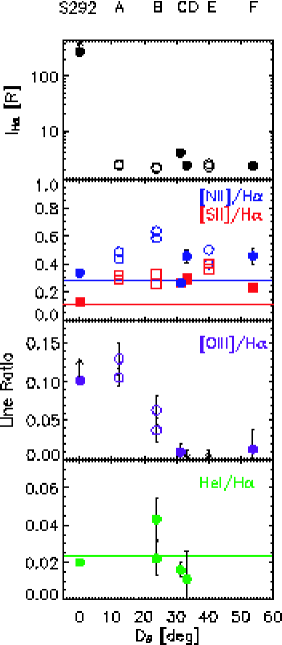
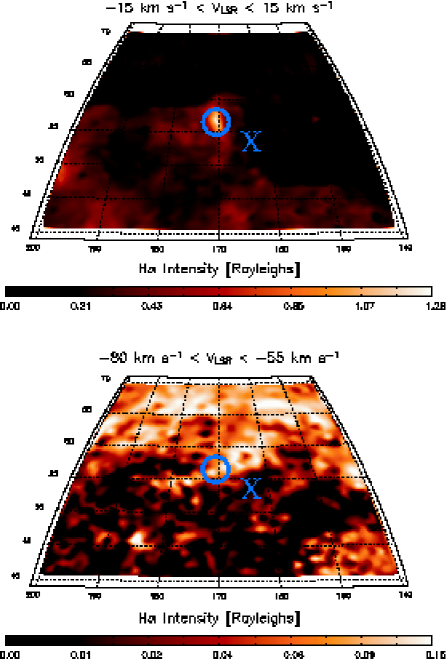
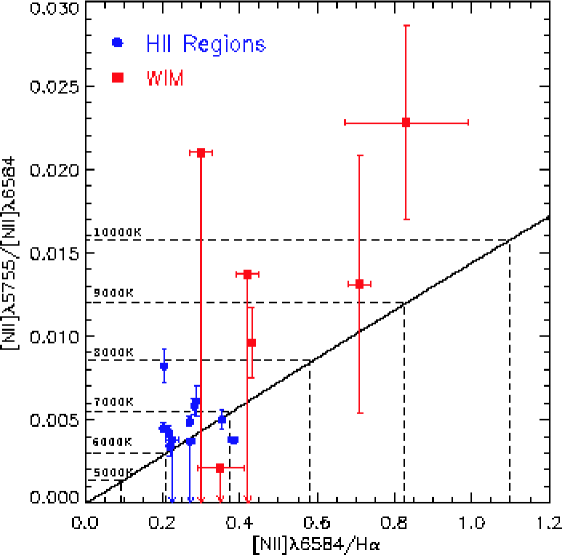
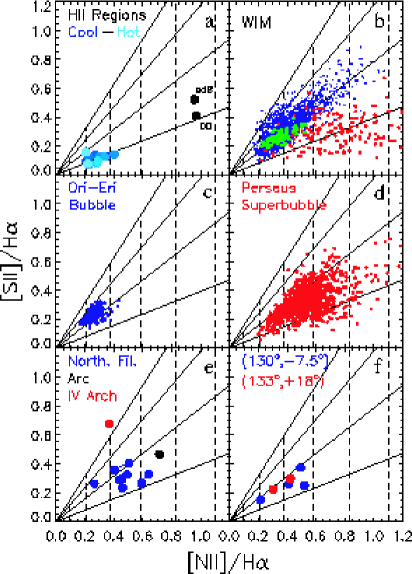
| Name | Ionizing Star(s) | ||||||||
|---|---|---|---|---|---|---|---|---|---|
| Name | Sp. Type | (∘) | (∘) | (km s-1) | (mag) | (R) | |||
| S132aaThese H II regions do not fill the WHAM 1∘ beam, and therefore actual H intensity for these objects may be significantly higher. | GP Cep | WN6+O6I | 102.8 | -0.9 | -51 | 2.32 0.03 | 820 | 20 | |
| W4 | Cas OB6 | O4I+… | 134.7 | +0.9 | -46 | 3.13 0.02 | 2800 | 50 | |
| S142-3aaThese H II regions do not fill the WHAM 1∘ beam, and therefore actual H intensity for these objects may be significantly higher. | HD 215835 | O6V | 107.0 | -1.0 | -43 | 1.84 0.03 | 425 | 10 | |
| S184aaThese H II regions do not fill the WHAM 1∘ beam, and therefore actual H intensity for these objects may be significantly higher. | HD 5005 | O6.5V+O8V | 123.2 | -6.3 | -34 | 1.00 0.01 | 329 | 4 | |
| S292 | CMa OB1 | O6.5V+… | 224.0 | -1.7 | +14 | 279 | 1 | ||
| S220 | Per | O7.5III | 159.7 | -12.4 | -4 | 0.52 0.01 | 496 | 3 | |
| Sivan 4A | Per | O7.5III | 160.4 | -13.1 | -1 | 0.87 0.01 | 135 | 2 | |
| Sivan 4B | Per | O7.5III | 161.1 | -13.9 | +5 | 0.60 0.02 | 25 | 1 | |
| S264 | Ori | O8III | 195.1 | -12.0 | +6 | 176 | 1 | ||
| Sivan 2 | AO Cas | O9III | 117.6 | -11.1 | -31 | 0.37 0.06 | 13 | 1 | |
| S126 | 10 Lac | O9V | 96.7 | -17.0 | -10 | 0.27 0.03 | 26 | 1 | |
| Sivan 3 | Cam | O9.5Ia | 144.1 | +14.1 | -9 | 0.97 0.08 | 41 | 2 | |
| S276 | Ori | O9.5V | 207.0 | -17.0 | +12 | 364 | 1 | ||
| sdB | PG 1047+003 | sdB | 250.9 | +50.2 | -13 | 2.4 | 0.1 | ||
| DO | PG 1034+001 | D0 | 247.6 | +47.7 | -11 | 2.0 | 0.1 | ||
| Name | [N II]/H | [S II]/H | [O III]/H | He I/H |
|---|---|---|---|---|
| (energy) | (energy) | (energy) | (energy) | |
| S132aaThese H II regions do not fill the WHAM 1∘ beam. | 0.22 0.01 | 0.08 0.01 | 0.49 0.02 | 0.037 0.001 |
| W4 | 0.20 0.01 | 0.15 0.01 | 0.30 0.01 | 0.033 0.001 |
| S142-3aaThese H II regions do not fill the WHAM 1∘ beam. | 0.29 0.01 | 0.09 0.01 | 0.24 0.01 | 0.031 0.001 |
| S184aaThese H II regions do not fill the WHAM 1∘ beam. | 0.28 0.01 | 0.08 0.01 | 0.349 0.006 | 0.036 0.001 |
| S292 | 0.34 0.01 | 0.12 0.01 | 0.099 0.002 | 0.020 0.001 |
| S220 | 0.40 0.01 | 0.14 0.01 | 0.035 0.002 | 0.019 0.001 |
| Sivan 4A | 0.23 0.01 | 0.07 0.01 | 0.271 0.006 | 0.030 0.001 |
| Sivan 4B | 0.31 0.01 | 0.13 0.01 | 0.105 0.004 | 0.018 0.002 |
| S264 | 0.23 0.01 | 0.08 0.01 | 0.084 0.002 | 0.013 0.001 |
| Sivan 2 | 0.23 0.02 | 0.12 0.01 | ||
| S126 | 0.27 0.01 | 0.14 0.01 | 0.125 0.006 | 0.018 0.002 |
| Sivan 3 | 0.21 0.02 | 0.09 0.01 | 0.076 0.008 | |
| S276 | 0.35 0.01 | 0.13 0.01 | 0.025 0.002 | 0.011 0.001 |
| sdB | 0.96 0.05 | 0.52 0.03 | 0.12 0.02 | |
| DO | 0.97 0.05 | 0.41 0.02 | 2.57 0.14 |
| Name | [N II]/H | [S II]/H | [O III]/H | He I/H | |||||||||
|---|---|---|---|---|---|---|---|---|---|---|---|---|---|
| (∘) | (∘) | (∘) | (km s-1) | (R) | (energy) | (energy) | (energy) | (energy) | |||||
| S276 | 207.0 | -17.0 | 1.9 | +12 | 364 1 | 0.35 0.01 | 0.13 0.01 | 0.023 | 0.002 | 0.012 | 0.001 | ||
| 1 | 211.5 | -22.1 | 5.7 | -16,+8 | 86.3 0.1 | 0.23 0.01 | 0.13 0.01 | 0.020 | 0.002 | 0.015 | 0.001 | ||
| 2 | 205.5 | -12.7 | 6.2 | +0 | 228.1 0.2 | 0.23 0.01 | 0.16 0.01 | 0.004 | 0.01 | 0.004 | 0.001 | ||
| 3 | 204.6 | -5.1 | 13.8 | +1 | 5.7 0.1 | 0.29 0.01 | 0.25 0.01 | 0.11 | 0.01 | 0.036 | 0.008 | ||
| 4 | 194.7 | -28.0 | 14.2 | +10 | 2.6 0.1 | 0.26 0.02 | 0.21 0.01 | 0.06 | 0.02 | 0.01 | |||
| 5 | 186.7 | -25.5 | 19.5 | +1 | 13.9 0.1 | 0.24 0.01 | 0.18 0.01 | 0.014 | 0.002 | 0.008 | 0.002 | ||
| 6 | 195.9 | -39.9 | 23.0 | +7 | 17.8 0.1 | 0.21 0.01 | 0.20 0.01 | 0.004 | 0.002 | 0.009 | 0.001 | ||
| 7 | 185.5 | -33.9 | 24.0 | +5 | 26.1 0.1 | 0.20 0.01 | 0.17 0.01 | 0.010 | 0.002 | 0.010 | 0.001 | ||
| A | 193.0 | -47.5 | 30.8 | +1 | 1.0 0.1 | 0.43 0.03 | 0.29 0.05 | 0.02 | 0.02 | ||||
| B | 193.8 | -48.4 | 31.3 | -11 | 6.6 0.1 | 0.19 0.01 | 0.18 0.01 | 0.004 | 0.02 | 0.01 | |||
| C | 193.6 | -49.2 | 32.2 | -7 | 14.9 0.1 | 0.18 0.01 | 0.20 0.01 | 0.006 | 0.002 | 0.011 | 0.002 | ||
| D | 192.9 | -50.1 | 33.1 | -2 | 13.7 0.1 | 0.26 0.01 | 0.27 0.01 | 0.010 | 0.002 | 0.015 | 0.002 | ||
| E | 192.7 | -50.9 | 33.9 | +8 | 7.3 0.1 | 0.26 0.01 | 0.27 0.01 | 0.002 | 0.010 | 0.005 | |||
| F | 192.1 | -51.8 | 34.9 | +5 | 3.5 0.1 | 0.20 0.01 | 0.20 0.01 | 0.01 | 0.01 | ||||
| G | 192.1 | -52.6 | 35.6 | +2 | 1.3 0.1 | 0.16 0.02 | 0.17 0.04 | 0.02 | 0.02 | 0.03 | |||
| Name | [N II]/H | [S II]/H | [O III]/H | He I/H | |||||
|---|---|---|---|---|---|---|---|---|---|
| (∘) | (∘) | (∘) | (km s-1) | (R) | (energy) | (energy) | (energy) | (energy) | |
| 1 | 130.0 | -7.5 | 0 | 4.9 0.1 | 0.52 0.02 | 0.25 0.01 | 0.08 0.01 | 0.025 0.003 | |
| 2 | 130.0 | -7.5 | -33 | 2.7 0.1 | 0.49 0.03 | 0.37 0.02 | 0.17 0.02 | 0.036 0.006 | |
| 3 | 130.0 | -7.5 | 9.6 | -56 | 2.2 0.1 | 0.21 0.03 | 0.15 0.02 | 0.35 0.02 | 0.021 0.007 |
| 4 | 130.0 | -7.5 | -75 | 1.5 0.1 | 0.41 0.05 | 0.26 0.03 | 0.16 0.02 | 0.04 0.01 | |
| 1 | 133.0 | 18.0 | -20 | 0.7 0.1 | 0.30 0.03 | 0.22 0.03 | 0.11 0.01 | 0.05 0.06 | |
| 2 | 133.0 | 18.0 | 17.2 | -62 | 0.8 0.1 | 0.42 0.03 | 0.30 0.02 | 0.06 0.01 | 0.04 0.06 |
| Name | [N II]/H | [S II]/H | [O III]/H | He I/H | |||||
|---|---|---|---|---|---|---|---|---|---|
| (∘) | (∘) | (∘) | (km s-1) | (R) | (energy) | (energy) | (energy) | (energy) | |
| S292 | 224.0 | -1.7 | 0.0 | +14 | 279 1 | 0.34 0.01 | 0.12 0.01 | 0.099 0.002 | 0.020 0.001 |
| A #1 | 226.0 | 10.2 | 12.1 | +17 | 2.5 0.1 | 0.49 0.03 | 0.32 0.02 | 0.10 0.02 | |
| A #2 | 226.0 | 10.2 | 12.1 | +17 | 2.3 0.1 | 0.44 0.02 | 0.29 0.02 | 0.14 0.02 | |
| B #1 | 225.2 | 22.1 | 23.8 | +10 | 2.1 0.1 | 0.63 0.02 | 0.33 0.01 | 0.06 0.02 | 0.04 0.01 |
| B #2 | 225.2 | 22.1 | 23.8 | +10 | 2.1 0.1 | 0.58 0.02 | 0.26 0.02 | 0.04 0.02 | 0.02 0.01 |
| C | 217.1 | 28.9 | 31.3 | -4 | 4.0 0.1 | 0.27 0.03 | 0.26 0.01 | 0.01 0.01 | 0.016 0.004 |
| D | 235.2 | 29.7 | 33.2 | +5 | 2.3 0.1 | 0.46 0.05 | 0.29 0.01 | 0.004 | 0.01 0.02 |
| E #1 | 226.2 | 38.2 | 40.0 | -1 | 2.5 0.1 | 0.50 0.03 | 0.40 0.02 | 0.008 | |
| E #2 | 226.2 | 38.2 | 40.0 | -1 | 2.2 0.1 | 0.40 0.04 | 0.36 0.02 | 0.01 | |
| F | 236.3 | 50.9 | 53.7 | -18 | 2.3 0.1 | 0.46 0.05 | 0.23 0.01 | 0.02 0.02 | |
| Arc | 170.8 | 56.9 | +3 | 1.31 0.02 | 0.72 0.03 | 0.46 0.02 | 0.06 0.02 | 0.05 0.01 | |
| IV Arch | 170.8 | 56.9 | -67 | 0.11 0.02 | 0.4 0.2 | 0.7 0.2 |
| Name | [N II]/H | [N II]/[N II] | ||
|---|---|---|---|---|
| (energy) | (energy) | (K) | (K) | |
| S132 | 0.219 0.006 | 0.0034 0.0006 | 6050 50 | 6200 300 |
| W4 | 0.204 0.006 | 0.0082 0.0010 | 5950 50 | 7900 300 |
| S142-3 | 0.288 0.010 | 0.0061 0.0009 | 6500 50 | 7300 300 |
| S184 | 0.282 0.004 | 0.0058 0.0005 | 6500 50 | 7200 200 |
| S126 | 0.272 0.010 | 6400 50 | ||
| Sivan 2 | 0.226 0.016 | 6100 100 | ||
| S117aaData from Reynolds et al. (2001b) | 0.202 0.005 | 0.0045 0.0003 | 5950 50 | 6700 100 |
| S220aaData from Reynolds et al. (2001b) | 0.383 0.012 | 0.0038 0.0002 | 7050 50 | 6400 100 |
| S252aaData from Reynolds et al. (2001b) | 0.270 0.009 | 0.0049 0.0003 | 6400 50 | 6800 100 |
| S261aaData from Reynolds et al. (2001b) | 0.353 0.009 | 0.0050 0.0006 | 6900 50 | 6900 200 |
| S264aaData from Reynolds et al. (2001b) | 0.216 0.006 | 0.0042 0.0004 | 6050 50 | 6500 200 |
| (130,-7.5)aaData from Reynolds et al. (2001b) | 0.43 0.01 | 0.010 0.002 | 7300 100 | 8300 600 |
| High Lat. Arc | 0.71 0.03 | 0.013 0.008 | 8500 100 | 9300 2000 |
| WIM(Sivan 2) | 0.8 0.2 | 0.023 0.006 | 9000 600 | 11700 1400 |
| WIM(S132) | 0.35 0.06 | 6900 400 | ||
| (133,+18)bbComponent with -20 km s-1 | 0.30 0.03 | 6600 200 | ||
| (133,+18)ccComponent with -60 km s-1 | 0.42 0.03 | 7300 100 |