What do we learn from IRAC observations of galaxies at ?11affiliation: Based on observations with the Spitzer Space Telescope, which is operated by the Jet Propulsion Laboratory, California Institute of Technology under NASA contract 1407. Support for this work was provided by NASA through contract 125790 issued by JPL/Caltech. Based on service mode observations collected at the European Southern Observatory, Paranal, Chile (LP Program 164.O-0612). Based on observations with the NASA/ESA Hubble Space Telescope, obtained at the Space Telescope Science Institute which is operated by AURA, Inc., under NASA contract NAS5-26555.
Abstract
We analyze very deep HST, VLT and Spitzer photometry of galaxies at in the Hubble Deep Field South. The sample is selected from the deepest public K-band imaging currently available. We show that the rest-frame vs color-color diagram is a powerful diagnostic of the stellar populations of distant galaxies. Galaxies with red rest-frame colors are generally red in rest-frame as well. However, at a given color a range in colors exists, and we show that this allows us to distinguish young, dusty galaxies from old, passively evolving galaxies. We quantify the effects of IRAC photometry on estimates of masses, ages, and the dust content of galaxies. The estimated distributions of these properties do not change significantly when adding IRAC data to the UBVIJHK photometry. However, for individual galaxies the addition of IRAC can improve the constraints on the stellar populations, especially for red galaxies: uncertainties in stellar mass decrease by a factor of 2.7 for red () galaxies, but only by a factor of 1.3 for blue () galaxies. We find a similar color-dependence of the improvement for estimates of age and dust extinction. In addition, the improvement from adding IRAC depends on the availability of full near-infrared JHK coverage; if only K-band were available, the mass uncertainties of blue galaxies would decrease by a more substantial factor 1.9. Finally, we find that a trend of galaxy color with stellar mass is already present at . The most massive galaxies at high redshift have red rest-frame colors compared to lower mass galaxies even when allowing for complex star formation histories.
Subject headings:
galaxies: evolution - galaxies: high redshift - infrared: galaxies1. Introduction
Two of the major challenges in observational cosmology are understanding the history of star formation in galaxies, and understanding the assembly of mass through cosmic time. In the local universe elaborate surveys mapped the diversity of nearby galaxies (e.g. Blanton et al. 2003) and characterized the dependence of their colors (Baldry et al. 2004) and star formation (Kauffmann et al. 2003) on galaxy mass. The study of their progenitors at is important since it is believed that at this epoch the most massive galaxies formed their stars (Glazebrook et al. 2004; van der Wel et al. 2005; Rudnick et al. 2006).
The first method to efficiently identify distant galaxies was the Lyman-break technique (Steidel et al. 1996). Large samples have been spectroscopically confirmed (Steidel et al. 1999). Their stellar populations have been characterized by means of broad-band photometry (e.g. Papovich, Dickinson, & Ferguson 2001, Shapley et al. 2005), optical spectroscopy (e.g. Shapley et al. 2003) and near-infrared spectroscopy (Erb et al. 2003, 2006). Lyman break galaxies (LBGs) have spectral energy distributions similar to nearby starburst galaxies.
In recent years, new selection criteria provided evidence for a variety in color space among high redshift galaxies as rich as in the local universe. Among the newly discovered populations are submm galaxies (e.g. Smail et al. 2004), “IRAC Extremely Red Objects” (IEROs; Yan et al. 2004), “BzK” objects (Daddi et al. 2004) and distant red galaxies (DRGs; Franx et al. 2003). The latter are selected by the simple color criterion . Their rest-frame UV-to-optical SEDs resemble those of normal nearby galaxies of type Sbc-Scd (Förster Schreiber et al. 2004). Near-infrared spectroscopy of DRGs (Kriek et al. 2006) and extension of the broad-band photometry to mid-infrared wavelengths (Labbé et al. 2005) suggests that evolved stellar populations exist already at . Rudnick et al. (2006) showed that DRGs contribute significantly to the mass density in rest-frame optically luminous galaxies. van Dokkum et al. (2006) studied a stellar mass-limited sample of galaxies with and found that DRGs, rather than LBGs, are the dominant population at the high mass end at .
In this paper, we exploit the imaging of the Hubble Deep Field South by Spitzer/IRAC (Fazio et al. 2004) to extend the SED analysis of distant galaxies to the rest-frame near-infrared and constrain their stellar masses and stellar populations. Our sample is complete to . No color selection criteria are applied. The depth of our imaging allows us to probe down to stellar masses of a few . We investigate whether IRAC helps to study the diversity of galaxies at high redshift and if the addition of IRAC improves the constraints on stellar mass, age and dust content. Finally, we investigate the dependence of galaxy color on stellar mass.
The paper is structured as follows. In §2 we describe the data, IRAC photometry and sample definition. §3 explains the modeling of spectral energy distributions (SEDs). The rest-frame optical to near-infrared color distribution of our K-selected sample is discussed in §4. §5 provides an in depth discussion of the constraints that IRAC places on estimates of age, dust extinction and stellar mass. First wavelength and model dependence are discussed from a theoretical perspective. Next we discuss results from applying the models to our U-to- spectral energy distributions. In §6 we investigate the rest-frame optical colors of high redshift galaxies as a function of stellar mass. Finally, the conclusions are summarized in §7.
Throughout the paper we adopt a cosmology with , , and .
2. Data, photometry and sample selection
2.1. Data
Observations of the HDFS/WFPC2 field were obtained with the IRAC camera (Fazio et al. 2004) on the Spitzer Space Telescope (Werner et al. 2004) in June 2004 and June 2005 (GTO program 214). A field of view was covered by the 4 broadband filters at 3.6, 4.5, 5.8 and 8 microns. The data, reduction and photometry will be described in detail by Labbé et al. (in preparation). Briefly, we started with the Basic Calibrated Data (BCD) as provided by the Spitzer Science Center pipeline. We applied a series of procedures to reject cosmic rays and remove artifacts such as column pulldown, muxbleed, and the “first frame effect” (Hora et al. 2004). Finally, the frames were registered to and projected on a 2x2 blocked (02396 pixel scale) version of an existing ISAAC K-band image (Labbé et al. 2003, hereafter L03)111NIR data from the FIRES survey of the HDFS is publicly available from http://www.strw.leidenuniv.nl/~fires, and average-combined. Characteristics such as exposure time, FWHM, limiting depth (, 3” diameter aperture) and positional accuracy in each of the 4 IRAC bands are summarized in Table 1. A summary of the optical-to-NIR observations by L03 is provided in Table 2. All magnitudes quoted in this paper are in the AB system.
| Filter | Exposure time | FWHM | Limiting depth | Positional AccuracyaaThe rms difference between bright star positions in IRAC and K-band image. |
|---|---|---|---|---|
| () | (hr) | (′′) | (, 3′′ diameter aperture) | (′′) |
| 3.6 | 3.76 | 1.95 | 25.6 | 0.09 |
| 4.5 | 3.76 | 1.90 | 25.6 | 0.15 |
| 5.8 | 3.76 | 2.10 | 23.4 | 0.14 |
| 8.0 | 3.64 | 2.15 | 23.3 | 0.11 |
| Instrument/Telescope | Filter | Exposure time | FWHM | Limiting depth |
|---|---|---|---|---|
| (hr) | (′′) | (, diameter aperture) | ||
| WFPC2/HST | 36.8 | 0.16 | 27.8 | |
| WFPC2/HST | 28.3 | 0.14 | 28.6 | |
| WFPC2/HST | 27.0 | 0.13 | 28.9 | |
| WFPC2/HST | 31.2 | 0.14 | 28.3 | |
| ISAAC/VLT | 33.6 | 0.45 | 26.9 | |
| ISAAC/VLT | 32.3 | 0.48 | 26.4 | |
| ISAAC/VLT | 35.6 | 0.46 | 26.4 |
2.2. Photometry
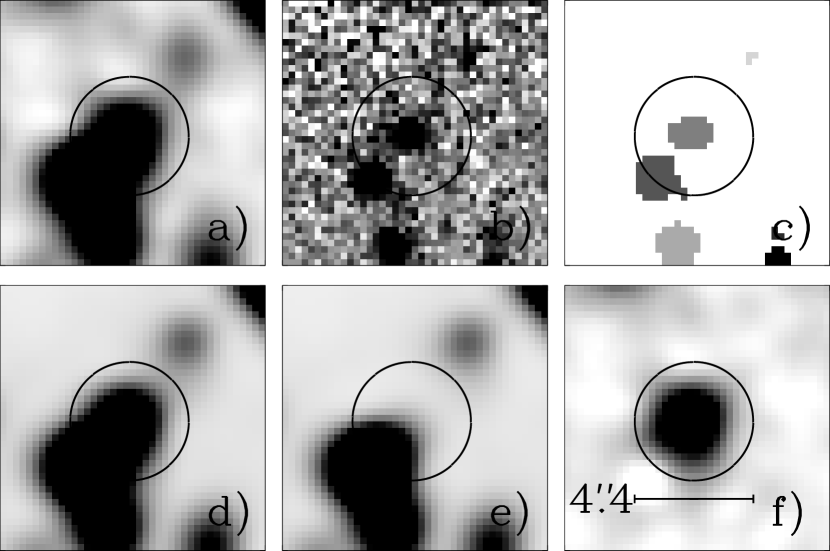
In this section we describe the steps to combine the IRAC data and optical-to-NIR data (L03) into one consistent K-band selected photometric catalog. In this paper we limit ourselves to the field where very deep K-band data is available from L03. The main challenge in doing IRAC photometry is a proper treatment of source confusion and PSF matching of the data. Integrating for nearly 4 hours with IRAC at 3.6 and 4.5 reaches a depth only 1 mag shallower than 36 hours of ISAAC K-band imaging (), but the IRAC images have a 4 times broader PSF causing many sources to be blended. Information on the position and extent of K-band detected objects was used to fit and subtract the fluxes of neighbouring sources. Each K-band detected source was isolated using the SExtractor “segmentation map” and convolved individually to the considered IRAC PSF. Next all convolved sources were fitted to the IRAC image, leaving only their fluxes as free parameters. We subsequently subtract the best-fit fluxes of all neighboring sources to remove the contamination. An illustration of this measurement technique is presented in Fig 1.
The resulting cleaned IRAC images are matched to the broadest PSF (of the 8 image). We measured fluxes on the cleaned, PSF-matched images within a fixed diameter circular aperture. The aperture size is a compromise between quality of PSF matching (within 3% as derived from dividing growthcurves) and adding too much noise. Finally we applied for each source an aperture correction to scale the IRAC fluxes to the “color” apertures defined for the K-band catalog by L03. The correction factor is the ratio of the original K-band flux in the color aperture and the K-band flux in the PSF matched image within a diameter aperture. Photometric errors were calculated by taking the rms of fluxes in diameter apertures on empty places in the IRAC image. The end product is a photometric catalog with consistent photometry from optical to MIR wavelengths with 11 filters (UBVIJHK+IRAC).
2.3. Sample selection
From the catalog described in §2.2 we selected all galaxies, well covered by all 11 filters, that have in the K-band. The sample reaches to a limiting total K-band magnitude .
Since spectroscopic redshifts are only available for 63 out of 274 objects, we mostly rely on photometric redshift estimates to select high redshift galaxies and compute rest-frame colors and luminosities. The photometric redshifts and derived rest-frame photometry were calculated as follows. We used an algorithm developed by Rudnick et al. (2001, 2003) to fit a nonnegative linear combination of galaxy templates to the spectral energy distribution of each galaxy. The template set consisted of empirical E, Sbc, Scd and Im templates from Coleman, Wu,& Weedman (1980), the two least reddened starburst templates from Kinney et al. (1996) and two Bruzual & Charlot (2003; BC03) single stellar populations (SSP) with a Salpeter (1955) stellar initial mass function (IMF), aged 1 Gyr and 10 Myr respectively. The empirical templates were extended into the IR using the BC03 stellar population synthesis code. The derived photometric redshifts show a good agreement with the available spectroscopic redshifts. The average value of is 0.06, 0.09 and 0.08 for galaxies at , and respectively.
Once the redshift was derived, we calculated rest-frame luminosities and colors by interpolating between observed bands using the best-fit templates as a guide. For a detailed description, we refer to Rudnick et al. (2003).
The K-band selected sample contains 121 sources at , 72 at and 75 at . The K+IRAC photometry of the galaxies at is provided as an electronic table (see Table 3 for a sample entry). In §4 we study the color-distribution of galaxies with over the whole redshift range. From thereon, we will focus on the high redshift bin. Two commonly color-selected populations at will be highlighted where of interest. Lyman-break galaxies (LBGs) are selected from the WFPC2 imaging using the criteria of Madau et al. (1996). Distant Red Galaxies (DRGs) are selected by the simple color criterion (Franx et al. 2003).
| ObjectaaObject identification number corresponds to that of the U-to-K catalog by Labbé et al. (2003). | bbFluxes in total (tot) and color (col) aperture are scaled to an AB zeropoint of 25, i.e. mag. | |||||
|---|---|---|---|---|---|---|
| 176 |
| ObjectaaObject identification number corresponds to that of the U-to-K catalog by Labbé et al. (2003). | z | SFH | |||
|---|---|---|---|---|---|
| () | (Gyr) | ||||
| 176 |
3. SED modeling
To study physical characteristics of the galaxies such as stellar mass, stellar age and amount of dust extinction, we make use of the evolutionary synthesis code developed by BC03. We fitted the synthetic spectra to our observed SEDs using the publicly available HYPERZ stellar population fitting code, version 1.1 (Bolzonella et al. 2000). Redshifts were fixed to the measurement (see §2.3, Rudnick et al. 2003) or when available. A minimum error of 0.08 mag was adopted to avoid that the data points with the largest errors are effectively ignored in the SED fits. We fitted three distinct star formation histories: a single stellar population (SSP) without dust, a constant star-formation (CSF) history with dust ( varying from 0 to 4 in steps of 0.2) and an exponentially declining star-formation history with an e-folding timescale of 300 Myr () and identical range of values. The exponentially declining model allows for quiescent systems that underwent a period of enhanced star formation in their past. Förster Schreiber et al. (2004) showed that the estimated extinction values do not vary monotonically with the e-folding timescale , but reach a minimum around 300 Myr. Including the model thus ensures that the allowed star formation histories encompass the whole region of parameter space that would be occupied when fitting models with different values of . For each of the star-formation histories (SFHs), we constrained the time elapsed since the onset of star formation to a minimum of 50 Myr, avoiding fit results with improbable young ages. The age of the universe at the observed redshift was set as an upper limit to the ages. Furthermore, we assume a Salpeter (1955) IMF with lower and upper mass cut-offs and , solar metallicity and we adopt a Calzetti et al. (2000) extinction law. For each object the star-formation history resulting in the lowest of the fit was selected and corresponding model quantities such as age, mass and dust extinction were adopted as the best-fit value. We calculated the mass-weighted age for each galaxy by integrating over the different ages of SSPs that build up the SFH, weighting with their mass fraction. We use this measure since it is more robust with respect to degeneracies in SFH than the time passed since the onset of star formation; it describes the age of the bulk of the stars. An electronic table, the contents of which are illustrated in Table 4, summarizing the results of our SED modeling for the subsample of galaxies at is available in the online Journal. In Fig. 2 we show example U-to- SEDs with best-fit BC03 models of galaxies over the whole redshift range, illustrating that at all epochs a large variety of galaxy types is present.

We fitted all objects in our sample twice, once with and once without IRAC photometry. We repeated the SED modeling with the same parameter settings using the models by Maraston et al. (2005). The results will be discussed in §5.2.2. Variations in modeled parameters due to a different metallicity are addressed in §5.2.3. The effects of adopting a different extinction law are discussed in §5.2.4. Unless mentioned otherwise, we refer to stellar mass, mass-weighted age and dust extinction values derived from the U-to- SEDs with BC03 models.
4. Rest-frame optical to near-infrared color distribution
At redshifts above 1 all rest-frame near-infrared bands have shifted redward of observed K and mid-infrared photometry is needed to compute rest-frame NIR fluxes from interpolation between observed bands. It has only been with the advent of IRAC on the Spitzer Space Telescope that the rest-frame near-infrared opened up for the study of high redshift galaxies. As the and images are much deeper than the and images (see Table 1), we focus on the rest-frame J-band ().
Several studies have focussed on the optical to near-infrared colors and inferred stellar populations of particular color-selected samples (e.g. Shapley et al. 2005, Labbé et al. 2005). In this section we take advantage of the multiwavelength data and the very deep K-band selection to study the rest-frame optical to near-infrared colors of all galaxies up to without color bias. For the first time we can therefore investigate what range in optical to near-infrared colors high redshift galaxies occupy, how their optical to near-infrared colors relate to pure optical colors, and what this tells us about the nature of their stellar populations.
In Fig. 3 we present a color-color diagram of versus for the redshift bins , and . A clear correlation of with is observed at all redshifts. The color samples the Balmer/4000 break. The large wavelength range spanned by and together is useful to probe reddening by dust.
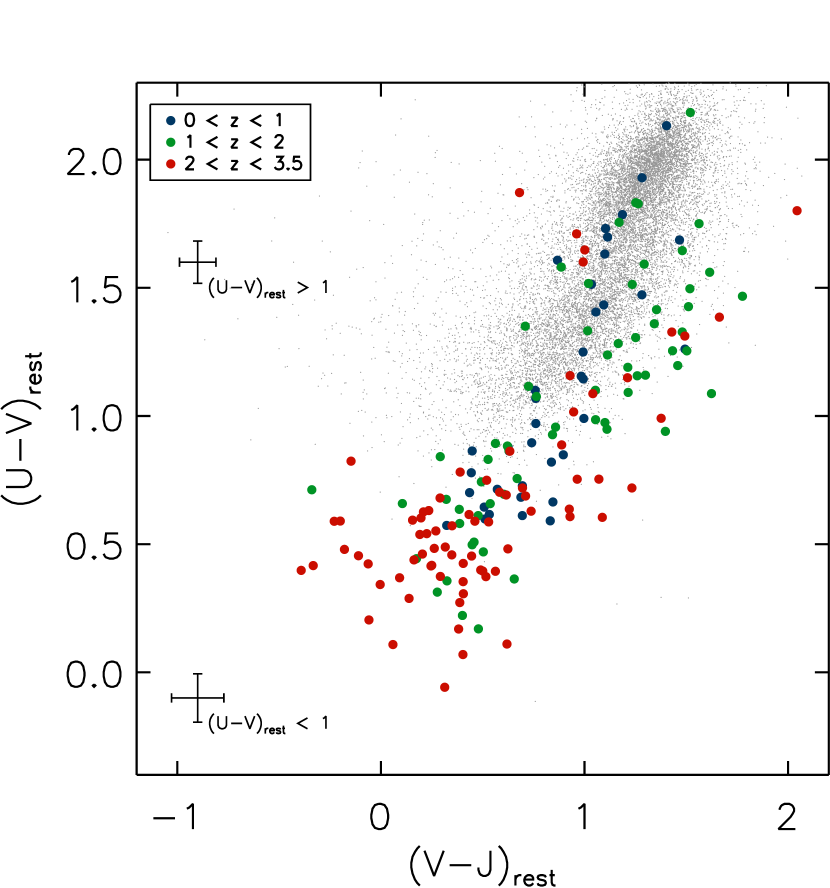
To study how the color distribution compares to that in the local universe, we indicate the colors of galaxies in the low-redshift New York University Value-Added Galaxy Catalog (NYU_VAGC, Blanton et al. 2005) with small grey dots. The low-z NYU_VAGC is a sample of nearly 50000 galaxies at extracted from the Sloan Digital Sky Survey (SDSS data release 4, Adelman-McCarthy et al. 2006). It is designed to serve as a reliable reference for the local galaxy population and contains matches to the Two Micron All Sky Survey Point Source Catalog and Extended Source Catalog (2MASS, Cutri et al. 2000). Only the subsample of 20180 sources that are detected in the 2MASS J-band are plotted in Fig. 3. This results effectively in a reduction of the blue peak of the bimodal distribution. We only show those galaxies (both for the local sample and for our sample of HDFS galaxies) with a rest-frame V-band luminosity . At this luminosity the distribution of low-z NYU_VAGC galaxies with SDSS and 2MASS detections starts falling off. From the much deeper HDFS imaging the luminosity cut weeds out low to intermediate redshift dwarf galaxies.
The same trend of optically red galaxies being red in optical to near-infrared wavelengths that we found for galaxies up to is observed in the local universe. However, there are two notable differences in the color distribution between distant and local galaxies. First, a population of luminous high redshift galaxies with very blue and exists without an abundant counterpart in the local universe. The 2MASS observations are not deep enough to probe very blue colors, but we can ascertain that of all low-z NYU_VAGC sources with lie in the range . About half of the blue galaxies at with and satisfy the Lyman-break criterion. Their stellar populations have been extensively studied (e.g. Papovich et al. 2001, Shapley et al. 2001, among many others) and their blue SEDs (see e.g. object and in Fig. 2) are found to be well described by relatively unobscured star formation. The rest-frame optical bluing with increasing redshift of galaxies down to a fixed is thoroughly discussed by Rudnick et al. (2003).
A second notable difference with respect to the color distribution of nearby galaxies is present at , where most local galaxies reside. Our sample of HDFS galaxies has a median offset with respect to the SDSS+2MASS galaxies of mag towards redder at a given . Furthermore, the spread in is larger, extending from colors similar to that of local galaxies to colors up to a magnitude redder. The larger spread in colors at a given is not caused by photometric uncertainties. After subtraction in quadrature of the scatter expected from measurement errors (0.05 mag) we obtain an intrinsic scatter of 0.3 mag, significantly larger than that for SDSS+2MASS galaxies (0.19 mag) at a level.
In order to understand the nature of galaxies with similar or redder than the bulk of nearby galaxies, we make use of stellar population synthesis models by Bruzual & Charlot (2003; BC03). In Fig. 4 we draw age tracks for three different dust-free star formation histories in the vs color-color diagram.
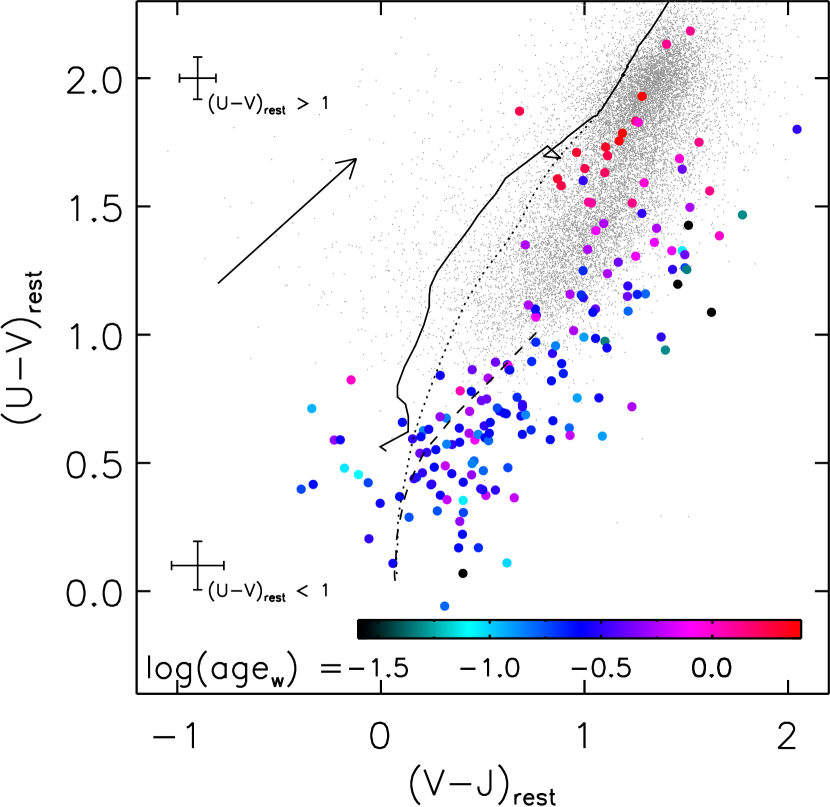
The solid line represents a single stellar population (SSP), the dashed line a continuous star formation model (CSF) and the dotted line an exponentially declining star formation model with an e-folding timescale of 300 Myr (). All star formation histories show an evolution to redder and with age. The model first has similar colors as a CSF model and eventually moves to the same region in color space as an evolved SSP, namely where the red peak of the SDSS bimodal distribution is located. In the absence of dust a population with a constant star formation history only reaches in a Hubble time.
We now investigate how the location in this color plane is related to stellar populations. Using the best-fit model parameters (see §3) we plot the mass-weighted ages for the galaxies with with color-coding on Fig. 4. Galaxies with blue optical colors are indeed found to be young, the median mass-weighted age for galaxies at being 250 Myr. At galaxies with a wide range of stellar ages are found. The oldest stellar populations show the bluest colors at a given . Over the whole redshift range galaxies are present that have red optical colors and whose SEDs are consistent with evolved stellar populations and low dust content. According to their best-fit model, three of them started forming stars less than 0.5 Gyr after the big bang and already at have star formation rates less than a percent of the past-averaged value. We note that in the Chandra Deep Field South Papovich et al. (2006) find a number density of passively evolving galaxies at high redshift that is nearly an order of magnitude lower than in the HDFS, possibly owing to the fact that the HDFS observations probe to fainter K-band magnitudes. The red side of the color distribution is made up of galaxies that are best fitted by young stellar populations. Since the age tracks alone cannot explain the presence of galaxies with such red SEDs from the optical throughout the near-infrared, we investigate the role of dust in shaping the galaxy color distribution.
Fig. 5 shows again the versus color-color diagram, now color-coded by best-fit dust extinction, expressed in .
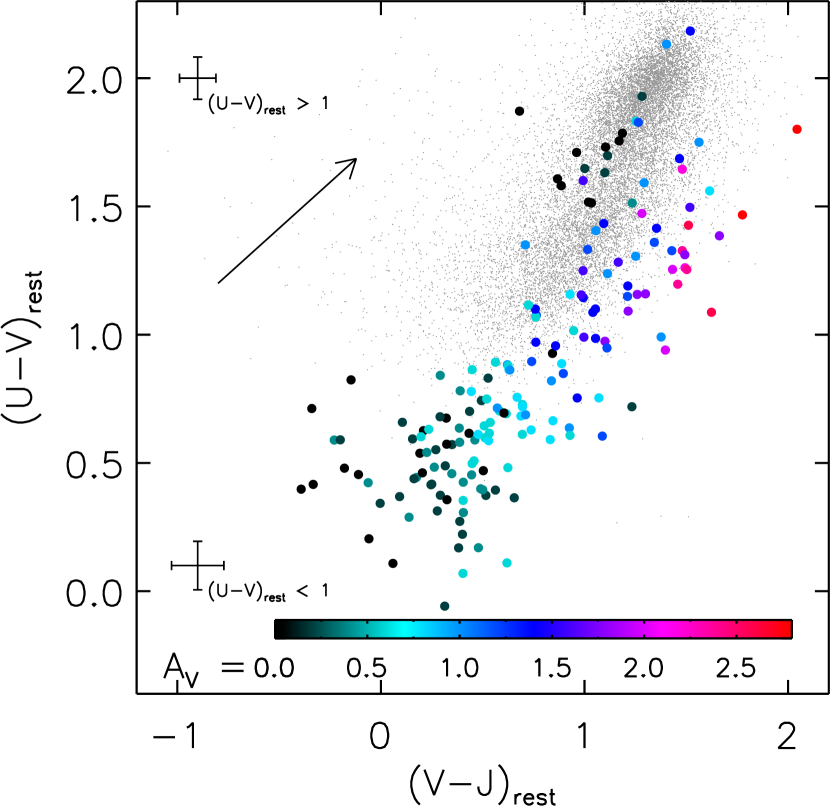
The arrow indicates an of 1 magnitude using a Calzetti et al. (2000) extinction law. It is immediately apparent that the optical to near-infrared color-color diagram is a useful diagnostic for distinguishing stellar populations with various amounts of dust extinction. At the bluest colors there is little evidence for dust obscuration. The degree of dust extinction increases as we move along the dust vector to redder colors.
Independent constraints on dust-enshrouded activity in distant galaxies can be derived from MIPS imaging (Webb et al. 2006; Papovich et al. 2006). The mid-infrared emission is usually thought to be powered by a dusty starburst in which PAH features are produced or by an active galactic nucleus (AGN). Ninety-five % of the area with very deep U-to- in the HDFS is covered by a 1-hour MIPS pointing. We performed the same photometric procedure to reduce confusion as for the IRAC photometry (see §2.2). Fluxes were measured within a diameter aperture and then scaled to total using the growthcurve of the PSF.
In Fig. 6 we plot the versus color-color diagram of all objects in the redshift interval with that are covered by MIPS (empty circles).
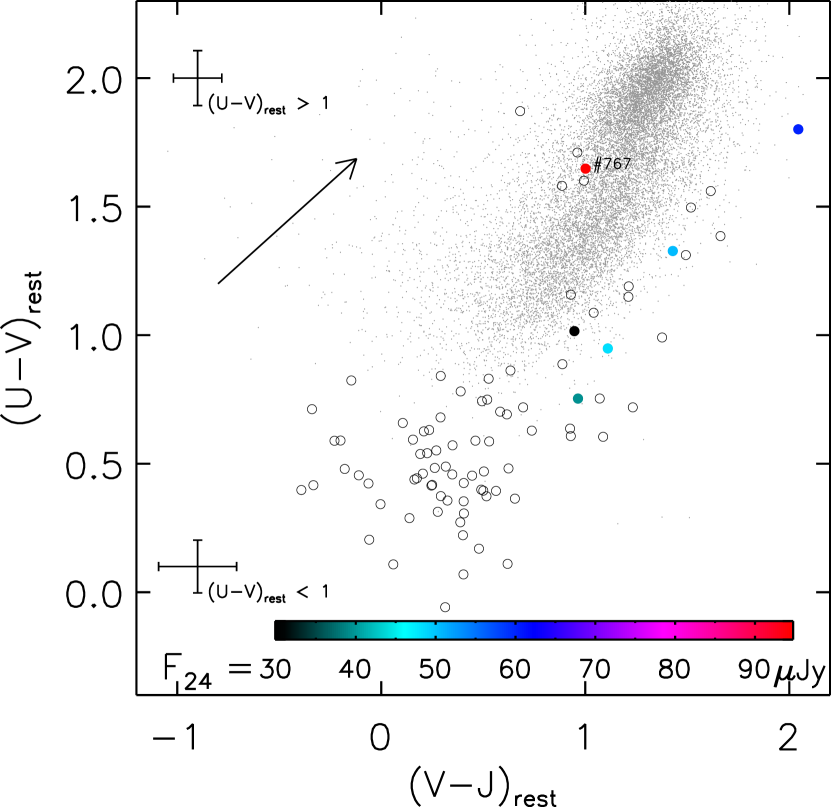
At these redshifts strong PAH features, if present, move through the MIPS passband. Six sources have a MIPS detection above . Their flux is indicated by the colored filled circles. Object (red circle) is well detected with . As noted by Labbé et al. (2005) its SED shows an excess with respect to the best-fitting template. The combination of excess and detection suggests that this galaxy hosts an AGN whose power law SED dominates throughout the mid-infrared. All other detections are located in the part of the diagram where our U-to- SED modeling found dusty young populations. None of the blue relatively unobscured star-forming galaxies or red evolved galaxies show evidence of PAH emission from the observed flux. There are various reasons why not all straforming dusty galaxies have a detection. The density of the UV radiation field exciting the PAHs may vary among galaxies. Furthermore, the narrow PAH features with respect to the width of the passband make the flux very sensitive to redshift. Overall, MIPS observations agree well with SED modeling and rest-frame optical-NIR color characterization.
We conclude that over the whole redshift range from to a trend is visible of galaxies with redder optical colors showing redder optical to near-infrared colors. However, at a given optical color, a spread in optical to near-infrared colors is observed that is larger than for nearby galaxies. At evolved galaxies with little dust extinction are found at the bluest . Dusty young star-forming galaxies occupy the reddest colors. This is once more illustrated by the SEDs of galaxies with presented in Fig. 7.

The upper row shows SEDs of objects at the blue side of the color distribution. The panels below show SEDs of galaxies matched in , but with comparatively redder colors. The latter galaxies have comparatively younger ages and a larger dust content. Since this distinction could not be made on the basis of color alone, the addition of IRAC photometry to our U-to-K SEDs proves very valuable for the understanding of stellar populations at high redshift.
We verified that no substantial changes occur to the rest-frame optical-to-NIR color distribution and its interpretation in terms of age and dust content of the galaxies when we derive photometric redshifts by running HYPERZ with redshift as free parameter instead of using the algorithm developed by Rudnick et al. (2003, see §2.3).
5. Constraints on stellar population properties at : age, dust and mass
We now proceed to analyse in more detail the constraints that IRAC places on the stellar populations of the subsample of galaxies at (75 galaxies). In particular we will focus on stellar mass, which likely plays a key role in galaxy evolution at all redshifts (e.g. Kauffmann et al. 2003; Bundy et al. 2005; Drory et al. 2005; Rudnick et al. 2006). Fortunately, estimates of stellar mass from modeling the broad-band SEDs are generally more robust than estimates of dust content and stellar age (Bell& de Jong 2001; Shapley et al. 2001; Papovich et al. 2001; Förster Schreiber et al. 2004). Nevertheless, translating colors to mass-to-light ratios and subsequently stellar masses requires a good understanding of the effects of age and dust.
5.1. Predictions from stellar population synthesis models
5.1.1 Wavelength dependence: optical vs near-infrared
In its simplest form, the stellar mass of a galaxy can be estimated from one color (see e.g. Bell et al. 2001). To illustrate this process, we present the evolutionary track of a dust-free BC03 model in a versus diagram (Fig. 8).
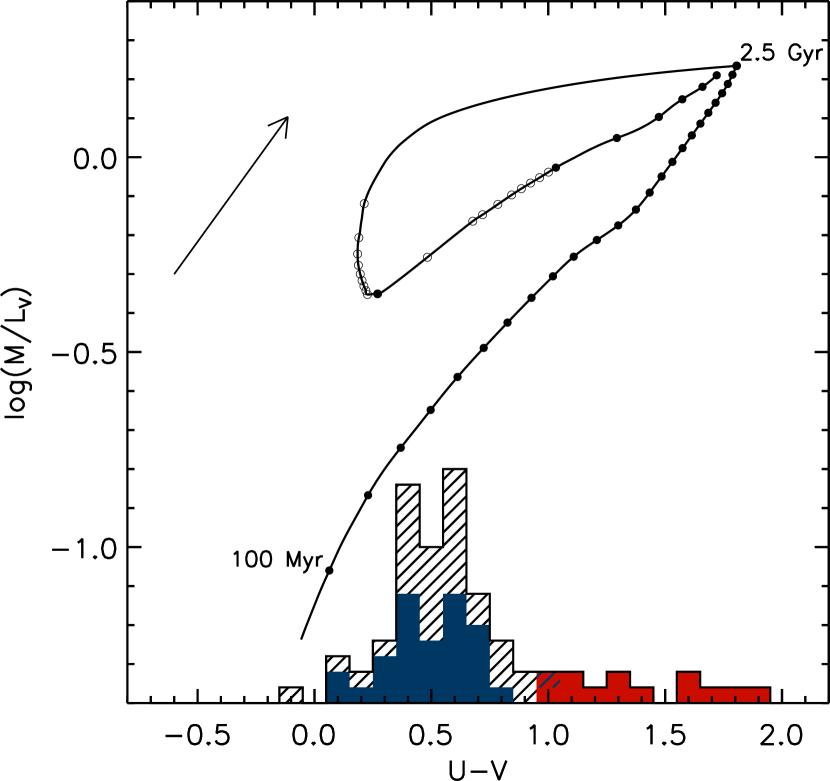
Up to 2.5 Gyr after the onset of star formation (upper right corner of Fig. 8) the track represents a 1-component population with a star formation history that is exponentially declining, with an e-folding timescale of 300 Myr. For most of the galaxies in our sample this was the best-fitting star formation history. For more extreme star formation histories such as an SSP or CSF the process of estimating values follows similar arguments. The filled circles on Fig. 8 represent age steps of 100 Myr. As the stellar population ages, its V-band luminosity fades with only a small decrease in stellar mass from mass loss, moving the galaxy up in . Simultaneously the color reddens as the hot early-type stars with short lifetimes die. The dust vector indicating a reddening of mag runs parallel to the age track of the 1-component model. Ironically, the mass estimate benefits greatly from this degeneracy between age and dust in the optical. Under the assumption of a monotonic star formation history can uniquely be translated to , regardless of the precise role of dust or age. Only a normalization with is needed to derive the stellar mass. A similar relation was used by Rudnick et al. (2003) to translate the integrated color of high redshift galaxies into a global and stellar mass density . They found that the conversion to mass-to-light ratio is more robust from the color than from the or color.
What if the actual star formation history is more complex? What effect does it have on the derived stellar mass? There is ample evidence from local fossil records (e.g. Trager et al. 2000; Lancon et al. 2001; Freeman& Bland-Hawthorn 2002; Förster Schreiber et al. 2003; Angeretti et al. 2005) and high redshift studies (e.g. Papovich et al. 2001; Ferguson et al. 2002; Papovich et al. 2005) that galaxies of various types have complex and diverse star formation histories, often with multiple or recurrent episodes of intense star formation . Such a scenario is also predicted by cold dark matter models (e.g. Somerville, Primack,& Faber 2001; Nagamine et al. 2005; De Lucia et al. 2005). In order to address this question qualitatively, we consider the case of a 2-component population. At Gyr we added a burst of star formation to the model, lasting 100 Myr and contributing to the mass. To follow the evolution of the 2-component population closely, we mark 10 Myr timesteps with open circles. Over a timespan of only 10 Myr the galaxy color shifts by 1.6 mag towards the blue, while the value stays well above the 1-component corresponding to that color. As the newly formed stars grow older, the galaxy moves towards the upper right corner of the diagram again. The offset of with respect to the 1-component model is a decreasing function of . This means that if a bursty star formation is mistakenly fit with a 1-component model the mass and mass-to-light ratio are underestimated more for blue than for red galaxies, confirming what Shapley et al. (2005) found for a sample of star-forming galaxies at .
The histogram on the bottom of Fig. 8 indicates the color distribution of galaxies in the HDFS at . The population of Lyman-break galaxies (LBGs) is marked in blue, Distant Red Galaxies (DRGs) in red. The possible underestimate in mass-to-light ratio and thus mass is largest for blue galaxies, up to a factor of 3 for , the bluest color reached by this 2-component model. For DRGs only a modest amount of mass can be hidden under the glare of a young burst of star formation. The exact error that bursts cause depends on the form of the bursty star formation history (see e.g. Fig. 6 in Rudnick et al. 2003 for a different example).
We can now test whether rest-frame near-infrared photometry, as provided by IRAC, improves the constraints on the SED-based stellar mass estimates of high redshift galaxies. Labbé et al. (2005) found that the range in for DRGs and LBGs together is as large as a factor 6, meaning that a Spitzer -selected sample would be very different from a mass-selected sample. However, if a similar relation between mass-to-light ratio and color exists in the rest-frame near-infrared as in the rest-frame optical, this does not mean that the stellar mass estimate is uncertain by the same amount (a factor of 6). Here we consider whether the mass-to-light ratio can robustly be derived from a given rest-frame near-infrared color. We discuss only the rest-frame J-band but note that the results for rest-frame K are similar. In Fig. 9 we repeat the same exercise of drawing a versus color evolutionary track for the rest-frame near-infrared.
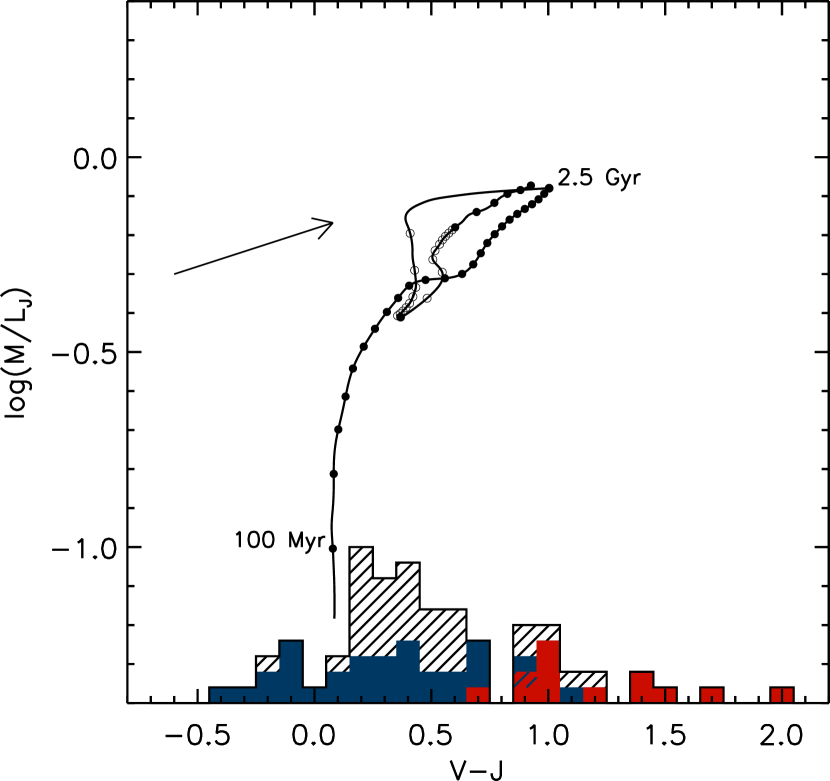
The burst that we superposed on the model after 2.5 Gyr is again contributing to the mass over a period of 100 Myr. Note that the scale is identical to that of Fig. 8. The histogram of sources at is derived from observed near- to mid-infrared wavelengths. During the first Gyr, the color hardly changes whereas does by a factor of 7. As an immediate consequence, the translation of into is highly uncertain for the blue galaxies in our sample and the additional IRAC observations do not improve the constraints on the mass-to-light ratio. The situation is further complicated by the effect of dust. is a lot more sensitive to dust than , illustrated by the dust vector of mag. The effects of dust and age no longer conspire to give robust mass estimates at a given color. At redder the situation improves as the slope of the age track flattens. Here the inclusion of a rest-frame NIR color clearly reduces the uncertainty in stellar that stems from the poor knowledge of the star formation history. The loop towards bluer colors is a magnitude smaller in size and we see no large offsets in between the 1- and 2-component modeling.
We have discussed the different behavior of dust and age in simplified 1- and 2-component models and have investigated the improvements expected from the inclusion of the rest-frame NIR with respect to the rest-frame optical. While additional rest-frame NIR data can lead to better estimates, in particular for redder galaxies (; ), it is clear that we need to take advantage of the full U-to- SED information to derive reliable estimates of stellar mass, stellar age and dust content.
5.1.2 Model dependence: Bruzual & Charlot vs Maraston
It is important to note that different stellar population synthesis models do not paint a consistent picture of evolution in the rest-frame near-infrared. To illustrate, we compare Bruzual & Charlot (2003; BC03) models to Maraston (2005; M05) models under the same assumption of Salpeter initial mass function and solar metallicity.
Whereas the age track in a versus diagram behaves similarly for M05 and BC03, the near-infrared evolution of a model looks very different (see Fig. 10).
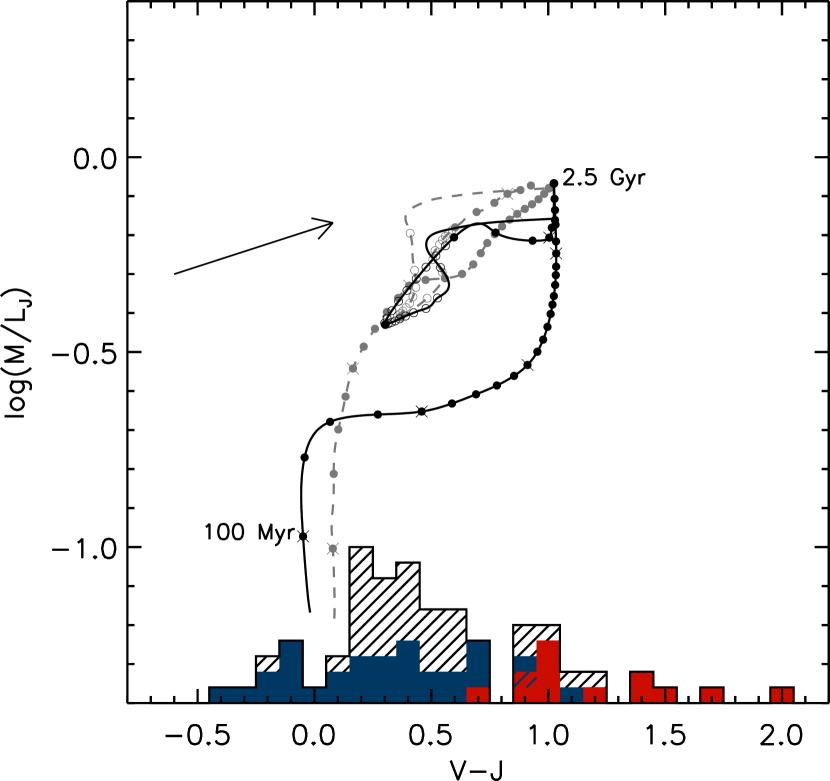
The grey dashed line represents the age track of a BC03 model with superposed burst at 2.5 Gyr as described in §5.1.1. In black we overplot the age track of a 2-component model with identical parameters by M05. In the Gyr age range the two models look strikingly different. At the same color the M05 model predicts values that are up to a factor 2.5 smaller than those of the BC03 model. The offset between as predicted from 1- and 2-component modeling is also larger by a similar factor. The BC03 and M05 models differ in several aspects: the stellar evolutionary tracks adopted to construct the isochrones, the synthesis technique and the treatment of the thermally pulsating Asymptotic Giant Branch (TP-AGB) phase. The Padova stellar tracks (Fagotto et al. 1994) used by BC03 include a certain amount of convective-core overshooting whereas the Frascati tracks (Cassisi et al. 1997) do not. The two stellar evolutionary models also differ for the temperature distribution of the red giant branch phase. The higher near-infrared luminosity originates mainly from a different implementation of the Thermally Pulsating Asymptotic Giant Branch (TP-AGB) phase (M05). Following the fuel consumption approach, M05 finds that this phase in stellar evolution has a substantial impact on the near-infrared luminosity at ages between and 2 Gyr. BC03 follow the isochrone synthesis approach, characterizing properties of the stellar population per mass bin. The latter method leads to smaller luminosity contributions by TP-AGB stars. We refer to recent studies from Maraston et al. (2005), van der Wel et al. (2006) and Maraston et al. (2006) for discussions of the model differences in greater detail.
For our purpose it is sufficient to state that a given color corresponds to younger ages, lower mass-to-light ratios and thus lower masses for the M05 model than for the BC03 model. Most importantly, we note that for M05 models inclusion of NIR data does not reduce stellar mass uncertainties caused by the unknown star formation history.
5.2. Constraints on mass, dust and age from modeling our observed galaxies
5.2.1 Wavelength dependence: optical vs near-infrared
Having investigated the qualitative relationship between and the rest-frame optical-to-NIR color in §5.1.1, we now quantify the effect of inclusion of IRAC MIR photometry on the stellar population constraints of galaxies at . Our goal is to investigate whether and how the addition of IRAC imaging changes our best estimate of the stellar population properties and their confidence intervals.
First we compare the distribution of stellar mass, dust content and mass-weighted stellar age as fit with or without IRAC.
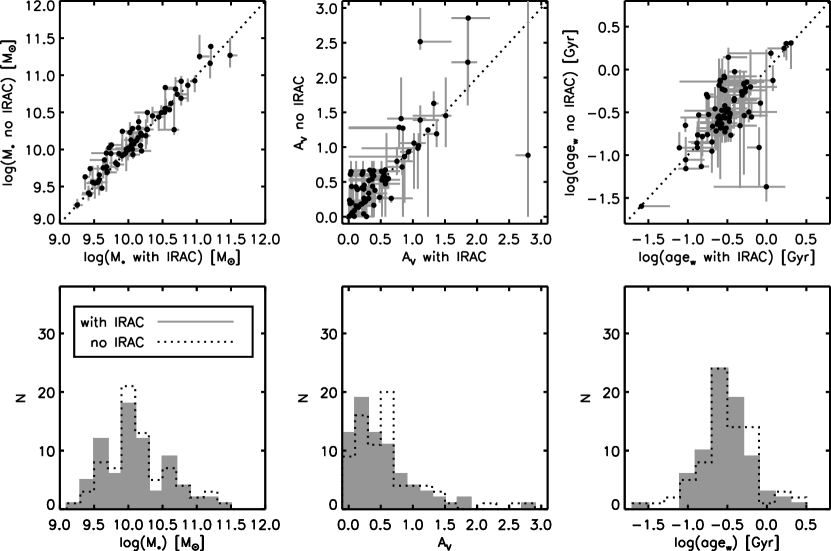
The upper row of Fig. 11 shows a direct comparison of the inferred model parameters with or without IRAC photometry for all galaxies at . The filled histogram in the lower row of Fig. 11 shows the distribution of mass, dust extinction and age derived from the full U-to- SED. The dotted line indicates the distribution of best-fitting parameters from modeling the U-to-K photometry. Both the median and the width of the distribution stays the same for all three parameters. Defining the difference between mass, mass-weighted age, and as , , and we find a median and normalized median absolute deviation (equal to the rms for a gaussian distribution) of , , and respectively. The average and standard deviation of , and are , and respectively. Thus the differences for the galaxy sample as a whole after including IRAC are very small. The results for stellar mass are similar to what Shapley et al. (2005) found for a more specific sample of optically selected star-forming galaxies at .
Having determined that the overall distribution of best-fit age, dust content and stellar mass does not change after including IRAC, the question remains whether IRAC helps to improve the constraints on the stellar population characeristics for individual galaxies. We address this question using the measure , defined as the ratio of confidence intervals without and with IRAC. The confidence intervals, representing random uncertainties propagating from photometric errors, are derived from Monte Carlo simulations. For each galaxy SED we create 100 mock SEDs where the flux-point in each band is randomly drawn from a Gaussian with the measured flux as the mean, and its error as the standard deviation. Next, each SED was fit with the same fitting procedure as the observed version. As we want to isolate the effect of including IRAC observations on the confidence intervals we fix the redshift to (or where available). In calculating we measure the confidence interval in log-space for stellar mass and mass-weighted age and in magnitude for . Furthermore we set a lower limit to the confidence intervals to account for the discreteness of our models, i.e. age and steps.
Fig. 12 shows the values of for mass, age and dust content as a function of rest-frame color for the galaxies at .
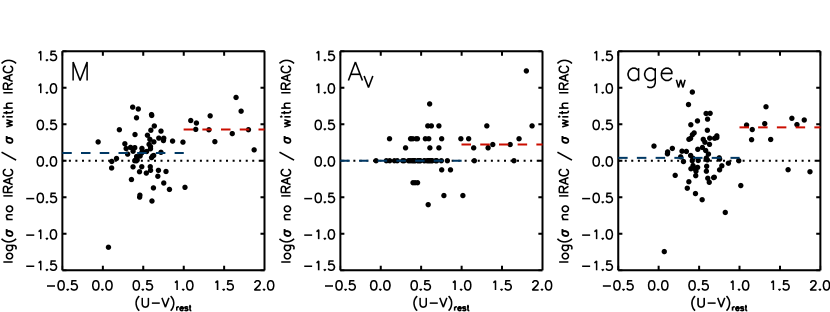
We divide the sample into a blue and red bin and indicate the median reduction of confidence intervals for each bin with dashed lines. The separation between blue and red is chosen to be , corresponding to the oberved color cut for Distant Red Galaxies at the median redshift of our sample . We find that the typical improvement of confidence intervals is dependent on galaxy color for all considered stellar population parameters. For red galaxies, the reduction amounts to a median factor of 2.7, 1.7 and 2.9 in the case of stellar mass, and age respectively. For blue galaxies the reduction of the mass confidence interval is only a factor 1.3, though with a large scatter, while for and age no median reduction is found. With the color tracks of the stellar population models in mind (see Fig. 8-9) this color dependence should come as no surprise. We demonstrated in §5.1.1 that for blue galaxies optical to near-infrared colors are degenerate with the mass-to-light ratio. Hence, the IRAC bands of blue galaxies contribute little information about their mass.
For a sample of (generally blue) optically selected star-forming galaxies at Shapley et al. (2005) found a reduction in stellar mass uncertainties by a factor due to the addition of IRAC photometry, which seems like a contradiction. However, the distribution of observed color of their galaxies extends towards redder colors than the Lyman-break galaxies (LBGs) in our sample, which may partly explain the larger improvement than we find for blue LBGs. Another important difference is that Shapley et al. (2005) lacked J and H images and hence did not probe rest-frame or for their galaxies. It is possible that the lack of the near infrared J and H bands in Shapley et al. (2005) is the main reason for the discrepancy. We simulated this effect by omitting J and H and repeating the Monte Carlo simulations with and without IRAC. The median reduction of the mass confidence interval now increases to a factor 1.9 when including IRAC.
We conclude that, in the presence of very deep observed J, H and K photometry, inclusion of mid-infrared data places little extra constraints on the stellar populations of blue galaxies. However, for galaxies redder than , IRAC reduces the confidence interval by a substantial factor .

5.2.2 Model dependence: Bruzual & Charlot vs Maraston
In §5.1.2 we pointed out strong differences in the rest-frame optical-to-NIR colors between the BC03 and M05 models. In this paragraph we quantify how our results change if we use M05 models. The median and normalized median absolute deviation, average and standard deviation of the differences between BC03 fits and M05 fits (, and ) are summarized in Table 5.
| median() | mean() | |||
|---|---|---|---|---|
| 0.06 | 0.08 | |||
| 0.00 | 0.19 | |||
| 0.17 | 0.18 |
As expected, the BC03 models predict older ages and thus higher stellar masses than the M05 models for our galaxies. The estimated mass for the M05 models is systematically lower by a factor 1.4. Maraston et al. (2006) found a similar discrepancy for a sample of 7 galaxies in the Hubble Ultra Deep Field that satisfy the BzK criterion (Daddi et al. 2004) for passively evolving galaxies. Apart from a systematic shift a scatter of 0.1 in dex is found in , meaning the choice of stellar population synthesis model introduces a considerable systematic uncertainty.
It is of great importance to test whether correlates with redshift, color or stellar mass, since such dependencies, if present, could bias studies of galaxy evolution or trends with mass. In Fig. 13 we plot versus redshift, color, and stellar mass (the latter derived from BC03 models). We show galaxies with at (open symbols) and at (filled symbols); no evidence for a redshift dependence is found. For the (middle) and stellar mass (right) panel, the p-values for statistical significance from the Spearman rank order correlation test are also larger than 0.05, meaning no significant correlation is found. Fitting a line to the points in the versus diagram, a difference of 0.06 dex in is found over the 2 mag range in color spanned by the galaxies in our sample. Even if a trend of increasing with redder color is real, it only introduces a small bias of the order of 15%. A similar conclusion can be drawn for the dependence on stellar mass.
5.2.3 Metallicity dependence
We test how variations from solar metallicity affect the estimates of stellar mass, mass-weighted age and dust extinction. We study the effect of a different metal abundance by fitting BC03 templates with metallicity to the observed SEDs, leaving the extinction law to Calzetti et al. (2000). NIR spectroscopy of DRGs (van Dokkum et al. 2004) and LBGs (Erb et al. 2006a) indicates that a range of is appropriate for galaxies at . Furthermore, at metallicities below the tracks and spectral libraries used to build the BC03 templates become more uncertain by lack of observational constraints. Decreasing the metallicity from to lowers the estimated stellar masses of galaxies at by 0.1 dex, leads to a mass-weighted age that is typically lower by 0.2 dex, and is compensated by an average increase in of 0.2 mag. The fact that age estimates are more strongly affected than estimates of stellar mass when changing the assumed metallicity was demonstrated in detail by Worthey (1994). While absolute values of ages and dust extinctions may be biased as just described, the relative age and dust trends within the galaxy population as discussed in §4 based on the standard SED modeling (see §3) are robust.
5.2.4 Dependence on extinction law
The Calzetti et al. (2000) extinction law was empirically derived from observations of local starburst galaxies. We quantify the variations in stellar population properties due to the adopted extinction law by comparing our modeling results with a Calzetti et al. (2000) law to those obtained with reddening laws from Fitzpatrick (1986) for the Large Magellanic Cloud (LMC) and Prévot et al. (1984) for the Small Magellanic Cloud (SMC), leaving the metallicity to solar. Stellar masses, mass-weighted ages and values of galaxies at derived with the LMC law models are similar to those obtained with the Calzetti et al. (2000) law. The SMC law, which rises more steeply towards shorter wavelengths in the near-UV, gives similar mass estimates, values that are on average smaller by 0.3 mag and mass-weighted stellar ages that are older by 0.23 dex, with the ages of the oldest galaxies being limited by the age of the universe constraint. As for metallicity, we conclude that using a different extinction law has a larger impact on the age estimates than on estimates of stellar mass.
6. Stellar mass - optical color relation
In this section we study the relation between the rest-frame optical color of high redshift galaxies and their stellar mass. We start with a model-independent approach, plotting rest-frame versus rest-frame magnitude for all galaxies at in Fig. 14.
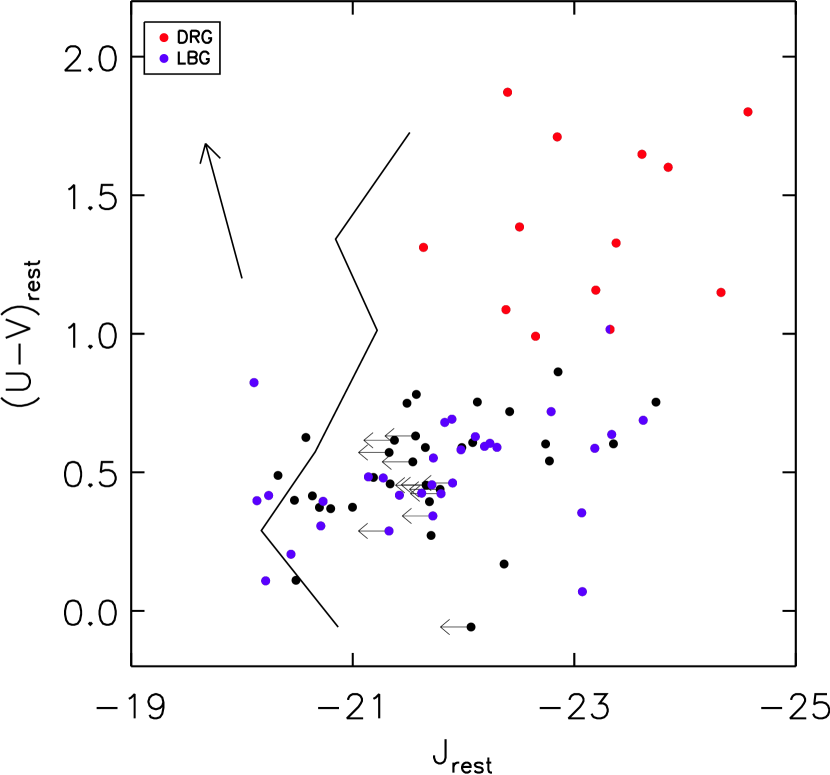
The emission of low mass long-lived stars that make up the bulk of the mass in a galaxy peaks in the rest-frame near-infrared. is therefore expected to be a reasonably good tracer of stellar mass. The galaxies that satisfy the DRG selection criterion (red symbols) are found at redder than the Lyman-break galaxies (blue symbols). The reddest colors are found at the brightest magnitudes. Note however that the observed trend is partially driven by the K-band selection of our sample. The line on Fig. 14 indicates at which magnitude a galaxy with identical colors to our observed galaxies would fall out of the sample. Even if we only consider galaxies brighter than the limiting to which we are complete over the whole color range, we find that galaxies redder than are 1 mag brighter than galaxies with , significant at the level. Studying a sample without color bias (as advocated by van Dokkum et al. 2006) proves crucial to pick up the trend of with . We note that Meurer et al. (1999) found that LBGs with higher rest-frame UV luminosities tend to have redder rest-frame UV colors, illustrating that, while trends of color with luminosity are most notable in samples without color bias, they are still present in at least some color selected samples.
If is a reasonable tracer of stellar mass, we expect to see a similar or stronger trend of with the stellar mass. This is shown in Fig. 15.
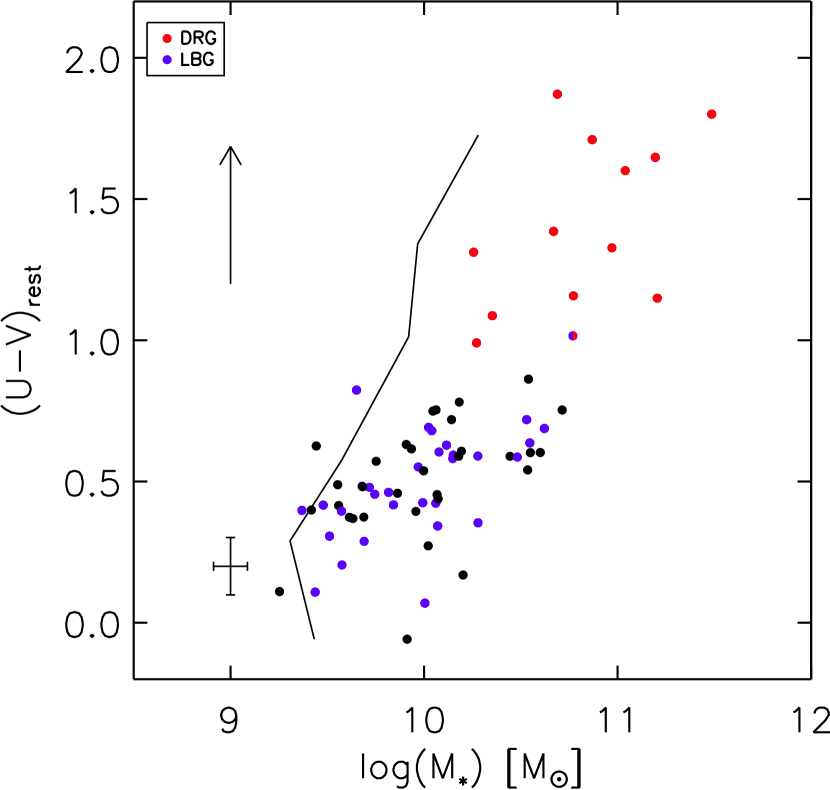
The plotted mass is derived from 1-component SED modeling of the U-to- SED as described in §3. The typical error bar is indicated in the lower left corner. The depth of our K detection band allows us to probe stellar masses from down to . A correlation of with stellar mass is clearly visible. The most massive galaxies have a red optical color. Lyman-break galaxies and other blue galaxies at high redshift contain typically 5 times less stellar mass than the DRGs in our sample. Again the K-band selection of our sample (solid line) limits our ability to detect faint red galaxies. Therefore we can not exclude the presence of low-mass red galaxies. The lack of massive blue galaxies seems to be real. Rigopoulou et al. (2006) find a co-moving density of for LBGs with at an average redshift , consistent with the absence of such massive but rare LBGs in our sample.
However, the lack of massive blue galaxies could be an artifact of our choice of simple star formation histories. As demonstrated in §5.1.1 a severe underestimate of the stellar mass is possible when the true star formation history is more complex than that of the modeled 1-component stellar population. When a young burst of star formation is superposed on a maximally old population, its blue light will dominate the color and the mass from the underlying population will be hidden. In order to constrain the possible underestimate in mass, we fit 2-component models to our SEDs. Erb et al. (2006b) describe a procedure to achieve this in two steps, where first a maximally old population is fit to the K(+IRAC) data and subsequently a young population is fit to the (primarily UV) residual. However, this procedure does not guarantee a good fit in the sense. Instead, we decided to perform a simultaneous fit of both old and young components. We constructed template SEDs consisting of a maximally old single stellar population with a recent burst of star formation that started 100 Myr ago and lasted till the moment of observation superposed. We made templates where the mass fraction created in the burst is with x going from -6 to 2 in steps of 1. We assume that the same reddening by dust applies to the old and the young population, with ranging from 0 to 3 in steps of 0.2. Without this assumption, one could in principle hide an infinite amount of mass in an old population as long as an optically thick medium is shielding it from our sight. However, such a scenario is physically implausible. Since we are interested in an upper limit on the mass, as opposed to the most likely value, we do not search for the least-squares solution over all x. Instead we perform the fit for every burst fraction and select the highest mass that still has .
Fitting the 2-component models to the U-to- SEDs of our galaxy sample at , we indeed see that a higher stellar mass is allowed when more complex star formation histories are adopted (Fig. 16).

The upper bound on stellar mass that we derive from this particular 2-burst model is in the median a factor 1.7 higher than the 1-component estimate for galaxies redder than . For blue galaxies the median increase is a factor 2.1. Despite the fact that more mass can be hidden in blue galaxies, a trend of optical color with stellar mass remains visible. We performed a Mann-Whitney U-test to compare the colors of galaxies with different stellar mass. We conservatively adopted the 1-component stellar mass for galaxies with and the 2-component upper limit for objects with . To avoid selection effects we only consider galaxies more massive than . Dividing them in two mass bins with an equal number of objects the Mann-Whitney U-test (Walpole & Myers 1985) confirms at a significance level that the mean of the distributions differs. Applying the same 2-component models to the U-to-K SEDs (omitting IRAC), the median upper mass estimate increases to a factor 2.3 above the 1-component estimate for red objects and a factor 3.7 for blue objects. We conclude that, as expected from §5.1.1, more mass can be hidden in blue than in red galaxies, but this effect is insufficient to remove the trend of stellar mass with color. Furthermore, the amount of mass that can be hidden is constrained by addition of IRAC photometry.
The color dependence that we derive for the amount of mass that can be hidden in an underlying old population confirms findings from Shapley et al. (2005) based on a sample of star-forming galaxies at . The predominance of distant red galaxies at the high-mass end was illustrated recently by van Dokkum et al. (2006) using a mass-selected sample of galaxies at with . Only with very deep imaging such as that of the HDFS analyzed in this paper it is possible to probe down to lower masses and prove that the most massive galaxies have red colors compared to lower mass galaxies.
7. Summary
We investigated the rest-frame optical to near-infrared color distribution of galaxies up to in the Hubble Deep Field South. At all redshifts, galaxies with redder tend to have redder , as is the case in the local universe. At colors comparable to that of local galaxies, the color distribution of distant galaxies extends to redder . At the population of galaxies at the red end is well described by dust-enshrouded star-forming models, whereas galaxies with similar to that of local galaxies are consistent with old passively evolving systems. We conclude that alone allows us to isolate blue relatively unobscured star-forming galaxies, but addition of is necessary to distinguish young dusty from old passively evolved systems. At redshifts above , this means IRAC observations are crucial in understanding the wide variety in stellar populations. We note that our analysis is not subject to uncertainties due to field-to-field variations, but surveys over much larger areas are needed to study the relative contributions of galaxies with different stellar populations.
We analyzed the constraints that IRAC places on stellar mass, stellar age and dust content of galaxies at . No evidence is found for systematic offsets when determining the stellar population characteristics with or without IRAC. However, the ratio of confidence intervals on stellar mass, mass-weighted age and dust extinction is typically reduced by a factor 2.7, 2.9 and 1.7 respectively for red () galaxies. In general, IRAC does not provide stronger constraints for blue galaxies () when very deep near-infrared imaging is available (as is the case for the HDFS).
We caution that, in characterizing the stellar populations using M05 models, we find stellar masses that are typically a factor 1.4 lower than for BC03 models with a scatter of 0.1 in dex.
A trend of brighter with redder is observed for galaxies at , where the near-infrared luminosity serves as a (imperfect but model-independent) tracer for stellar mass. Plotting versus modeled stellar mass, we arrive at a similar conclusion: the most massive galaxies in our sample have red rest-frame optical colors. A possible concern is that this trend with mass is caused by our simplistic choice of star formation histories. When we allow for more complex star formation histories, more mass can be hidden than in the case of a 1-component stellar population and the amount depends on the color of the galaxy. We used 2-component stellar populations, consisting of a maximally old population with a young population superposed, to set an upper bound on the stellar mass present. Even though relatively more mass can be hidden in blue galaxies compared to red galaxies, under the assumption of an equal dust reddening of the young and old component, a trend of increasing to redder colors with stellar mass remains visible.
References
- (1) Adelman-McCarthy, J. K. et al. 2006, ApJS, 162, 38
- (2) Angeretti, L., Tosi, M., Greggio, L., Sabbi, E., Aloisi, A.,& Leitherer, Claus 2005, AJ, 129, 2203
- (3) Baldry, I. K., Glazebrook, K., Brinkmann, J., Ivezić, Z̆., Lupton, R. H., Nichol, R. C.,& Szalay, A. S. 2004, ApJ, 600, 681
- (4) Bell, E. F.,& de Jong, R. S. 2001, ApJ, 550, 212
- (5) Blanton, M. R., et al. 2003, ApJ, 594, 186
- (6) Blanton, M. R., et al. 2005, AJ, 129, 2562
- (7) Bolzonella, M., Miralles, J.-M.,& Pelló, R. 2000, A&A, 363, 476
- (8) Bruzual, G.,& Charlot, S. 2003, MNRAS, 344, 1000 (BC03)
- (9) Bundy, K., Ellis, R. S.,& Conselice, C. J. 2005, ApJ, 625, 621
- (10) Calzetti, D., et al. 2000, ApJ, 533, 682
- (11) Cassisi, S., Castellani, M.,& Castellani, V. 1997, A&A, 317, 108
- (12) Coleman, G. D., Wu, C.-C.,& Weedman, D. W. 1980, ApJS, 43, 393
- (13) Cutri, R. M., et al. 2000, The 2MASS Explanatory Supplement (Pasadena: IPAC),
- (14) http://www.ipac.caltech.edu/2mass/releases/allsky/doc/explsup.html
- (15) Daddi, E., Cimatti, A., Renzini, A., Fontana, A., Mignoli, M., Pozzetti, L., Tozzi, P.,& Zamorani, G. 2004, ApJ, 617, 746
- (16) De Lucia, G., Springel, V., White, S. D. M., Croton, D.,& Kauffmann, G. K. 2006, MNRAS, 366, 499
- (17) Drory, N., Salvato, M., Gabasch, A., Bender, R., Hopp, U., Feulner, G.,& Pannella, M. 2005, ApJ, 619, 131
- (18) Erb, D. K., et al. 2003, ApJ, 591, 101
- (19) Erb, D. K., Shapley, A. E., Pettini, M., Steidel, C. C., Reddy, N. A.,& Adelberger, K. L. 2006a, ApJ, 644, 813
- (20) Erb, D. K., Steidel, C. C., Shapley, A. E., Pettini, M., Reddy, N. A.,& Adelberger, K. L. 2006b, ApJ, 646, 107
- (21) Fagotto, F., Bressan, A., Bertelli, G.,& Chiosi, C. 1994, A&AS, 104, 365
- (22) Fazio, G. G., et al. 2004, ApJS, 154, 10
- (23) Ferguson, H. C., Dickinson, M., Papovich, C. 2002, ApJ, 569, 65
- (24) Fitzpatrick, E. L. 1986, AJ, 92, 1068
- (25) Förster Schreiber, N. M., et al. 2003, ApJ, 599, 193
- (26) Förster Schreiber, N. M., et al. 2004, ApJ, 616, 40
- (27) Franx, M., et al. 2003, ApJ, 587, L79
- (28) Freeman, K.,& Bland-Hawthorn, J., 2002, ARA&A, 40, 487
- (29) Glazebrook, K., et al. 2004, Nature, 430, 181
- (30) Hora, J. L., et al. 2004, Proc. SPIE, 5487, 77
- (31) Kauffmann, G., et al. 2003, MNRAS, 341, 54
- (32) Kriek, M., et al. 2006, ApJ, 645, 44
- (33) Kinney, A. L., et al. 1996, ApJ, 467, 38
- (34) Labbé, I., et al. 2003, AJ, 125, 1107
- (35) Labbé, I., et al. 2005, ApJ, 624, L81
- (36) Lancon, A., et al. 2001, ApJ, 552, 150
- (37) Madau, P., et al. 1996, MNRAS, 283, 1388
- (38) Maraston, C. 2005, MNRAS, 362, 799
- (39) Meurer, G. R., Heckman, T. M.,& Calzetti, D. 1999, ApJ, 521, 64
- (40) Nagamine, K., Cen, R., Hernquist, L., Ostriker, J. P.,& Springel, V. 2005, ApJ, 627, 608
- (41) Papovich, C., Dickinson, M., & Ferguson, H. C. 2001, ApJ, 559, 620
- (42) Papovich, C., Dickinson, M., Giavalisco, M., Conselice, C. J.,& Ferguson, H. C. 2005, ApJ, 631, 101
- (43) Papovich, C., et al. 2006, ApJ, 640, 29
- (44) Prévot, M. L., Lequeux, J., Prévot, L., Maurice, E.,& Rocca-Volmerange, B. 1984, A&A, 132, 389
- (45) Rigopoulou, D., et al. 2006, ApJ, 648, 81
- (46) Rudnick, G., et al. 2001, AJ, 122, 2205
- (47) Rudnick, G., et al. 2003, ApJ, 599, 847
- (48) Rudnick, G., et al. 2006, ApJ, in press (astro-ph/0606536)
- (49) Salpeter, E. E. 1955, ApJ, 121, 161
- (50) Shapley, A. E., et al. 2001, ApJ, 562, 95
- (51) Shapley, A. E., et al. 2003, ApJ, 588, 65
- (52) Shapley, A. E., et al. 2005, ApJ, 626, 698
- (53) Smail, I., Chapman, S. C., Blain, A. W.,& Ivison, R. J. 2004, ApJ, 616,71
- (54) Somerville, R. S., Primack, J. R.,& Faber, S. M. 2001, MNRAS, 320, 504
- (55) Steidel, C. C., et al. 1996, ApJ, 462, L17
- (56) Steidel, C. C., et al. 1999, ApJ, 519, 1
- (57) Trager, S. C., Faber, S. M., Worthey, G.,& González, J. J. 2000, AJ, 120, 165
- (58) van der Wel, A., Franx, M., van Dokkum, P. G., Rix, H.-W., Illingworth, G. D.,& Rosati, P. 2005, ApJ, 631, 145
- (59) van der Wel, A., et al. 2006, in press (astro-ph/0607649)
- (60) van Dokkum, P. G., et al. 2006, ApJ, 638, 59
- (61) Walpole, R. E.,& Myers, R. H. 1985, Probability and Statistics for Engineers and Scientists, edition (Macmillan Publishing Company)
- (62) Webb, T. M., et al. 2006, ApJ, 636, 17
- (63) Werner, M. W., et al. 2004, ApJS, 154, 1
- (64) Yan, H., et al. 2004, ApJ, 616,63