PAPPA: Primordial Anisotropy Polarization Pathfinder Array
Abstract
The Primordial Anisotropy Polarization Pathfinder Array (PAPPA) is a balloon-based instrument to measure the polarization of the cosmic microwave background and search for the signal from gravity waves excited during an inflationary epoch in the early universe. PAPPA will survey a patch at the North Celestial Pole using 32 pixels in 3 passbands centered at 89, 212, and 302 GHz. Each pixel uses MEMS switches in a superconducting microstrip transmission line to combine the phase modulation techniques used in radio astronomy with the sensitivity of transition-edge superconducting bolometers. Each switched circuit modulates the incident polarization on a single detector, allowing nearly instantaneous characterization of the Stokes I, Q, and U parameters. We describe the instrument design and status.
keywords:
cosmology , cosmic microwave background , polarization , instrumentation1 Introduction
Linear polarization of the cosmic microwave background (CMB) carries the oldest information in the universe. Quantum fluctuations of the space-time metric (gravity waves) excited only seconds after the Big Bang impart a distinctive signature to the CMB polarization. Detecting this signal probes physics at energies near Grand Unification and could provide insight on quantum gravity.
CMB polarization results from Thomson scattering of CMB photons by free electrons. Scattering of an isotropic radiation field produces no net polarization, but a quadrupole moment in the incident radiation yields a polarized signal. The required quadrupole can result from either intrinsic fluctuations in the radiation field itself, or the differential redshift as gravity waves propagate through an isotropic medium. Temperature or density perturbations are scalar quantities; their polarization signal must therefore be curl-free. Gravity waves, however, are tensor perturbations whose polarization includes both gradient and curl components. In analogy to electromagnetism, the scalar and curl components are often called “E” and “B” modes. Only gravity waves induce a curl component: detection of a B-mode signal in the CMB polarization field is recognized as a “smoking gun” signature of inflation, testing physics at energies inaccessible through any other means kamionkowski/etal:1997 ; seljak/zaldarriaga:1997 .
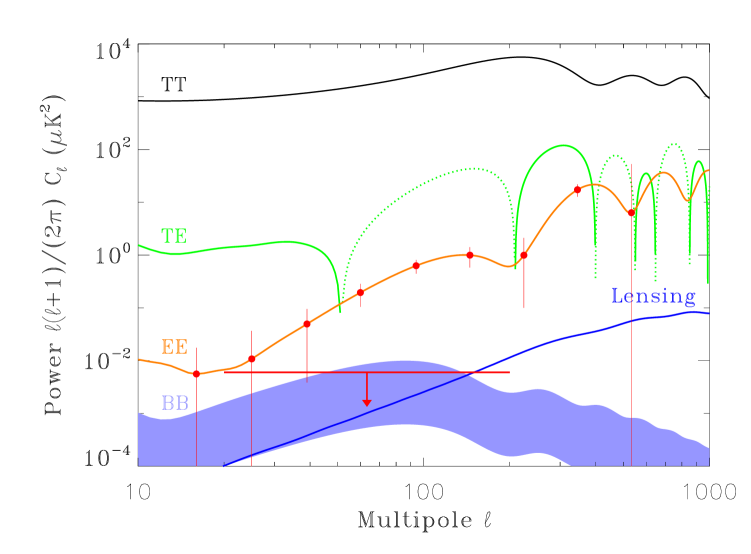
Figure 1 shows the power spectra for the temperature and polarization. E-mode polarization depends on the quadrupole anisotropy of the temperature distribution seen by each scatterer within its horizon. The temperature distribution is observed to be anisotropic and the physics of Thomson scattering is well understood; hence, the CMB must be partially polarized with E-mode amplitude predictable from the temperature anisotropy and background cosmology. Polarization at the predicted amplitude was first observed by the DASI collaboration kovac/etal:2002 and later confirmed by multiple experiments.
Recent results from the WMAP mission suggest that an observable gravity-wave signature should exist. Quantum-mechanical fluctuations in the inflaton field produce both density perturbations and gravity waves. The transition out of the inflationary epoch breaks pure scale invariance; the resulting signature in the scalar density perturbations can be used to estimate the accompanying signal from tensor gravity waves. Given the WMAP measurement of a deviation from scale invariance, the simplest inflation models predict gravity waves with tensor/scalar ratio in the range spergel/etal:2006 ; linde:2005 ; lyth/riotto:1999 . The corresponding B-mode signal has RMS amplitude 30–100 nK at degree angular scales. Signals at this level can be detected by a dedicated polarimeter, providing a crucial test of inflationary physics.
Detecting the gravity-wave signature in polarization will be difficult. The first challenge is sensitivity. The gravity-wave signal is faint compared to the fundamental sensitivity limit imposed by photon arrival statistics. Even noiseless detectors suffer from this photon-counting limit; the only solution is to use multiple independent detectors. Equally important is the control of systematic errors. Aliasing of power from either unpolarized sources or the dominant E-mode polarization into a spurious B-mode pattern could overwhelm the primordial signal. The Primordial Anisotropy Polarization Pathfinder Array (PAPPA) uses phase-sensitive switching techniques to combine the sensitivity of transition-edge superconducting detectors with rigorous control of potential systematic errors. With no macroscopic moving parts, PAPPA is scalable to the kilo-pixel arrays anticipated for an eventual space mission dedicated to CMB polarimetry.
2 Instrument Description
PAPPA will consist of an array of 32 “polarimeters-on-a-chip” in 3 frequency bands centered at 89, 212, and 302 GHz. Each pixel uses phase-delay microcircuits coupled to the sky using corrugated feed horns and a 60-cm off-axis primary mirror to produce 05 beams on the sky. Each circuit periodically injects a half-wave phase delay between orthogonal polarization components launched into superconducting microstrip, which are then combined and detected using transition-edge superconducting bolometers. A planar polarimeter allows rigorous control of systematic errors. The design is easily implemented in microstrip, so that all elements (including the phase switch) are at the same temperature as the detector. The modulation can be very fast (100 Hz), reducing the effects of slow drifts in the readout electronics. The synchronously demodulated output is proportional only to the linearly polarized part of the sky signal – uncertainties in the detector responsivity only affect the estimated amplitude of any polarized signal, but can not generate a false polarization signal from an unpolarized sky. The entire polarimeter can be fabricated using photolithographic techniques, making it well suited for large array formats.
2.1 Polarization Modulation
Consider an incident plane wave
| (1) |
with component amplitude and in the and directions, respectively. We can describe the polarization state using the Stokes parameters
| (2) |
where the brackets indicate integration over a time long compared to the frequency . If the phases and differ by a multiple of , then the direction of the vector in the xy plane is fixed in time, and the wave is linearly polarized.
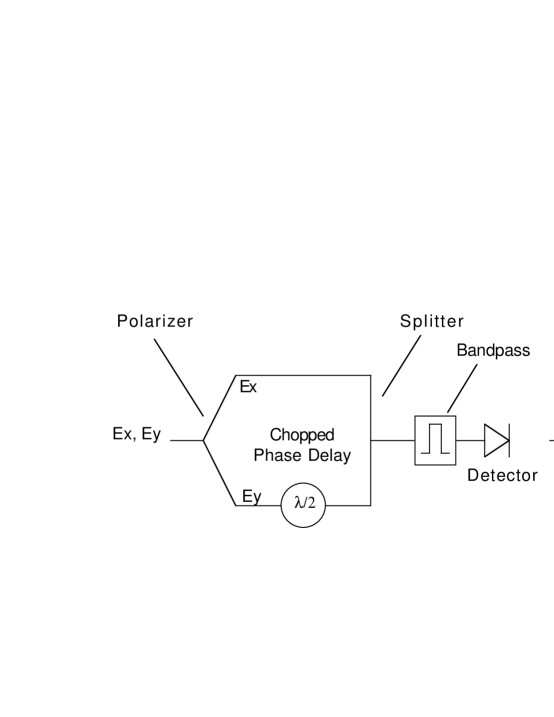
Reliable characterization of faint polarization requires modulating the signal on a single detector on time scales short compared to instrumental drifts, noise, or the motion of the beams across the sky. A phase-sensitive design allows measurement of linear polarization while maintaining rigorous control of systematic errors. Figure 2 illustrates the concept. A polarizing microstrip element (e.g., orthogonal probes in a resonant structure) launches voltages into two arms of the polarimeter, proportional to the electric field amplitudes and . A half-wave phase switch alternately injects a phase delay or in one arm. The voltages from the two arms are then combined before square-law detection. When the phase switch is off, the voltages in the two arms are
| (3) |
where and is the angle between the linearly polarized incident field and the coordinate system of the polarimeter. The detector power is
| (4) | |||||
up to an uninteresting constant phase. When the phase switch is on, it introduces an additional half-wave path length so that . The detector power is then
| (5) |
As the switch chops, the detector produces a slowly-varying offset
| (6) | |||||
proportional to the unpolarized intensity, plus a rapidly modulated term
| (7) | |||||
proportional to the linear polarization (Stokes U). We thus unambiguously separate the polarized and unpolarized components in a single measurement with a single detector.
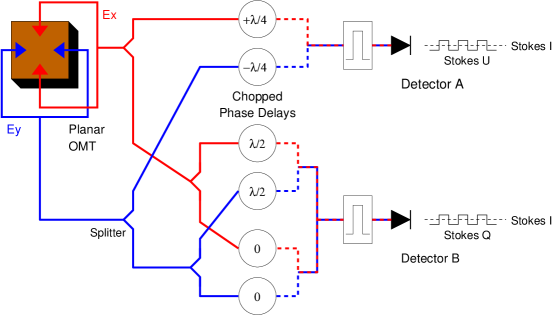
The concept can readily be extended to provide simultaneous measurements of the Stokes I, Q, and U parameters. Figure 3 shows the circuit implemented for PAPPA. A polarizing element again launches voltages onto microstrip components proportional to the and components of the incident electric field. Each component is then split to separate detection chains. Detector A (top) is identical to the IU polarimeter in Figure 2. Detector B has an additional pair of phase switches run out of phase with each other (e.g., S1 has phase delay 0 when S2 has delay , or else S1 has phase delay when S2 has delay 0). As switches S1 and S2 chop, detector B has a dc term proportional to Stokes I, and a modulated term proportional to the Stokes Q parameter. By simultaneously measuring I, Q, and U, PAPPA fully characterizes the incident linear polarization. This decoupling of the polarization measurement from the instrument orientation or beam scan motion greatly reduces the problem of aliasing unpolarized anisotropy into a spurious polarization signal.
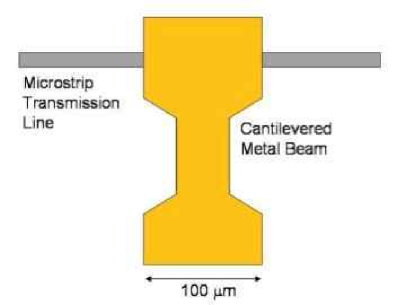
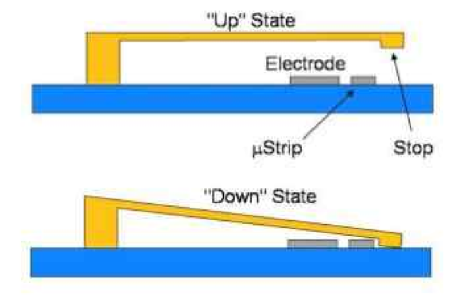
Microstrip delay lines of different path length provide a simple, convenient way to produce such a phase shift. Switched capacitors couple to the transmission line to short out a delay line of length /2 or . Micro Electro Mechanical Systems (MEMS) switches are a demonstrated technology capable of producing the required modulation. MEMS switches are miniature surface micromachined components providing controlled motion over a short distance to create either an open circuit or a short across a transmission line. Figure 4 shows a MEMS capacitive switch for the sub-mm phase modulator. It consists of a metal beam 300 m 100 m 1 m thick cantilevered 1 m above the transmission line. An electrostatic voltage applied to a pull-down electrode pulls the beam down until it is stopped by metal posts some 0.25 m above the transmission line. The change in gap height between the “up” and “down” states determines the change in capacitance; we achieve acceptable performance with ratio 4:1 or greater. The design is tolerant to changes in the “up” state capacitance.
2.2 Optics and Cryostat
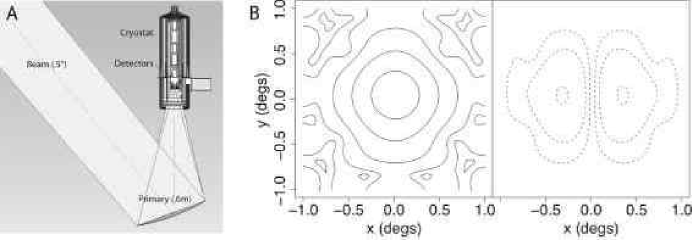
Figure 5 shows the PAPPA optical design. PAPPA uses a single 60 cm off-axis primary mirror to focus light from the sky onto the cryogenic focal plane. An array of 1.5K corrugated feed horns at the primary focus couples light from the telescope to the 100 mK microstrip. Use of a single warm reflector minimizes thermal loading on the detectors, providing a significant reduction in noise. The illumination of the feedhorns on the primary mirror allows -30 dB edge taper. Figure 5 shows the calculated co-polar and cross-polar response of the beams on the sky. The cross-polar response is small: end-to-end simulations show that spurious B-modes resulting from power aliased out of the dominant E-mode signal by beam imperfections will be more than 2 orders of magnitude below the PAPPA noise limit.
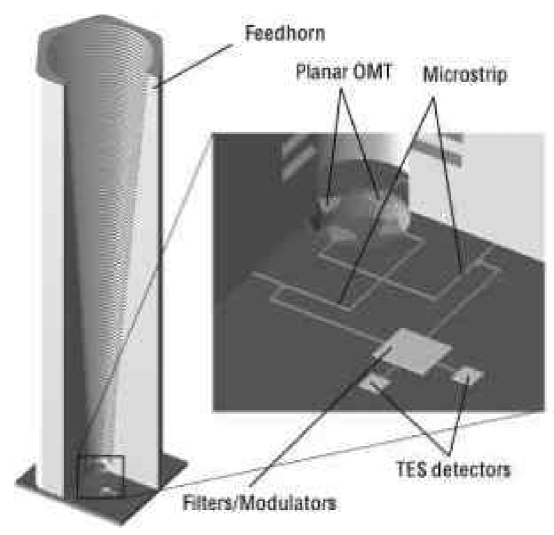
Figure 6 shows a single PAPPA pixel. A planar ortho-mode transducer (OMT) in a resonant cavity behind the feedhorn array launches orthogonal polarizations into superconducting niobium microstrip lines. A quarter-wave backshort reflects incident radiation onto orthogonal microstrip probes while simultaneously serving as a thermal gap between the 1.5 K feedhorn array and the 100 mK microstrip circuit. A gap also avoids impulsive heating of the focal plane and detectors from cosmic ray hits within the feedhorn volume. We reconcile the wavelength-dependent spacing for the backshort with the use of 3 different frequency bands by breaking the focal plane assembly into 3 separate sub-assemblies, one for each band. Each polarimeter will use transition-edge superconducting (TES) bolometers at 100 mK as square-law detectors for the phase circuit. Figure 7 shows the measured noise from a prototype Mo:Cu device. We measure noise within a few percent of the thermodynamic limit, with noise equivalent power W Hz-1/2 and time constant ms.
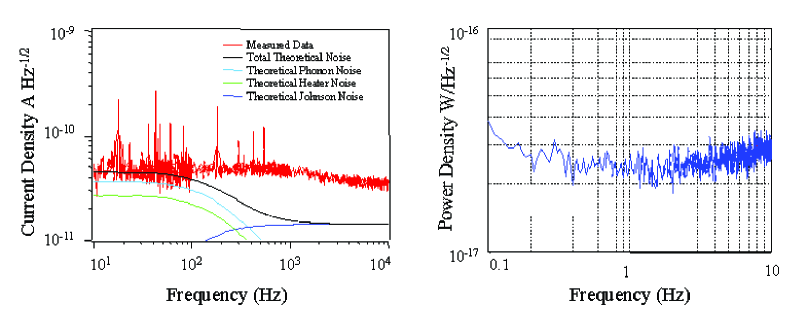
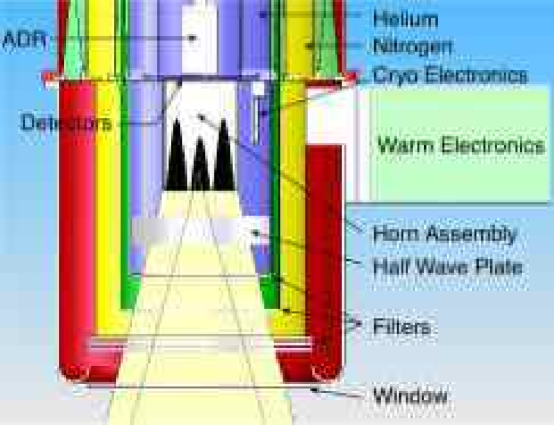
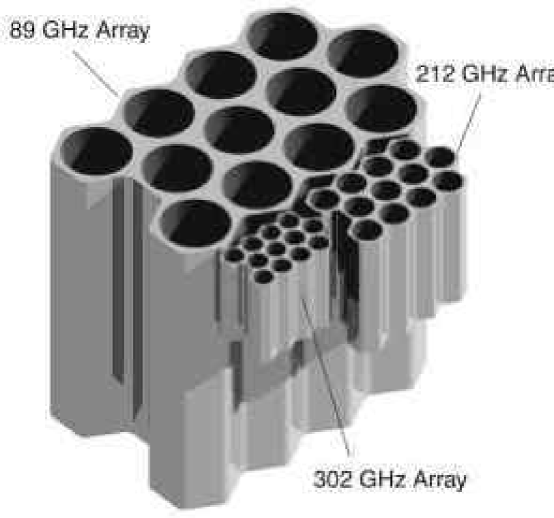
Figure 8 shows the layout of the cold focal plane. The 10 cm diameter focal plane lies at the prime focus of the off-axis primary mirror and is maintained at 100 mK using a 3-stage ADR sunk to a liquid helium reservoir at 1.5 K. The ADR provides 21 W cooling power at 100 mK. Blocking filters limit the infrared heat load from the 20 cm window to the focal plane. Three separate monochromatic feedhorn arrays (Figure 9) built using platelet techniques couple light onto the polarimeter microcircuit.
2.3 Sensitivity
Table 2.3 summarizes the PAPPA instrument sensitivity. It consists of an array of 32 bolometers in three frequency bands centered at 89, 212, and 302 GHz. Each bolometer detects the signal from a horn-coupled planar microstrip polarimeter. Coupling to the microstrip components is efficient (); the total efficiency is dominated by the insertion loss of the microstrip bandpass filters. We achieve NEP W Hz-1/2 in existing bolometers; operating at lower temperature and with better thermal isolation in the support legs will reduce the NEP below W Hz-1/2. PAPPA uses a single ambient-temperature mirror so that the power incident on each bolometer is dominated by emission from the CMB: PAPPA operates within 70% of the CMB photon noise limit. The noise equivalent temperature of a single bolometer observing a polarized CMB source is 26 and 32 K Hz-1/2 for the 89 GHz and 212 GHz channels, and 236 K Hz-1/2 for the 302 GHz channel where the CMB is weaker and the dust foreground is brighter. The number of bolometers in each frequency band is chosen to provide nearly equal signal-to-noise ratio in each band to optimize discrimination between CMB and galactic foregrounds.
| Table 1: Instrument Sensitivity | |||
|---|---|---|---|
| Parameter | Band 1 | Band 2 | Band 3 |
| Center Frequency (GHz) | 89 | 212 | 302 |
| Band Width () | 0.44 | 0.37 | 0.10 |
| Optical Efficiency | 0.7 | 0.7 | 0.5 |
| Bolometer NEP (W Hz-1/2) | |||
| Total NEP (W Hz-1/2) | |||
| Temperature NET (K Hz-1/2) | 18 | 23 | 167 |
| Polarimeter NEQ (K Hz-1/2) | 26 | 32 | 236 |
| Number of Detectors | 12 | 12 | 8 |
| Band NEQ (K Hz-1/2) | 7 | 9 | 83 |
PAPPA will scan a patch of sky, using a raster strategy along lines of constant elevation. A deep scan on a limited patch of sky provides greatest sensitivity to the B-mode signal from gravity waves lewis/etal:2002 . Sky rotation as the gondola tracks the patch provides cross-linking of pixels in multiple directions. Twenty hours of data from a turn-around North American balloon flight provide sensitivity of 1.3 K per 05 beam. Limited sky coverage creates ambiguities when decomposing local Stokes parameters Q and U into the global E and B parameters. We simulate this effect over the PAPPA sky coverage and include it in all sensitivity estimates. PAPPA will characterize the E-mode power spectrum for multipoles and detect or limit B-modes corresponding to tensor/scalar ratio . The PAPPA sensitivity is more than a factor of 5 better than existing upper limits and begins to probe the inflationary signal levels predicted by the WMAP detection of deviations from pure scale invariance.
3 Status and Plans
A prototype of the PAPPA payload will fly in September 2007. This initial payload will consist of a horn-coupled microstrip array using a rotating half-wave plate instead of phase switches to provide the necessary polarization modulation on each detector. A later flight will incorporate the full micro-circuit including the MEMS phase switches to demonstrate the full array.
References
- (1) Kamionkowski, M., Kosowsky, A., and Stebbins, A., PRD, 55, 7368 (1997).
- (2) Kovac, J. M., et al., Nature, 420, 772 (2002).
- (3) Lewis, A., Challinor, A., and Turok, N., PRD, D65 023505 (2002).
- (4) Linde, A. D., New Astronomy Review, 49, 35 (2005).
- (5) Lyth, D. H., and Riotto, A. Phys. Rep., 314, 1 (1999).
- (6) Seljak, U., and Zaldarriaga, M., PRL, 78, 2054 (1997).
- (7) Spergel, D. N., et al., ApJ, submitted (preprint astro-ph/0603449).